Abstract
A pluripotent cell line, C3H10T1/2, is induced to undergo adipogenesis by a mixture of factors that includes a glucocorticoid such as dexamethasone. We found that expression of myostatin (MSTN), a TGF-β family member extensively studied in muscle, was induced by dexamethasone under those differentiation conditions. Moreover, MSTN could substitute for dexamethasone in the adipogenesis mixture. However, the adipocytes induced by MSTN in both cell culture and transgenic mice were small and expressed markers characteristic of immature adipocytes. These adipocytes exhibited cell-autonomous increases in insulin sensitivity and glucose oxidation. In mice, these effects produced elevated systemic insulin sensitivity and resistance to diet-induced obesity. Modulation of the final stages of adipogenesis may provide a novel approach to understanding and treating metabolic disease.
Keywords: diabetes, obesity
Obesity is associated with a metabolic imbalance that produces increased adipose tissue mass caused by a combination of hypertrophy and hyperplasia of adipocytes (1). Importantly, adipose tissue is itself a critical regulator of systemic metabolism (2), which suggests that modulation of adipogenesis should have a greater systemic impact than merely altering adipose tissue mass. Indeed, understanding the signals involved in regulating adipogenesis might have broad implications for diseases such as diabetes.
Adipocytes originate from pluripotent progenitor cells that are recruited to the adipocyte fate (3, 4). A group of factors and cytokines, not fully defined, initiate a differentiation cascade in which a stem cell commits to a lineage, for example, to become a “preadipocyte.” Further signals continue the progression by inducing proliferation and finally differentiation into lipid-laden adipocytes (5). To better define these signals, tissue culture models of adipogenesis have been generated. These studies have identified a “mixture” of factors that includes dexamethasone, insulin, and isobutylmethylxanthine (DIM) that can trigger adipogenesis in cell culture (5). However, specific roles for each component of this mixture are poorly understood.
Myostatin (MSTN), also known as growth and differentiation factor 8 (GDF8), is a member of the TGF-β super family. MSTN function has been extensively studied in muscle tissue (6, 7), whereas its role in adipose tissue is not well understood. For example, dexamethasone induces MSTN expression in muscle cells (8), but it was not known whether this regulation also occurs during adipogenesis, or whether MSTN contributes to the differentiation process. Consistent with a role for MSTN in early stages of adipogenesis, reduction of MSTN expression or activity results in decreased adipose tissue in mice (9–11). In addition, other studies suggested that MSTN plays a role in cell fate decisions, biasing differentiation toward the adipocyte lineage and away from the muscle lineage (12). Paradoxically, however, studies of MSTN expression and action in preadipocytes imply that MSTN inhibits rather than promotes the formation of mature adipocytes (13, 14).
We sought to probe the relationship between MSTN and the dexamethasone component of the DIM mixture and better understand the functions and actions of these signals. We studied how these signals modulate adipogenesis in cell culture and mice and evaluated the cellular and systemic consequences of their actions.
Results
MSTN Is Induced by Dexamethasone in C3H10T1/2 Cells and Contributes to Adipogenesis.
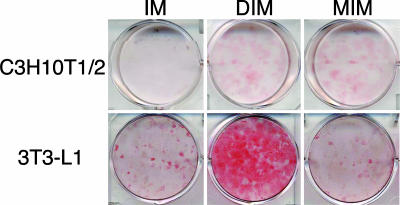
We first examined whether MSTN is induced by dexamethasone in the C3H10T1/2 cell line, which can differentiate into adipose, muscle, bone, or cartilage under specific conditions (15); thus, C3H10T1/2 displays characteristics of mesenchymal stem cells. DIM induces adipogenesis in this cell line (16). The synthetic glucocorticoid dexamethasone is an essential component of the mixture, as the combination of insulin and isobutylmethylxanthine did not lead to adipogenesis (Fig. 1). By quantitative real-time PCR, we found that MSTN expression was undetectable in C3H10T1/2 in the absence of dexamethasone, and that it was significantly induced (>100-fold) after a 4-h exposure to dexamethasone. Thus, MSTN expression is strongly regulated in C3H10T1/2 cells by the glucocorticoid component of the differentiation mixture.
Fig. 1.
MIM induced adipogenesis in C3H10T1/2 cells but not in 3T3-L1 cells. Either C3H10T1/2 (Upper) or 3T3-L1 (Lower) cells were grown to confluence. Cells were then exposed to isobutylmethylxanthine and insulin alone (IM, Left) or with DIM (Center) or MIM (Right). After 6–10 days of culture, cells were fixed and stained with Oil-Red-O to identify adipocytes. IM was not sufficient to induce adipogenesis in either cell line. DIM induced adipogenesis in both cell lines. In C3H10T1/2 cells, but not in 3T3-L1 cells, MIM induced adipogenesis.
We then examined whether adding recombinant purified MSTN could substitute for dexamethasone in the DIM mixture (MIM). As shown in Fig. 1, the MIM mixture induced significant levels of adipogenesis as defined by the accumulation of intracellular lipid droplets as assessed by Oil-Red-O staining (13).
For comparison, we examined 3T3-L1 cells, a widely studied cell line that is further differentiated than the C3H10T1/2 cells because it is committed to the adipocyte lineage. Although 3T3-L1 has not completed differentiation and therefore is commonly called a preadipocyte cell line, it can be efficiently differentiated to mature adipocytes by the DIM mixture. Unlike our finding in C3H10T1/2 cells, the DIM mixture but not the MIM mixture induced adipogenesis in 3T3-L1 cells (Fig. 1). This result is consistent with a prior report studying MSTN action in this cell line (13). Taken at face value, our results suggest that MSTN can induce adipogenesis as part of the MIM mixture if it is presented to very-early-stage cells such as mesenchymal stem cells, but that it has lost its efficacy in adipocyte-committed cells such as 3T3-L1.
MSTN-Induced Adipocytes Are Small and Apparently Immature.
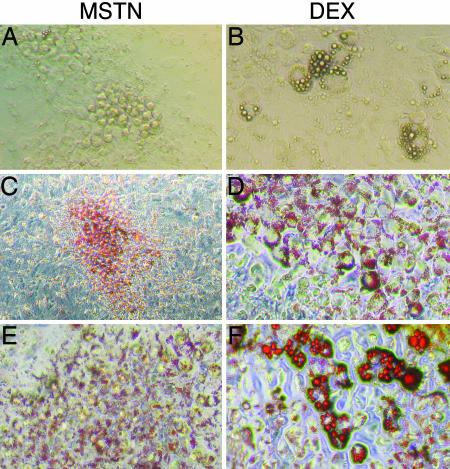
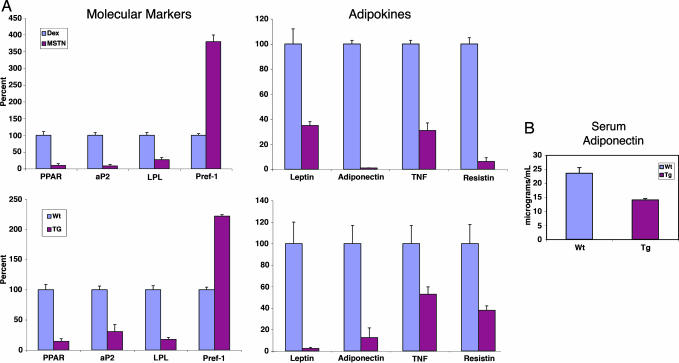
Interestingly, the C3H10T1/2 adipocytes induced by MIM were smaller than those produced by DIM treatment (Fig. 2). To study these small adipocytes further, we measured the expression of a series of adipocyte-specific genes, three of which [peroxisome proliferator-activator receptor γ, the fatty acid-binding protein adipocyte P2 (aP2), and lipoprotein lipase] exhibit elevated expression levels in mature adipocytes, whereas one (preadipocyte factor 1) is expressed at lower levels in mature adipocytes compared with earlier stages in adipogenesis (16, 17). The small adipocytes induced by MSTN expressed these markers in a pattern similar to that observed before completion of adipogenesis (Fig. 3A), suggesting that they may be immature adipocytes.
Fig. 2.
MSTN induced adipogenesis in C3H10T1/2 cells. Adipogenesis was induced in confluent C3H10T1/2 cells with either MIM (A, C, and E) or DIM (B, D, and F). Cells were photographed under light microscopy while in culture (A and B) or after fixation and staining with Oil-Red-O (C–F). Adipocytes formed after MSTN treatment were smaller and appeared to contain less lipid than the adipocytes formed after dexamethasone treatment. Cells exposed to either isobutylmethylxanthine and insulin or each component alone had minimal adipogenesis (data not shown). (Magnification: A, B, E, and F, ×200; C and D, ×100.)
Fig. 3.
Adipocytes generated with MSTN exposure have the expression profile of an immature adipocyte. (A) Real-time quantitative PCR was used to compare the expression patterns between adipocytes formed in culture after MIM or DIM exposure (n = 4 for each condition). (Upper Left) MSTN-induced adipocytes had lower levels of mature adipocyte markers peroxisome proliferator-activator receptor γ (PPAR), aP2, and lipoprotein lipase (LPL) and a higher level of the immature marker preadipocyte factor 1 (Pref-1). (Upper Right) Cultured MSTN-induced adipocytes also had lower expression levels of adipokines compared with dexamethasone-induced adipocytes. (Lower) MSTN transgenic (TG) mice had an analogues immature adipose tissue expression profile and lower levels of adipokine expression. (B) Transgenic animals had lower levels of circulating adiponectin as measured by ELISA performed on serum from transgenic (Tg) mice and WT littermates. Error bars represent SDs.
Mature adipose tissue displays endocrine functions, secreting a number of adipokines (2). Therefore, we measured adipokine expression in the adipocytes generated after MSTN exposure, compared with that in adipocytes induced by dexamethasone. The small adipocytes expressed lower levels of adipokines than those induced by dexamethasone, further supporting the hypothesis that the MSTN-induced adipocytes are immature (Fig. 3A).
Adipocytes in aP2-MSTN Transgenic Mice.
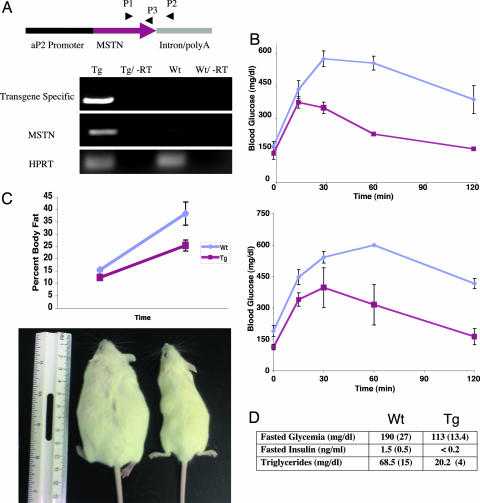
We next investigated the in vivo relevance of our in vitro findings by generating transgenic mice that express MSTN in cells undergoing adipogenesis; specifically, we constructed a MSTN transgene under the control of the aP2 promoter and regulatory element (aP2-MSTN). This promoter is active in the C3H10T1/2 mesenchymal cell line and mouse bone marrow and remains active throughout adipogenesis (Fig. 4A). Use of this promoter and regulatory element has also been validated in other animal models; for example, aP2-Wnt10b mice, generated with the same transgene promoter and enhancer element, display altered mesenchymal stem cell fate (18).
Fig. 4.
aP2-MSTN mice have a favorable metabolic profile and are resistant to obesity. (A) The transgene (Tg) construct was created by subcloning the full-length MSTN cDNA behind an aP2 promoter. Transgenic mice had a 10-fold overexpression of MSTN as detected by quantitative real-time PCR amplification of cDNA generated from the adipose tissue of WT and transgenic mice. Primers P1 and P2 were used to amplify a transgene-specific cDNA, whereas primers P1 and P3 were used to compare total MSTN expression levels. Quantitative PCR amplification of hypoxanthine-guanine phosphoribosyl transferase (HPRT) was used to control for cDNA concentration between samples. (B) Glucose tolerance tests were performed on both lean mice (Upper) and mice on a high-fat diet (Lower). Blood sugar levels were checked after an overnight fast (time = 0) and then 2 g/kg of glucose was injected i.p. After the glucose bolus, tail blood sugar levels were checked at each time point. At the 60-min time point, all WT animals on the high-fat diet had blood sugars above the upper limit of the meter, therefore the upper limit value (600 mg/dl) was used at that time point. aP2-MSTN mice were more insulin sensitive than their WT littermates on both regular (P = 0.0061) and high-fat chow (P = 0.0025). (C) aP2-MSTN mice and their WT littermates were placed on a high-fat diet for 7 weeks. Transgenic mice (Lower Right) were resistant to the obesity that developed in WT animals (Lower Left). (D) aP2-MSTN mice had lower fasting glucose, insulin, and triglyceride levels than their WT littermates. Error bars represent SDs.
Although aP2-MSTN mice were smaller than their WT littermates (Fig. 4C), they otherwise appeared proportional, healthy, and without gross malformations. However, adipose tissue from the aP2-MSTN transgenic mice displayed a gene expression profile and reduced cell size similar to the adipocytes differentiated by the MIM mixture in vitro (Fig. 3A and Fig. 6, which is published as supporting information on the PNAS web site). This profile was in contrast to the expression pattern found in the adipose tissue from the WT mice, which, as expected, displayed the mature adipocyte profile. Consistent with these findings, we showed that serum levels of the adipokine, adiponectin, were reduced in the aP2-MSTN mice relative to WT (Fig. 3B). Therefore, both in vitro and in vivo, MSTN leads to the formation of adipocytes with a distinct expression profile.
Metabolic Effects of MSTN Transgene Expression in Adipose Tissue.
We next investigated the systemic metabolic consequences of the altered adipose tissue in aP2-MSTN mice. We performed glucose tolerance tests on lean mice fed regular chow. Compared with their WT littermates, the transgenic animals exhibited significantly higher levels of insulin sensitivity, as demonstrated by their lower fasting glucose levels, lower hyperglycemia, and more rapid return to euglycemia (Fig. 4B Upper).
We next performed glucose tolerance tests on mice fed a high-fat diet for 7 weeks. WT animals showed evidence of insulin resistance as demonstrated by hyperglycemia and delayed return to euglycemia after receiving a glucose bolus. This finding is common in mice and humans with insulin resistance and is commonly used as a diagnostic test for type II diabetes in humans (19). In striking contrast, the aP2-MSTN transgenic mice maintained normal insulin sensitivity on the high-fat diet, as assessed by their lower fasting blood glucose and normal glucose tolerance tests (Fig. 4B Lower).
Adipocyte Autonomous Increase in Insulin Sensitivity with MSTN Transgene Expression.
To determine whether systemic insulin sensitivity could be attributed to the altered adipocytes, primary adipocytes were purified from WT and transgenic animals, and insulin sensitivity was tested by measuring uptake of [3H]2-deoxyglucose after exposure to insulin. Adipocytes harvested from WT animals responded to insulin with a 3-fold increase in intracellular glucose concentration, whereas adipocytes from the aP2-MSTN animals displayed a 7-fold increase. These results suggest that the insulin sensitivity of the aP2-MSTN mice is, at least in part, a cell-autonomous effect in adipocytes. To assess the possibility that a systemic factor (such as obesity) was affecting these results, the same experiment was performed on C3H10T1/2 cells that had been differentiated into adipocytes in vitro with either MIM or DIM. Adipocytes generated in culture with MIM were 3-fold more insulin sensitive than DIM-induced adipocytes.
Favorable Systemic Insulin, Glucose, and Triglyceride Levels in aP2-MSTN Mice.
To test whether the immature adipocytes were protective against other metabolic derangements, we measured fasting insulin, glucose, and triglyceride levels in the aP2-MSTN mice compared with age-matched WT animals, both maintained on a high-fat diet. The transgenic animals did not display any of the characteristics of metabolic syndrome that were evident in the WT mice. In particular, the transgenic mice had significantly lower fasting insulin, glucose, and triglyceride levels than WT mice (Fig. 4D).
aP2-MSTN Transgenic Mice Have an Increased Metabolic Rate and Are Resistant to Diet-Induced Obesity.
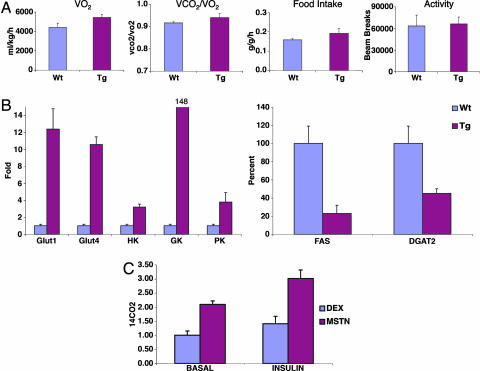
Energy balance was examined in lean (chow-fed) transgenic and WT littermate mice in metabolic cages, which continuously measure food intake, locomotor activity, and metabolic rate as calculated by oxygen consumption (VO2). aP2-MSTN mice had a higher metabolic rate than WT mice (P = 0.005), whereas activity and food intake (normalized to total body mass) were similar (Fig. 5A). This finding suggested that the transgenic animals might be resistant to diet-induced obesity. Consequently, transgenic and control animals were placed on the high-fat diet for 7 weeks, and the quantity of adipose tissue was monitored by dual energy x-ray absorptiometry scanning. As expected, WT mice became obese on this diet with a mean body fat of 38%, whereas the aP2-MSTN mice were resistant to weight gain, reaching a maximum mean body fat of 26% (Fig. 4C). Therefore, the adipocytes present in the aP2-MSTN animals appear to produce a higher metabolic rate and resistance to the development of obesity.
Fig. 5.
aP2-MSTN transgenic mice have an increased metabolic rate with increased glycolysis in their adipose tissue compared with WT littermates. (A) Transgenic (Tg) and WT littermates were placed in metabolic cages that simultaneously measures metabolic rate (as calculated by gas exchange), activity, food intake, and weight. Transgenic animals had an increased metabolic rate (P = 0.005), slightly increased food intake, and similar activity as WT littermates. This increased metabolic rate likely contributes to protecting the animals from obesity. (B) Quantitative real-time PCR was used to measure the expression levels of genes involved in glucose utilization in the adipose tissue of the mice. Transgenic animals had higher expression levels than WT littermates of genes involved in glucose transport (GLUT1 and GLUT4) and enzymes in the glycolysis pathway [glucokinase (GK), hexokinase (HK), and pyruvate kinase (PK)]. In addition, the aP2-MSTN animals had lower expression levels of some of the genes involved in lipogenesis [fatty acid synthase (FAS) and diacylglycerol acyltransferase 2 (DGAT2)]. (C) The rate of glucose oxidation in adipocytes differentiated in tissue culture was directly measured by using 14C glucose (see Methods). Adipocytes generated after exposure to MIM have a cell autonomous higher rate of glucose oxidation than adipocytes generated after DIM exposure (P = 0.001). Error bars represent SDs.
MSTN Transgene Expression Leads to Increased Glucose Oxidation.
We next studied oxygen consumption and aerobic metabolism in lean animals, using metabolic cages to measure the respiratory exchange ratio (VCO2/VO2). Although not statistically significant, the ratio was greater in transgenic animals than in WT animals (Fig. 5A), which suggested that the aP2-MSTN mice may oxidize glucose to generate energy to a greater extent than the WT mice. Consistent with this view, quantitative real-time PCR revealed increased expression of mRNA-encoding glucose transporters GLUT1 and GLUT4, and critical glycolytic enzymes hexokinase, glucokinase, pyruvate kinase, and pyruvate dehydrogenase, in adipose tissue from aP2-MSTN mice. Furthermore, mRNAs for fat biosynthesis enzymes such as fatty acid synthase and acyl CoA:diacylglycerol acyltransferase 2 were down-regulated in the transgenic adipose tissue compared with WT (Fig. 5B). These results suggest that the increased metabolic rate and resistance to obesity found in the transgenic animals reflects increased glucose uptake and glucose oxidation in the adipose tissue.
To determine whether MSTN-induced adipocytes use more glucose in a cell autonomous manner, we directly measured glucose oxidation, using 14C-labeled glucose (see Methods), in C3H10T1/2 cells that had been differentiated to adipocytes with MIM exposure compared with adipocytes generated by DIM treatment. As predicted, the adipocytes generated after MSTN treatment had significantly (P = 0.001) more glucose oxidation than dexamethasone-induced adipocytes (Fig. 5C).
Discussion
We have demonstrated that MSTN is induced by dexamethasone in mesenchymal stem cells, and that it can substitute for dexamethasone to induce adipogenesis. In contrast, MSTN fails to trigger adipogenesis in the 3T3-L1 preadipocyte cell line. We speculate that a sensitive interval may exist during cell fate determination and early differentiation of mesenchymal stem cells in which MSTN can induce adipogenesis, and that the sensitive period ends before the preadipocyte stage represented by the 3T3-L1 cells. This hypothesis could explain the seemingly conflicting effects of MSTN reported previously. In addition, this hypothesis is consistent with the findings in the MSTN knockout mice. These animals have decreased adipose tissue, which may result from impaired initiation of adipogenesis.
Importantly, adipogenesis induced in C3H10T1/2 by MSTN yielded cells that maintain the expression profile of immature adipocytes. Furthermore, expression of MSTN during adipogenesis in vivo produced similar results, with the adipose tissue in these mice maintaining this distinct expression pattern. We postulate that the adipocytes generated after MSTN exposure represent a novel stage in adipogenesis that is further differentiated than the preadipocyte but earlier than the fully differentiated adipocyte. According to this model, dexamethasone-containing differentiation conditions such as the DIM mixture would trigger cells to pass through this stage, whereas MSTN-containing conditions such as the MIM mixture would lead to accumulation of the immature adipocytes. Our findings in the MSTN transgenic mice suggest that MSTN expression may dominantly inhibit this later stage in adipogenesis, as the animals are, of course, glucocorticoid replete. Indeed, we have observed such dominant negative behavior of MSTN in C3H10T1/2 cells (B.J.F., unpublished results). In future studies, it will be interesting to examine the mechanistic relationships of the glucocorticoid and MSTN signals in adipogenesis and determine whether the MSTN-induced cells are precursors along the full differentiation pathway, or rather represent a branch that exits from the pathway.
Finally, it is notable that the MSTN-induced adipocytes have a favorable impact on metabolism. In particular, metabolic studies revealed that these changes result in improved insulin sensitivity and resistance to obesity, which results, at least in part, from increased glucose oxidation. These findings suggest that altering the final stages of adipogenesis, for example, through targeted MSTN exposure, may have a therapeutic benefit for humans with metabolic diseases such as diabetes.
Methods
Tissue Culture and Differentiation Assays.
C3H10T1/2 cells were obtained from the University of California, San Francisco tissue culture core facility. 3T3-L1 cells were obtained from ATCC (Manassas, VA). Cells were grown to confluence in high-glucose DMEM supplemented with 1 mM pyruvate and 10% FBS. Two days after confluence cells were exposed to either 1 μM dexamethasone (Sigma, St. Louis, MO) or 40 nM recombinant MSTN (R&D Systems, Minneapolis, MN) in addition to 11.5 μg/ml isobutylmethylxanthine (Sigma) and 24 ng/ml insulin (Sigma). Cells were cultured for 10 days, and half of the media was replaced with fresh DMEM and 10% FBS every 2 days.
Quantitative PCR.
Quantitative PCR was performed as described (20) with an Opticon2 machine and software (MJ Research, Cambridge, MA). Primer sequences used are available on request.
Generation of Transgenic Mice.
MSTN cDNA was amplified from mouse muscle RNA (Stratagene, La Jolla, CA). The cDNA was subcloned behind the aP2 promoter and regulatory domain and in front of a poly(A) sequence (gifts from Ormond MacDougald, University of Michigan, Ann Arbor, MI). Transgene microinjection and transplant into pseudopregnant mice was performed by the University of California, San Francisco transgenic cancer core facility using the FVB strain. Genotyping was done by PCR using transgene-specific primers. All mice were housed in a pathogen-free barrier-type facility (12-h light/12-h dark cycle). Male mice were used for all studies, and they were fed either a standard chow diet (5053 PicoLab Diet; Purina, St. Louis, MO) or a high-fat, Western-type diet (TD.01064, Harlan-Teklad, Madison, WI) that contains 20% anhydrous milk fat, 1% corn oil, and 0.2% cholesterol by weight. All animal studies were approved by the University of California, San Francisco Committee on Animal Research.
Glucose Tolerance Testing.
Male transgenic (n = 5) and WT (n = 7) littermate animals, at 3–4 months of age, were fasted overnight. Fasting and subsequent glucose levels were obtained from tail vein blood with a One Touch Ultra glucometer and test strips. Glucose (2 g/kg) dissolved in sterile saline was injected into the peritoneal cavity of the mice, and blood glucose was monitored.
Isolation of Primary Adipocytes and Determination of Glucose Transport.
Insulin-stimulated glucose transport in purified primary white adipocytes from transgenic and WT littermates was determined as described (1, 21). Briefly, fat depots where treated with type I collagenase (2 mg/ml; Worthington Biochemical, Lakewood, NJ) and filtered through 500-μm nylon mesh. Adipocytes were washed three times with Krebs-Ringer-Hepes buffer and 2.5% BSA. Cells were incubated with [3H]2-deoxyglucose with and without insulin for 30 min. Adipocytes were purified from media by passing through silicon oil DC550 with phthalic acid dinonyl ester (ratio 2:3). Intracellular [3H]2-deoxyglucose was quantified with a scintillation counter. Adipocyte yield was variable between samples, therefore, insulin sensitivity was internally normalized by calculating fold change between basal and insulin-induced samples.
Rate of Glucose Oxidation.
Rate of glucose oxidation was determined as described (22). Briefly, confluent C3H10T1/2 cells were treated with MIM, DIM, or vehicle and cultured for 10 days as described. Cells were washed and starved for 2 h in Krebes-Ringer-Hepes buffer. C14 glucose alone (basal) or with insulin was added to the media and cells were incubated at 37°C for 2 h. 14CO2 was released with the addition of 2 M HCL and quantified by scintillation counting.
Body Composition.
Mice were fasted for 4 h and anesthetized with isoflurane, and their body composition was analyzed by dual energy x-ray absorptiometry with a PixiMus2 scanner (GE Healthcare Lunar, Madison, WI).
Energy Balance.
Food intake and oxygen consumption (VO2) were measured by indirect calorimetry (Oxymax Comprehensive Lab Animal Monitoring System, Columbus Instruments, Columbus, OH) over 3 days. Both parameters were normalized to lean body mass, as measured by dual energy x-ray absorptiometry scanning on the day of initiating calorimetry studies. Studies were performed on three WT and five transgenic male mice. P values were calculated by using two-tailed t tests.
Supplementary Material
Acknowledgments
We thank Ormand MacDougald for providing the aP2 promoter and enhancer construct; Wally Wang, Stefan Taubert, and David Feldman for comments on the manuscript; members of K.R.Y.’s laboratory for valuable discussions; and Valerie Dougherty for administrative support. This work was supported by National Institutes of Health Grants CA20535 (to K.R.Y.), DK56084 (to R.V.F.), DK07161 and DK73697 (to B.J.F.), and DK56084 (to R.S.S.).
Abbreviations
- MSTN
myostatin
- DIM
dexamethasone/insulin/isobutylmethylxanthine
- MIM
MSTN/insulin/isobutylmethylxanthine
- aP2
adipocyte P2.
Footnotes
The authors declare no conflict of interest.
References
- 1.Shepherd PR, Gnudi L, Tozzo E, Yang H, Leach F, Kahn BB. J Biol Chem. 1993;268:22243–22246. [PubMed] [Google Scholar]
- 2.Kershaw EE, Flier JS. J Clin Endocrinol Metab. 2004;89:2548–2556. doi: 10.1210/jc.2004-0395. [DOI] [PubMed] [Google Scholar]
- 3.Yu ZK, Wright JT, Hausman GJ. Obes Res. 1997;5:9–15. doi: 10.1002/j.1550-8528.1997.tb00277.x. [DOI] [PubMed] [Google Scholar]
- 4.Tang QQ, Otto TC, Lane MD. Proc Natl Acad Sci USA. 2004;101:9607–9611. doi: 10.1073/pnas.0403100101. [DOI] [PMC free article] [PubMed] [Google Scholar]
- 5.MacDougald OA, Mandrup S. Trends Endocrinol Metab. 2002;13:5–11. doi: 10.1016/s1043-2760(01)00517-3. [DOI] [PubMed] [Google Scholar]
- 6.McPherron AC, Lawler AM, Lee SJ. Nature. 1997;387:83–90. doi: 10.1038/387083a0. [DOI] [PubMed] [Google Scholar]
- 7.McNally EM. N Engl J Med. 2004;350:2642–2644. doi: 10.1056/NEJMp048124. [DOI] [PubMed] [Google Scholar]
- 8.Ma K, Mallidis C, Artaza J, Taylor W, Gonzalez-Cadavid N, Bhasin S. Am J Physiol. 2001;281:E1128–E1136. doi: 10.1152/ajpendo.2001.281.6.E1128. [DOI] [PubMed] [Google Scholar]
- 9.McPherron AC, Lee SJ. J Clin Invest. 2002;109:595–601. doi: 10.1172/JCI13562. [DOI] [PMC free article] [PubMed] [Google Scholar]
- 10.Lin J, Arnold HB, Della-Fera MA, Azain MJ, Hartzell DL, Baile CA. Biochem Biophys Res Commun. 2002;291:701–706. doi: 10.1006/bbrc.2002.6500. [DOI] [PubMed] [Google Scholar]
- 11.Zhao B, Wall RJ, Yang J. Biochem Biophys Res Commun. 2005;337:248–255. doi: 10.1016/j.bbrc.2005.09.044. [DOI] [PubMed] [Google Scholar]
- 12.Artaza JN, Bhasin S, Magee TR, Reisz-Porszasz S, Shen R, Groome NP, Fareez MM, Gonzalez-Cadavid NF. Endocrinology. 2005;146:3547–3557. doi: 10.1210/en.2005-0362. [DOI] [PubMed] [Google Scholar]
- 13.Kim HS, Liang L, Dean RG, Hausman DB, Hartzell DL, Baile CA. Biochem Biophys Res Commun. 2001;281:902–906. doi: 10.1006/bbrc.2001.4435. [DOI] [PubMed] [Google Scholar]
- 14.Hirai S, Matsumoto H, Hino N, Kawachi H, Matsui T, Yano H. Domest Anim Endocrinol. 2006 doi: 10.1016/j.domaniend.2005.12.001. in press. [DOI] [PubMed] [Google Scholar]
- 15.Taylor SM, Jones PA. Cell. 1979;17:771–779. doi: 10.1016/0092-8674(79)90317-9. [DOI] [PubMed] [Google Scholar]
- 16.Rosen ED, Spiegelman BM. Annu Rev Cell Dev Biol. 2000;16:145–171. doi: 10.1146/annurev.cellbio.16.1.145. [DOI] [PubMed] [Google Scholar]
- 17.Smas CM, Sul HS. Cell. 1993;73:725–734. doi: 10.1016/0092-8674(93)90252-l. [DOI] [PubMed] [Google Scholar]
- 18.Bennett CN, Longo KA, Wright WS, Suva LJ, Lane TF, Hankenson KD, MacDougald OA. Proc Natl Acad Sci USA. 2005;102:3324–3329. doi: 10.1073/pnas.0408742102. [DOI] [PMC free article] [PubMed] [Google Scholar]
- 19.American Diabetes Association. Diabetes Care. 2006;29(Suppl 1):S43–S48. [PubMed] [Google Scholar]
- 20.Taubert S, Van Gilst MR, Hansen M, Yamamoto KR. Genes Dev. 2006;20:1137–1149. doi: 10.1101/gad.1395406. [DOI] [PMC free article] [PubMed] [Google Scholar]
- 21.Konrad D, Bilan PJ, Nawaz Z, Sweeney G, Niu W, Liu Z, Antonescu CN, Rudich A, Klip A. Diabetes. 2002;51:2719–2726. doi: 10.2337/diabetes.51.9.2719. [DOI] [PubMed] [Google Scholar]
- 22.Powelka AM, Seth A, Virbasius JV, Kiskinis E, Nicoloro SM, Guilherme A, Tang X, Straubhaar J, Cherniack AD, Parker MG, Czech MP. J Clin Invest. 2006;116:125–136. doi: 10.1172/JCI26040. [DOI] [PMC free article] [PubMed] [Google Scholar]
Associated Data
This section collects any data citations, data availability statements, or supplementary materials included in this article.


