

Abstract
The constructive nature of perception can be revealed under viewing conditions that lead to vivid subjective impressions in the absence of direct input. When a low-contrast moving grating is divided by a large gap, observers report seeing a ‘visual phantom’ of the real grating extending through the blank gap region. Here, we report fMRI evidence showing that visual phantoms lead to enhanced activity in early visual areas that specifically represent the blank gap region. We found that neural filling-in effects occurred automatically in areas V1 and V2, independent of where the subject attended. Moreover, when phantom-inducing gratings were paired with competing stimuli in a binocular rivalry display, subjects reported spontaneous fluctuations in conscious perception of the phantom that were accompanied by tightly coupled changes in early visual activity. Our results indicate that phantom visual experiences are closely linked to automatic filling-in of activity at the earliest stages of cortical processing.
Keywords: visual perception, visual cortex, illusions, attention, awareness, consciousness
A particularly vivid and powerful form of perceptual completion involves the formation of moving visual phantoms. When a low-contrast moving grating is divided by an orthogonal gap, subjects typically perceive a dimmer version of the surrounding dynamic pattern continuing across the blank gap region ( Fig. 1a). Visual phantoms are greatly enhanced by motion of the surrounding inducers, and can occur anywhere in the normal visual field across gaps as large as 10 degrees1. These illusory phantoms appear to match the pattern, motion, color, and texture of the physically surrounding inducers, and remarkably, can mimic the perceptual effects of real stimuli. For example, moving phantoms can induce local motion aftereffects, suggesting that phantom impressions are actively represented in the brain2. However, the neural basis of visual phantoms has not been studied previously. Such knowledge is important for understanding how the brain fills-in gaps in sensory information and forms representations of subjective perceptual content in the absence of direct input.
Figure 1.
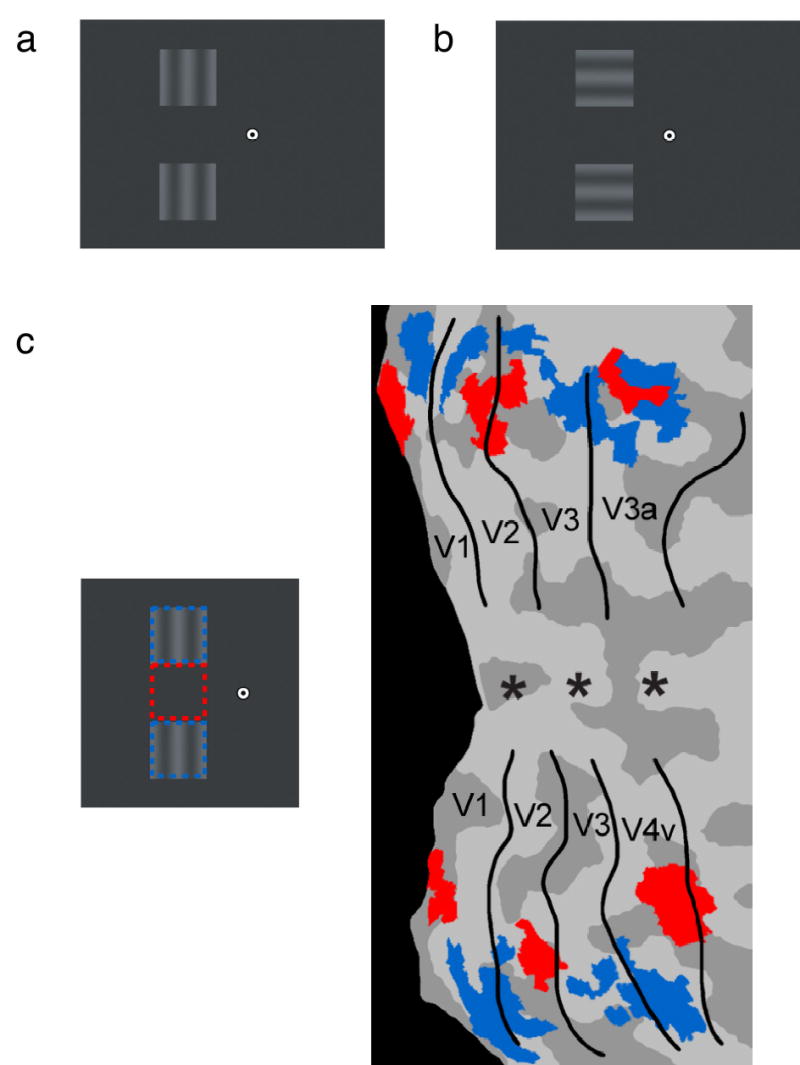
Experimental design and stimuli. Subjects viewed letters at central fixation and oscillating sine-wave gratings in the upper and lower left visual field, separated by a 7° gap. Subjects attended to the identity of the letters or to brief decrements in the contrast of the peripheral gratings. (a) Phantom condition: Vertically aligned gratings led to strong impressions of a phantom grating extending through the blank gap region. A weaker impression of a phantom may be observed here with static gratings. (b) Control condition: Horizontal gratings appeared to move as a perceptual group but failed to lead to an impression of a phantom. (c) Retinotopic regions of interest in areas V1–V4 corresponding to the location of the blank gap (red) and surrounding gratings (blue), shown on the cortical flatmap of a representative subject. Regions were identified in separate scans using flickering checkerboards, and aligned to retinotopic maps collected from the same subject.
We used functional magnetic resonance imaging (fMRI) to measure neural responses to visual phantoms in corresponding regions of the human visual cortex. Subjects maintained central fixation while low-contrast oscillating gratings were presented in the upper and lower left visual field, separated by a large 7° x 7° gap. The gratings were presented either vertically ( Fig. 1a), leading to the perception of a phantom, or horizontally ( Fig. 1b), to serve as a no-phantom control condition. A sequence of letters was presented concurrently at fixation, and subjects were cued prior to each fMRI trial to perform an attentionally demanding task involving either the central letters or the peripheral gratings. This manipulation of spatial attention served as an important control, as it is known that focal attention can activate corresponding regions of visual cortex even when no stimulus is present3,4. Moreover, this manipulation allowed us to test if perceptual filling-in of visual phantoms occurs automatically or requires focused attention. Psychophysical studies of other types of filling-in suggest that some forms of perceptual completion can occur preattentively5,6. We predicted that brain areas involved in visual phantom formation should show greater activity to the vertical phantom condition than to the horizontal no-phantom condition, that enhanced activity to visual phantoms should be specific to retinotopic regions corresponding to the location of the phantom, and that phantom filling-in should involve an automatic process that operates independent of spatial attention. In a second experiment, we further tested if activity corresponding to the blank gap region is tightly coupled to moment-to-moment changes in conscious perception of the visual phantom.
RESULTS
Behavioral results
For the grating task, subjects were instructed to press one of two corresponding buttons to report whenever the top or bottom grating briefly decreased in contrast at random intervals. The letter identification task required subjects to report whenever a “J” or “K” appeared in a rapid sequence of letters presented at fixation. The two tasks were matched for difficulty by independently varying magnitude of contrast change and letter presentation rate. Mean performance was nearly identical for the two tasks and did not significantly differ (grating task 83% correct, letter task 82% correct, T = 0.34, P = 0.743).
In a separate psychophysical experiment performed after the fMRI study, we confirmed that the subjects perceived reliable visual phantoms in the appropriate experimental conditions. Subjects were asked to adjust the contrast of a real grating to match the strength of any perceptual impression they might have in the blank gap between the two gratings. All eight subjects reported stronger visual phantoms when presented with vertically aligned gratings than horizontal gratings (Fig. 1a, b, mean perceived contrast, 1.52% and 0.27% respectively, T = 5.7, P < 0.001).
Regions of interest
The critical regions of interest (ROIs) consisted of the retinotopic regions in visual areas V1 through V4 that corresponded to the visual-field location of the blank gap ( Fig. 1c). Retinotopic regions corresponding to the surrounding gratings served as control ROIs to evaluate the spatial specificity of phantom filling-in effects. All ROIs were localized in separate reference scans by presenting high-contrast flickering checkerboards in the same locations as the surrounding gratings and blank gap region (see Methods). ROIs corresponding to the center of the blank gap were identified by selecting a small, restricted region in each visual area consisting of the most highly active voxels found during the reference scan. Visual areas were delineated on flattened cortical surfaces using standard retinotopic mapping techniques7–9.
Cortical responses to visual phantoms
Average fMRI time courses in regions of V1 and V2 corresponding to the blank gap revealed enhanced activity for visual phantoms ( Fig. 2). Peripheral oscillating gratings and central letters were presented during the 12-second stimulus period (gray inset region), which was preceded and followed by 16-s fixation-baseline periods. Even though there was no physical stimulus in the gap, corresponding regions of V1 and V2 (Fig. 2a, b respectively) showed significantly greater fMRI responses to the vertical phantom condition (solid lines) than to the horizontal no-phantom condition (dashed lines), irrespective of whether subjects were attending to the peripheral gratings (black lines) or to the central letters (gray lines). These enhanced neural responses to illusory visual phantoms were highly reliable, with all 8 subjects showing effects in the predicted direction.
Figure 2.

Average fMRI time courses for retinotopic regions corresponding to the blank gap in areas V1 (a) and V2 (b), plotted as a function of grating orientation and attentional task (n = 8). Both V1 and V2 showed significantly greater responses to the vertical phantom condition (solid lines) than to the horizontal no-phantom condition (dashed lines) during the 12-s stimulus period (gray inset), regardless of whether subjects had to attend to the peripheral gratings (black lines) or to the central letters (gray lines). Side error bars indicate the average ±1 s.e.m. of all data points shown.
Increased responses to the vertical phantom condition were found even under conditions of strong attentional suppression. When subjects were required to attend to the central letters and to ignore the peripheral gratings, negative BOLD responses were found in V1 and V2 regions corresponding to the gap. These results are consistent with previous reports of attentional suppression in early visual areas10 and the fact that stimulation of neighboring cortical regions (by the surrounding gratings) can lead to local suppression of BOLD activity and neuronal firing rates11(Shmuel et al., Society for Neuroscience Abstracts, 125.1, 2003). Despite these powerful effects of attentional suppression, V1 and V2 showed greater responses to the visual phantom condition than to the control condition, even when attention was directed away from the peripheral gratings. These results suggest that neural filling-in of the phantom occurred automatically, independent of the locus of attention, in these early visual areas.
Cortical locus of phantom-enhanced activity
To determine the retinotopic and cortical foci of these responses to visual phantoms, we compared fMRI response amplitudes to the vertical and horizontal grating conditions for all regions of interest. If the enhanced fMRI responses found in V1 and V2 truly correspond to an internal representation of the visual phantom, then these enhancement effects should be specific to the blank gap region and absent from the stimulus surround. This prediction can be distinguished from the well-documented effects of collinear facilitation observed in primary visual cortex. These studies show that V1 neurons respond more strongly to an oriented target in their receptive field if collinear flanking stimuli are presented outside of the receptive field, even though the flanking stimuli alone evoke negligible response in absence of the target12,13. Therefore, collinear facilitation leads to the opposite prediction of phantom filling-in, namely that response enhancement should primarily occur in retinotopic regions that receive direct stimulation from the collinear vertical gratings but not in regions corresponding to the blank gap where the phantom is perceived.
We measured cortical responses to the visual phantom by calculating the difference in fMRI activity for the vertical-phantom condition minus the horizontal no-phantom condition, separately for each visual area, retinotopic location and attentional condition, separately ( Fig. 3). Significant positive deviations indicate enhanced responses to the visual phantom. Early visual areas corresponding to the blank region showed strong evidence of phantom-enhanced activity ( Fig. 3a), whereas no such enhancement was found in retinotopic regions corresponding to the physically surrounding gratings ( Fig. 3b). These results provide strong support for the notion that visual phantom formation involves filling-in of neural activity in early visual areas that specifically represent the blank gap.
Figure 3.
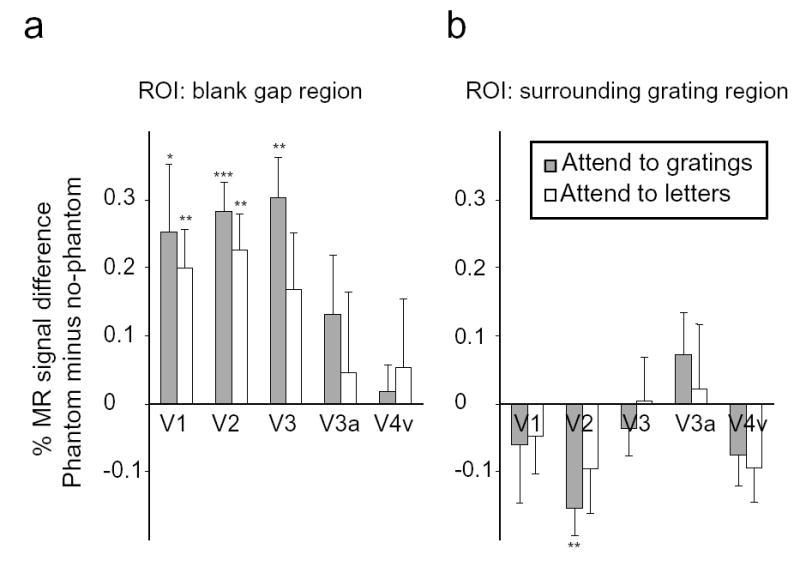
Magnitude of responses to visual phantoms in retinotopic regions corresponding to the blank gap (a) and the surrounding gratings (b). Ordinate axis shows the difference in fMRI activity levels for the vertical phantom condition minus the horizontal no-phantom condition. Gray bars indicate attention to peripheral gratings; white bars indicate attention to central letters. Error bars denote standard error of the mean across subjects. Significant differences in fMRI activity between the vertical phantom and horizontal control conditions are indicated (* P < 0.05; ** P < 0.01; *** P < 0.001).
Additional analyses revealed that V1 and V2 were the only visual areas corresponding to the blank gap that showed consistently greater responses to the visual phantom ( Fig. 3a), independent of attention. Area V3 showed enhanced responses to visual phantoms when attention was directed to the peripheral gratings, but showed unreliable effects when the gratings were ignored. Activity in higher visual areas, V3a and V4v, did not reliably differ for the vertical phantom condition and the horizontal no-phantom condition (F < 1). One possible interpretation is that higher visual areas are less involved in phantom filling-in. Alternatively, it is possible that enhanced activity to visual phantoms was more difficult to detect in higher areas because of the larger point-spread function of visual projections to these areas. In any case, the positive results indicate robust effects in areas V1 and V2, suggesting that activity in these early visual areas may be important for perceptual filling-in of visual phantoms.
As a further test of the retinotopic specificity of these responses to visual phantoms, we compared effect sizes for small and large ROIs. If enhanced V1 responses to the vertical gratings truly reflect filling-in of the illusory phantom, then one would predict stronger enhancement effects for small ROIs that closely correspond to the center of the gap where only the phantom is perceived. However, if enhanced activity instead reflects a stimulus-driven response to the neighboring border of the surrounding gratings, then one would predict stronger enhancement effects for large ROIs that extend toward the boundary between gap and stimulus. Whereas all previous analyses focused on small ROIs (~200 mm3) identified in separate reference scans at high threshold, here we generated enlarged ROIs (~630 mm3) by lowering statistical thresholds until ROI sizes matched V1 cortical magnification estimates of the blank gap region9. Statistical comparisons revealed significantly greater response enhancement for visual phantoms in small ROIs than large ROIs (0.23% versus 0.16% signal change respectively, F1,7 = 5.9; P < 0.05). These results suggest that the enhanced responses in V1 reflect phantom impressions around the center of the gap rather than a stimulus-driven response to the border of the surrounding gratings.
Attentional modulation effects
The effects of spatial attention were widespread and independent of the effects of phantom filling-in. Activation maps plotted on flattened cortical surfaces revealed that extensive regions of visual cortex were modulated by spatial attention ( Fig. 4a). Cortical representations of the visual periphery were much more active when subjects attended to the peripheral gratings (yellow-red regions), whereas foveal regions were more active when subjects attended to the central letters (green-blue regions). The peripheral regions showing strong attentional enhancement overlapped considerably with ROIs corresponding to the blank gap and surrounding gratings ( Fig. 1c).
Figure 4.

Attentional modulation effects across visual areas. (a) Activation map of a representative subject, displayed on the flattened cortical surface with visual areas delineated. Attention to peripheral gratings activated peripheral retinotopic regions (yellow-red) whereas attention to the central letters activated foveal regions (green-blue) more strongly. Asterisks indicate the location of the foveal cortical representation. Magnitude of attentional modulation averaged across subjects in retinotopic regions corresponding to the blank gap (b) and the surrounding gratings (c). Ordinate axis shows the difference in fMRI activity levels for the attend gratings condition minus the attend letters condition. Gray bars indicate the vertical grating condition; white bars indicate the horizontal grating condition (error bars, ±1 s.e.m.). Retinotopic regions in each visual area showed highly significant attentional modulation effects (P < 0.0001), and modulations were significantly stronger in higher visual areas (F4,34 = 6.9, P < 0.0005).
We further measured the magnitude of attentional enhancement for each grating condition and ROI by calculating the difference in activity level for attention to gratings minus attention to letters. Unlike the effects of phantom filling-in, which were spatially specific to V1 and V2 regions corresponding to the blank gap, attentional modulation effects were equally powerful in regions corresponding to the gap ( Fig. 4b) and regions corresponding to the surrounding gratings ( Fig. 4c). These modulation effects were highly significant for every visual area (P < 0.0001) but were significantly stronger in higher visual areas than early visual areas (F4,34 = 6.9, P < 0.0005). In contrast, phantom filling-in effects were found only in early visual areas. Taken together, these results indicate that the effects of visual attention, across both retinotopic space and visual hierarchy, were independent of the effects of phantom filling-in.
Neural correlates of conscious perception
We conducted an additional experiment in three subjects to evaluate if the activity in early visual areas is tightly coupled to the conscious perception of visual phantoms, independent of possible low-level visual differences between stimulus conditions. To address this issue, we devised a novel binocular rivalry display to manipulate perception of the visual phantom while the physical stimuli were held constant. Binocular rivalry occurs when different stimuli are presented to the two eyes, leading to spontaneous alternations in conscious perception between the two monocular images14. Our display consisted of vertically aligned grating inducers shown to one eye ( Fig. 1a), which if viewed alone would elicit perception of a visual phantom, and rivaling horizontal gratings presented to corresponding locations of the other eye ( Fig. 1b). When subjects viewed this display while maintaining steady fixation, they reported experiencing spontaneous alternations between perceptual dominance and suppression of the visual phantom every few seconds. The visual phantom was perceived only when both vertical gratings were dominant; no phantom was perceived when either or both of the horizontal gratings predominated. Subjects were instructed to press one of three keys to indicate whether they perceived the visual phantom, both horizontal gratings and no phantom, or mixed dominance and no phantom. To perform the task, subjects had to attend steadily to the spatial regions corresponding to the surrounding gratings and intervening gap. Therefore, unlike the first experiment, spatial attention was held constant in this experiment while perception fluctuated spontaneously. Because the physical stimuli remained constant throughout the experiment, any activity that varied in accordance with perceptual dominance of the phantom can only be attributed to changes in conscious perception rather than changes in the physical stimuli.
We used event-related fMRI analyses to isolate awareness-related activity15 corresponding to when subjects perceived the visual phantom or no phantom. Awareness-related activity obtained under conditions of rivalry viewing was further compared to the activity evoked by physical stimulus alternation. In separate fMRI runs, subjects viewed physical alternations between the two monocular displays ( Fig. 1a, b) consisting of the same temporal sequence of alternations reported in a previous rivalry run.
Event-related analyses of retinotopic regions corresponding specifically to the blank gap region revealed a tight coupling between early visual activity and conscious perception of the visual phantom ( Fig. 5). When the visual phantom was dominant during rivalry viewing, a concomitant rise in fMRI activity was observed in areas V1 through V3, with peak activity occurring about 5 to 7 seconds after the reported emergence of the phantom (black solid lines). In contrast, perceptual suppression of the phantom was accompanied by suppressed activity in these same cortical areas, with similar time courses for negatively peaking activity (gray dashed lines). Linear trend analyses revealed that activity changes in V1 and V2 were statistically reliable for all three subjects (P < 0.05), and reliable for 2 out of 3 subjects in V3. Awareness-related activity changes during rivalry were remarkably similar to activity changes evoked by physical stimulus alternation, both in terms of their amplitude and time course. We constructed a scatterplot to compare the amplitude of activity changes for rivalry and stimulus alternation, based on the peak-to-trough difference in fMRI signal intensity, for each subject, percept type, and visual area ( Fig. 6). Positive points indicate positive fMRI responses corresponding to visual phantom perception; negative points indicate negative fMRI responses corresponding to no-phantom perception. All points clustered closely to the line of unity (slope 0.98, intercept 0.002, R2 = 0.93, T = 14.27, P < 10−9), and did not reliably differ from a predicted slope of 1 (T = 0.26, P = 0.80) or an intercept of 0 (T = 0.12, P = 0.91) corresponding to identical response amplitudes for rivalry and stimulus alternation. Therefore, changes in conscious perception of the visual phantom, in the absence of any physical stimulus change, led to cortical responses that were as strong as those evoked by stimulus-driven changes. These data demonstrate a tight coupling between activity in early visual areas that represent the blank gap region and moment-to-moment fluctuations in conscious perception of the visual phantom.
Figure 5.
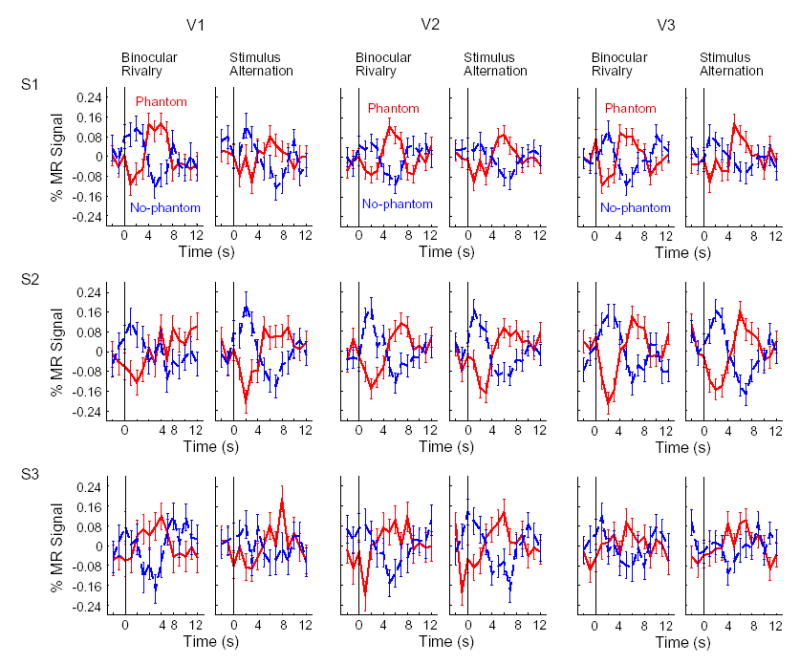
Event-related activity for reported percepts of phantom (black solid lines) and no-phantom (gray dashed lines) during rivalry and stimulus alternation. Average time courses show activity corresponding to the blank gap in areas V1–V3 for all 3 subjects (error bars, ±1 s.e.m.). Activity corresponding specifically to the blank gap was measured based on the difference in fMRI activity for the blank gap region minus the surrounding region. Vertical lines at time 0 s indicate when the subject reported seeing a phantom or no phantom.
Figure 6.

Comparison of response amplitudes for rivalry and stimulus alternation, for reported percepts of phantom (positive points) and no-phantom (negative points). Amplitudes reflect the peak-to-trough difference in fMRI response (time window 0–7 s) for each subject, visual area and condition. All data points fall closely to line of unity (line of best fit: slope 0.98, intercept 0.002), indicating equivalent response amplitudes for rivalry and stimulus alternation.
DISCUSSION
Our study suggests that the formation of visual phantoms results from automatic filling-in of activity in early visual areas. Illusory visual phantoms that spanned a large blank gap led to spatially specific enhancement of activity in corresponding regions of V1 and V2. These phantom filling-in effects appeared to occur automatically, independently of the locus of spatial attention, and remained robust even when subjects had to attend away from the peripheral gratings. Unlike the spatially restricted effects of phantom filling-in in V1 and V2, manipulations of spatial attention led to global modulations in activity across all visual areas in regions corresponding to both the blank gap and the stimulus surround. In a second experiment, subjects were presented with a novel binocular rivalry display to evaluate if moment-to-moment changes in conscious perception of the visual phantom, in the absence of any physical stimulus change, would lead to concomitant changes in early visual activity. Results revealed a tight coupling between awareness of the visual phantom and activity in early visual areas. These awareness-related activity changes are unlikely to be explained in terms of shifts in spatial attention, judging from the results of the first experiment, and instead, appear to reflect the neural representation of the phenomenal visibility of the visual phantom.
The combined results suggest that phantom filling-in involves a fairly automatic, bottom-up cortical mechanism that does not require focal attention, yet this mechanism cannot be triggered by the simple presentation of phantom-inducing stimuli to the retina. Previous fMRI studies have shown that rivalry suppression can strongly modulate activity in human V1, despite the presence of steady retinal input16–18. These studies led us to predict that binocular rivalry might be capable of suppressing the neural formation of visual phantoms at this same early site. Consistent with this prediction, we found that rivalry suppression of the phantom-inducing gratings led to the suppression of both the phenomenal visibility of the phantom and corresponding activity in visual areas as early as V1. Therefore, intact cortical processing of the surrounding inducer gratings seems to be necessary for phantom filling-in to occur. Our results provide support for the view that attentional and perceptual mechanisms offer distinct contributions to visual awareness; both appear necessary for reporting a visual experience19,20. Attention is commonly thought to reflect a flexible, domain-general system that is needed to access and to report the contents of perception (presumably by enhancing and ‘broadcasting’21 a subset of sensory signals), whereas the representation of perceptual content itself is thought to depend on domain-specific sensory areas of the brain. Our results suggest that the neural representation of visual phantoms occurs in early visual areas, and that the perceptual contents of these representations are readily available to awareness once they are accessed by attentional mechanisms.
These findings suggest that early visual areas have an important role in representing subjective visual content in the absence of direct sensory input. The results pertain to an ongoing debate regarding the relative roles of early and high-level visual areas in conscious perception20,22 and to philosophical and psychological discussions regarding whether the brain needs to fill-in information that is absent23–26. Our data suggest that the brain does recreate visual representations in “zones of absence”, and that these representations of subjective content can be realized at the earliest stages of cortical processing, including primary visual cortex20.
The present findings also contribute to current understanding of the neural interactions that mediate various forms of perceptual filling-in. Filling-in is known to occur in many sensory modalities, across multiple scales of space and time, and likely involves cooperative mechanisms that operate at multiple spatial-temporal scales and stages of processing26–31. In the visual domain, single-unit studies have found evidence of receptive field enlargement in V1 due to small retinal scotomas32–35, enhanced responses to illusory contours in V236, and dynamic filling-in of artificial scotomas in V337. Here, using fMRI, we were able to monitor activity across multiple visual areas and show that enhanced activity to moving visual phantoms occurred independently of the locus of attention in areas V1 and V2. Our results provide novel evidence that missing information about visual orientation or moving patterns can be automatically filled-in at the earliest stages of cortical processing, even when spatial attention is directed elsewhere. These findings concur with a recent fMRI study showing color filling-in effects in human V138, and indicate that primary visual cortex is involved in the perceptual completion of multiple types of visual features, including color, pattern and motion information.
What types of neural interactions might account for the long-range perceptual completion of visual phantoms? As discussed, top-down effects of attentional feedback appear unlikely to account for our results. Instead, the prominent filling-in effects found in V1 and V2 indicate that activity corresponding to the surrounding gratings can automatically propagate to retinotopic regions representing the blank gap. This propagating activity might arise from long-range horizontal connections between neighboring columns with similar orientation preferences39, dynamic interactions between V1 and V240, or automatic feedback interactions between higher visual areas with large receptive fields and early areas41. The present study found positive evidence in favor of the first two possibilities, with areas V3a and V4v failing to show reliable effects of phantom filling-in. However, the larger point-spread function in these higher visual areas may have led to more spatially diffuse effects of filling-in. Consistent with this possibility, intermediate areas such as V3 showed more mixed evidence of filling-in. Regardless of the underlying mechanisms for propagating activity, the results indicate that phantom filling-in effects emerge at the earliest stage of cortical processing in the primary visual cortex.
This study also provides novel evidence to link neural filling-in activity with moment-tomoment changes in conscious perception, under conditions of rivalry viewing. Our results indicate that the neural mechanisms underlying binocular rivalry can strongly influence and even suppress the mechanisms underlying visual phantom formation. Suppression effects were robust; rivalry responses to visual phantoms were as strong as the responses evoked by stimulus alternation. Current theories suggest that rivalry can result from competition at multiple levels of visual processing42. Nonetheless, several functional imaging studies have demonstrated highly reliable effects of rivalry suppression in human V116–18. According to the present study, binocular rivalry not only suppresses the neural representation of real stimuli, but can also suppress the neural representation of illusory stimuli in regions of visual cortex that fail to receive direct stimulation.
Our study provides concurrent evidence suggesting that early visual areas, including V1, may have an important role in both selective and constructive aspects of conscious perception. Selective perception is evident when observers are aware of only one of two rivaling images present on the retinae; constructive perception is evident when observers experience phantom visual impressions in regions that lack direct retinal input. Future studies may further reveal the contribution of early visual areas to the selective and constructive nature of human visual experience.
METHODS
Subjects
Eight right-handed healthy adults (two females) with normal or corrected-to-normal visual acuity participated in the first experiment. Three male subjects participated in the second experiment. All subjects gave informed written consent. The study was approved by the Institutional Review Panel for Human Subjects at Princeton University.
Experimental design and stimuli
Visual stimuli were rear-projected onto a screen in the scanner bore using a luminance-calibrated LCD projector driven by a Macintosh G3 computer. The top grating, bottom grating and the middle blank area were each 7° × 7° in size, with the center of the blank gap positioned 8° to the left of fixation. Stimulus parameters were set to optimize the perceptual salience of the moving visual phantom in the vertical grating condition (contrast 15%, spatial frequency 0.286 cyc/deg, temporal frequency 1.13 cyc/s, direction reversal every second) with the mean luminance of the background set to match the lowest luminance portion of the gratings43. Horizontal peripheral gratings consisted of the same stimuli rotated by 90 degrees. During fixation-rest periods, gratings were replaced by uniform gray squares that matched the mean luminance of the gratings.
In the first experiment, a randomized fMRI block design was used to measure cortical responses to vertical and horizontal peripheral gratings ( Fig. 1) while subjects maintained fixation on a sequence of centrally presented letters (letter size ~0.4°, fixation size 0.6°). Stimuli were presented for 12-second periods, interleaved between 16-second fixationrest periods. A letter cue was presented above the fixation point for 1 second prior to each stimulus period to indicate whether subjects had to monitor for the appearance of a “J” or “K” in the letter sequence or to monitor for brief contrast decrements (180 ms duration) of the top or the bottom peripheral grating. To balance the difficulty level of the two tasks, letter presentation rates and the magnitude of the contrast decrement were adjusted on each run to achieve a performance level of about 80% correct detection (letter presentation rates 160–220 ms/item, contrast decrements 8–10%). Both types of targets appeared on 6 occasions in every stimulus block at randomly selected intervals. The four experimental conditions (2 grating orientations x 2 attentional tasks) appeared in a randomized order twice in each run, and each subject performed 8–12 runs in a single experimental session.
In the second experiment, red-green anaglyph filters were used to present vertical gratings to one eye and horizontal gratings of equal luminance and contrast to the other eye ( Fig. 1a, b). Stimulus parameters were otherwise identical to those used in the first experiment. During rivalry fMRI runs, both vertical and horizontal gratings were continuously presented over the entire 2-min period while subjects reported the perceptual dominance of the visual phantom. On stimulus alternation runs, the two monocular displays were presented in alternation using the same temporal sequence of reported alternations from a previous rivalry run. Stimulus alternation was achieved by adjusting the relative contrast of each display over a 250-ms time window. Each subject performed a total of 20–26 rivalry runs and an equal number of stimulus alternation runs over the period of two 2.5-hr fMRI sessions. To control for possible effects of eye dominance, eye assignment of red-green filters was counterbalanced across sessions, and subjects received an equal number of fMRI runs in which vertical/horizontal stimuli were assigned to either eye.
MRI acquisition
Scanning was performed on a 3.0-Tesla Siemens MAGNETOM Allegra scanner using a standard head coil at the Center for the Study of Brain, Mind, and Behavior, Princeton University. A high-resolution T1-weighted 3D-MPRAGE anatomical scan was acquired for each participant (FOV 256×256, 1 mm3 resolution). To measure BOLD contrast, standard T2*-weighted gradient-echo echoplanar imaging was used to acquire 25 slices perpendicular to the calcarine sulcus to cover the entire occipital lobe. (First experiment: TR 2000 ms, TE 30 ms, flip angle 90°, slice thickness 3 mm, slice gap 0.75 mm, in-plane resolution 3 × 3 mm. Second experiment: TR 1000 ms, TE 35 ms, flip angle 65°.) Visual areas were delineated in a separate session by using rotating wedges and expanding rings to map the boundaries between visual areas on flattened cortical representations7–9. ROIs corresponding to the locations of the blank gap and the surrounding gratings ( Fig. 1c) were identified in separate reference scans using high-contrast flickering checkerboard stimuli.
MRI analysis
All fMRI data underwent 3-D motion correction and were analyzed using Brain Voyager software and custom-routines in Matlab. Slow drifts in signal intensity were removed by linear detrending; no spatial or temporal smoothing was applied. The general linear model was used to identify voxels that significantly correlated with a predicted hemodynamic time course derived by convolving a gamma function with the relevant stimulus periods in the flickering checkerboard reference scans. ROIs corresponding to the blank gap were selected at a high statistical threshold and adjusted to yield ROI sizes of 200 mm3 for each visual area (minimum threshold T = 3.3, P < 0.001, max T = 16.8). ROIs for V1, V2, and V3 were 200 mm3 in volume when pooled across the most active voxels in both dorsal and ventral regions. Our rationale for choosing this fairly small ROI size (equivalent to 7.4 voxels of 3 x 3 x 3 mm size) was to focus on activity corresponding to the center of the blank gap region without compromising signal-to-noise in our fMRI measurements. Matching of ROI sizes further ensured that statistical comparisons across visual areas and regions of interest were as comparable as possible. ROIs corresponding to the locations of both surrounding gratings were selected in a similar manner by adjusting thresholds to yield a total volume of 200 mm3 in each visual area. Average event-related fMRI time courses were calculated for each ROI, experimental condition and subject. For the first experiment, average fMRI amplitudes were measured based on the peak of the hemodynamic response (averaged across time points 6–12 seconds post-stimulus onset) relative to prestimulus activity levels (from time points −4 to 0 seconds). Within-subjects analysis of variance and planned comparisons were used to test for statistically reliable differences (P < 0.05) in fMRI response amplitudes for each experimental condition and retinotopic region of interest.
In the second experiment, fMRI intensities were normalized relative to the mean intensity of each run, after discarding the first 12 seconds to avoid transient activity corresponding to the onset of the visual display. Activity corresponding specifically to the blank gap was isolated by calculating the difference in fMRI activity for the blank gap region minus the surrounding region for every fMRI run, prior to event-related averaging. fMRI data were sorted and binned in an event-related fashion according to the time of reported percepts of phantom or no-phantom, using previously described methods15,17. Because fMRI responses are dependent on the duration of neural activity, brief percepts of less than 2 seconds were excluded from the analysis. Event-related fMRI amplitudes were measured based on the peak-to-trough difference in activity by identifying points of maximal deflection for the initial peak/trough (time window 0–2s) and final peak/trough (time window 5–7s).
Acknowledgments
We thank Y. Kamitani, Y. Sasaki and A. Seiffert for helpful comments on earlier versions of this manuscript, and the Center for the Study of Brain, Mind and Behavior, Princeton University, for MRI support. This work was supported by grant R01 EY14202 from the US National Institutes of Health to FT.
References
- 1.Tynan P, Sekuler R. Moving visual phantoms: A new contour completion effect. Science. 1975;188:951–952. doi: 10.1126/science.1138365. [DOI] [PubMed] [Google Scholar]
- 2.Weisstein N, Maguire W, Berbaum K. Phantom-Motion Aftereffect. Science. 1977;198:955–958. doi: 10.1126/science.929181. [DOI] [PubMed] [Google Scholar]
- 3.Kastner S, Pinsk MA, De Weerd P, Desimone R, Ungerleider LG. Increased activity in human visual cortex during directed attention in the absence of visual stimulation. Neuron. 1999;22:751–61. doi: 10.1016/s0896-6273(00)80734-5. [DOI] [PubMed] [Google Scholar]
- 4.Ress D, Backus BT, Heeger DJ. Activity in primary visual cortex predicts performance in a visual detection task. Nat Neurosci. 2000;3:940–5. doi: 10.1038/78856. [DOI] [PubMed] [Google Scholar]
- 5.Ramachandran VS. Filling in the blind spot. Nature. 1992;356:115. doi: 10.1038/356115a0. [DOI] [PubMed] [Google Scholar]
- 6.Rauschenberger R, Yantis S. Masking unveils pre-amodal completion representation in visual search. Nature. 2001;410:369–72. doi: 10.1038/35066577. [DOI] [PubMed] [Google Scholar]
- 7.Sereno MI, et al. Borders of multiple visual areas in humans revealed by functional magnetic resonance imaging. Science. 1995;268:889–93. doi: 10.1126/science.7754376. [DOI] [PubMed] [Google Scholar]
- 8.DeYoe EA, et al. Mapping striate and extrastriate visual areas in human cerebral cortex. Proc Natl Acad Sci U S A. 1996;93:2382–6. doi: 10.1073/pnas.93.6.2382. [DOI] [PMC free article] [PubMed] [Google Scholar]
- 9.Engel SA, Glover GH, Wandell BA. Retinotopic organization in human visual cortex and the spatial precision of functional MRI. Cereb Cortex. 1997;7:181–92. doi: 10.1093/cercor/7.2.181. [DOI] [PubMed] [Google Scholar]
- 10.Somers DC, Dale AM, Seiffert AE, Tootell RB. Functional MRI reveals spatially specific attentional modulation in human primary visual cortex. Proc Natl Acad Sci U S A. 1999;96:1663–8. doi: 10.1073/pnas.96.4.1663. [DOI] [PMC free article] [PubMed] [Google Scholar]
- 11.Shmuel A, et al. Sustained negative BOLD, blood flow and oxygen consumption response and its coupling to the positive response in the human brain. Neuron. 2002;36:1195–210. doi: 10.1016/s0896-6273(02)01061-9. [DOI] [PubMed] [Google Scholar]
- 12.Polat U, Mizobe K, Pettet MW, Kasamatsu T, Norcia AM. Collinear stimuli regulate visual responses depending on cell's contrast threshold. Nature. 1998;391:580–4. doi: 10.1038/35372. [DOI] [PubMed] [Google Scholar]
- 13.Kapadia MK, Ito M, Gilbert CD, Westheimer G. Improvement in visual sensitivity by changes in local context: parallel studies in human observers and in V1 of alert monkeys. Neuron. 1995;15:843–56. doi: 10.1016/0896-6273(95)90175-2. [DOI] [PubMed] [Google Scholar]
- 14.Levelt WJ. On binocular rivalry. Soesterberg, Netherlands: Inst. Perception Rvo-Tno; 1965. p. 110. 1965. [Google Scholar]
- 15.Tong F, Nakayama K, Vaughan JT, Kanwisher N. Binocular rivalry and visual awareness in human extrastriate cortex. Neuron. 1998;21:753–9. doi: 10.1016/s0896-6273(00)80592-9. [DOI] [PubMed] [Google Scholar]
- 16.Polonsky A, Blake R, Braun J, Heeger DJ. Neuronal activity in human primary visual cortex correlates with perception during binocular rivalry. Nat Neurosci. 2000;3:1153–9. doi: 10.1038/80676. [DOI] [PubMed] [Google Scholar]
- 17.Tong F, Engel SA. Interocular rivalry revealed in the human cortical blind-spot representation. Nature. 2001;411:195–9. doi: 10.1038/35075583. [DOI] [PubMed] [Google Scholar]
- 18.Lee SH, Blake R, Heeger DJ. Traveling waves of activity in primary visual cortex during binocular rivalry. Nat Neurosci. 2005;8:22–3. doi: 10.1038/nn1365. [DOI] [PMC free article] [PubMed] [Google Scholar]
- 19.Lamme VA. Why visual attention and awareness are different. Trends Cogn Sci. 2003;7:12–18. doi: 10.1016/s1364-6613(02)00013-x. [DOI] [PubMed] [Google Scholar]
- 20.Tong F. Primary visual cortex and visual awareness. Nat Rev Neurosci. 2003;4:219–29. doi: 10.1038/nrn1055. [DOI] [PubMed] [Google Scholar]
- 21.Baars BJ. The conscious access hypothesis: origins and recent evidence. Trends Cogn Sci. 2002;6:47–52. doi: 10.1016/s1364-6613(00)01819-2. [DOI] [PubMed] [Google Scholar]
- 22.Rees G, Kreiman G, Koch C. Neural correlates of consciousness in humans. Nat Rev Neurosci. 2002;3:261–70. doi: 10.1038/nrn783. [DOI] [PubMed] [Google Scholar]
- 23.Dennett DC. Consciousness explained. Little Brown; Boston, MA: 1991. [Google Scholar]
- 24.Ramachandran VS. Filling in gaps in logic: reply to Durgin et al. Perception. 1995;24:841–5. doi: 10.1068/p240841. [DOI] [PubMed] [Google Scholar]
- 25.Durgin FH, Tripathy SP, Levi DM. On the filling in of the visual blind spot: some rules of thumb. Perception. 1995;24:827–40. doi: 10.1068/p240827. [DOI] [PubMed] [Google Scholar]
- 26.Pessoa L, Thompson E, Noe A. Finding out about filling-in: a guide to perceptual completion for visual science and the philosophy of perception. Behav Brain Sci. 21:723–48. doi: 10.1017/s0140525x98001757. discussion 748–802 (1998). [DOI] [PubMed] [Google Scholar]
- 27.Ramachandran VS, Gregory RL. Perceptual filling in of artificially induced scotomas in human vision. Nature. 1991;350:699–702. doi: 10.1038/350699a0. [DOI] [PubMed] [Google Scholar]
- 28.Ramachandran VS, Rogers-Ramachandran D, Stewart M. Perceptual correlates of massive cortical reorganization. Science. 1992;258:1159–60. doi: 10.1126/science.1439826. [DOI] [PubMed] [Google Scholar]
- 29.Shams L, Kamitani Y, Shimojo S. Illusions. What you see is what you hear. Nature. 2000;408:788. doi: 10.1038/35048669. [DOI] [PubMed] [Google Scholar]
- 30.Chen LM, Friedman RM, Roe AW. Optical imaging of a tactile illusion in area 3b of the primary somatosensory cortex. Science. 2003;302:881–5. doi: 10.1126/science.1087846. [DOI] [PubMed] [Google Scholar]
- 31.Paradiso MA, Nakayama K. Brightness perception and filling-in. Vision Res. 1991;31:1221–36. doi: 10.1016/0042-6989(91)90047-9. [DOI] [PubMed] [Google Scholar]
- 32.Kaas JH, et al. Reorganization of retinotopic cortical maps in adult mammals after lesions of the retina. Science. 1990;248:229–31. doi: 10.1126/science.2326637. [DOI] [PubMed] [Google Scholar]
- 33.Gilbert CD, Wiesel TN. Receptive field dynamics in adult primary visual cortex. Nature. 1992;356:150–2. doi: 10.1038/356150a0. [DOI] [PubMed] [Google Scholar]
- 34.Fiorani M, Rosa MGP, Gattass R, Rocha-Miranda CE. Dynamic surrounds of receptive fields in primate striate cortex: A physiological basis for perceptual completion? Proc Natl Acad Sci U S A. 1992;89:8547–8551. doi: 10.1073/pnas.89.18.8547. [DOI] [PMC free article] [PubMed] [Google Scholar]
- 35.Komatsu H, Kinoshita M, Murakami I. Neural responses in the retinotopic representation of the blind spot in the macaque V1 to stimuli for perceptual filling-in. J Neurosci. 2000;20:9310–9. doi: 10.1523/JNEUROSCI.20-24-09310.2000. [DOI] [PMC free article] [PubMed] [Google Scholar]
- 36.von der Heydt R, Peterhans E, Baumgartner G. Illusory contours and cortical neuron responses. Science. 1984;224:1260–2. doi: 10.1126/science.6539501. [DOI] [PubMed] [Google Scholar]
- 37.De Weerd P, Gattass R, Desimone R, Ungerleider LG. Responses of cells in monkey visual cortex during perceptual filling-in of an artificial scotoma. Nature. 1995;377:731–4. doi: 10.1038/377731a0. [DOI] [PubMed] [Google Scholar]
- 38.Sasaki Y, Watanabe T. The primary visual cortex fills in color. Proc Natl Acad Sci U S A. 2004;101:18251–6. doi: 10.1073/pnas.0406293102. [DOI] [PMC free article] [PubMed] [Google Scholar]
- 39.Stettler DD, Das A, Bennett J, Gilbert CD. Lateral connectivity and contextual interactions in macaque primary visual cortex. Neuron. 2002;36:739–50. doi: 10.1016/s0896-6273(02)01029-2. [DOI] [PubMed] [Google Scholar]
- 40.Shmuel A, et al. Retinotopic axis specificity and selective clustering of feedback projections from V2 to V1 in the owl monkey. J Neurosci. 2005;25:2117–31. doi: 10.1523/JNEUROSCI.4137-04.2005. [DOI] [PMC free article] [PubMed] [Google Scholar]
- 41.Angelucci A, et al. Circuits for local and global signal integration in primary visual cortex. J Neurosci. 2002;22:8633–46. doi: 10.1523/JNEUROSCI.22-19-08633.2002. [DOI] [PMC free article] [PubMed] [Google Scholar]
- 42.Blake R, Logothetis NK. Visual competition. Nat Rev Neurosci. 2002;3:13–21. doi: 10.1038/nrn701. [DOI] [PubMed] [Google Scholar]
- 43.Gyoba J. Disappearance of Stationary Visual Phantoms under High Luminant or Equiluminant Inducing Gratings. Vision Research. 1994;34:1001–1005. doi: 10.1016/0042-6989(94)90004-3. [DOI] [PubMed] [Google Scholar]