Abstract
The transport of gases in porous materials is a crucial component of many important processes in science and technology. In the present work, we demonstrate how magnetic resonance microscopy with continuous flow laser-polarized noble gases makes it possible to “light up” and thereby visualize, with unprecedented sensitivity and resolution, the dynamics of gases in samples of silica aerogels and zeolite molecular sieve particles. The “polarization-weighted” images of gas transport in aerogel fragments are correlated to the diffusion coefficient of xenon obtained from NMR pulsed-field gradient experiments. The technique provides a unique means of studying the combined effects of flow and diffusion in systems with macroscopic dimensions and microscopic internal pore structure.
Flow and diffusion through porous media represent a vast field of study with many scientific and engineering applications, including catalysis, water purification, soil mechanics, and petroleum engineering (1, 2). A detailed understanding of the complexities of flow and diffusion in porous materials is essential for the design, development, and optimization of catalysis and adsorption. Often, the design of such processes must resort to trial and error, because experimental techniques such as particle image velocimetry and laser Doppler anemometry are limited when it comes to high-resolution studies of flow through opaque porous samples.
NMR spectroscopy and imaging are commonly used for noninvasive measurements of flow and diffusion of liquids and plastomers (3). Their application to gases, however, has been hampered by poor signal to noise ratio, a consequence of the low-density medium (4). In this contribution, we demonstrate a method for visualization of gas diffusion and flow effects in porous solids via NMR microscopy, in which the signal sensitivity is enhanced by optical pumping of noble gases, providing a 10,000- to 100,000-fold increase of spin polarization over the natural thermal Boltzmann distribution (5–8). Such gas phase imaging in combination with optical pumping has been gaining widespread interest in the context of medical research and clinical applications primarily for images of the respiratory system (9–11). Elegant work from the Duke University Medical Center (12, 13), for example, has shown striking images of laser-polarized 3He and 129Xe inside lungs with a variety of features, ranging from fully filled lungs to gas dynamics in pulmonary airways. The present visualization technique for porous media is based on the unique imaging contrast that laser-polarized gases provide under conditions of steady-state continuous flow. Because the imaging contrast derives from the transport of laser-polarized gases via flow and diffusion, direct “snapshots” of gas flow and diffusion in the porous samples can be obtained. Interaction of nonreactive xenon gas with the surface of a host material leads to a distortion of its large electron cloud reflected by the wide chemical shift range of around 300 ppm (14). Therefore, it is possible to image xenon gas selectively in different environments based on its chemical shift position. This highly useful feature is not available with other gases. Microporous and mesoporous materials such as zeolites (pore diameter < 10 Å) and aerogels (pore diameter < 500 Å) are used to illustrate the potential of the technique.
Materials and Methods
All experiments are performed at a magnetic field of 4.3 T; images are obtained with three-dimensional (3D) Fourier imaging techniques described in ref. 3, with maximum magnetic field gradients of 50 G/cm. The experimental continuous-flow optical pumping apparatus is described in ref. 18. The flow rate is kept constant during the experiment, resulting in a gas velocity of about 7 cm/s within the cylindrical sample container of 4-mm internal diameter. A zeolite sample (13X) containing eight spherical pellets is degassed for 10 h under vacuum at 550 K.
Results and Discussion
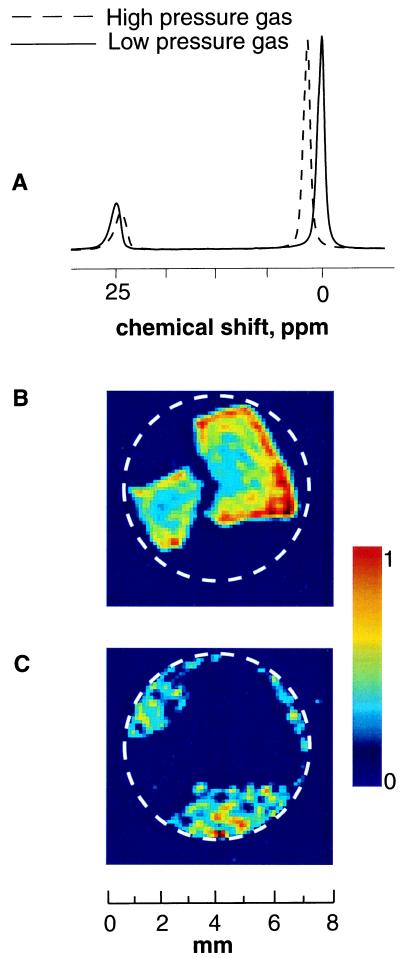
Aerogels are ultralight porous materials, typically based on silica, with densities ranging from 0.003 to 0.25 g/cm3 (15). The aerogel chemical composition, microstructure, and physical properties can be controlled at the nanometer scale, giving rise to unique optical, thermal, acoustic, mechanical, and electrical properties. NMR spectra of laser-polarized xenon gas flowing through fragments of silica aerogel at two different partial pressures are depicted in Fig. 1A. Xenon occluded within the aerogel gives rise to a signal with a chemical shift separated by about 25 ppm from that of pure (bulk) gas phase. The solid line corresponds to a gas pressure of 1 atm (0.5 atm of Xe and 0.5 atm of N2), and the dashed line corresponds to a gas pressure of 4 atm (3 atm of Xe and 1 atm of N2). Addition of nitrogen gas facilitates the optical pumping (5), although pure xenon gas can also be used with somewhat reduced signal intensity. The decrease in chemical shift with the higher pressure of gas occluded in aerogel fragments is in agreement with previous NMR data for xenon at thermal equilibrium (16).
Figure 1.
(A) NMR spectra of laser-polarized 129Xe flowing through aerogel fragments at two different pressures (T = 290 K). Xenon occluded in aerogel gives rise to a signal around 25 ppm, where the pure gas phase (bulk phase) at 1 atmosphere (atm; 1 atm = 101.3 kPa) has been used as a reference at 0 ppm. The solid line shows the spectrum recorded at 1 atm total pressure (0.5 atm of Xe and 0.5 atm of N2), and the dashed line shows the result at 4 atm (3 atm of Xe and 1 atm of N2). (B) “Polarization-weighted” images of laser-polarized xenon diffusing into aerogel fragments, based on chemical shift selection of the transition at 25 ppm (spectrum in A, solid line). The 2D magnetic resonance image slices (perpendicular to the flow) from the full 3D data set, with a resolution of 250 × 250 × 100 μm, are recorded at T = 290 K by using lower pressure gas mixture with a pulse time delay of 0.4 s. The white circle designates the wall of the sample container. (C) Polarization-weighted images of bulk laser-polarized xenon gas outside the aerogel fragments, based on chemical shift selection of the transition at 0 ppm (see Fig. 1A, solid line). The image is a 2D slice from the full 3D data set with a resolution of 250 × 250 × 100 μm, taken perpendicular to the flow with a pulse time delay of 0.4 s.
To produce “chemical shift selective” images, low power Gaussian-shaped 90° rf pulses are used (pulse width = 400 μs). Thus, images of xenon diffusing through aerogel fragments (Fig. 1B) can be separated from those of the bulk phase xenon gas (Fig. 1C). The gas diffusion around and into the material can be visualized by spin density images encoded with varying time delays between excitation pulses. NMR experiments normally involve a time delay between scans during which the longitudinal magnetization is restored to thermal equilibrium by spin-lattice relaxation. In the present methodology, which uses “externally prepared” magnetization, the 90° rf excitation pulse essentially destroys the magnetization created by optical pumping, and the system thus relaxes back to thermal equilibrium, yielding negligible imaging contrast for the gas phase. In this mode of imaging, therefore, the spin-lattice relaxation is effectively replaced by the transport of fresh laser-polarized 129Xe via flow and diffusion.
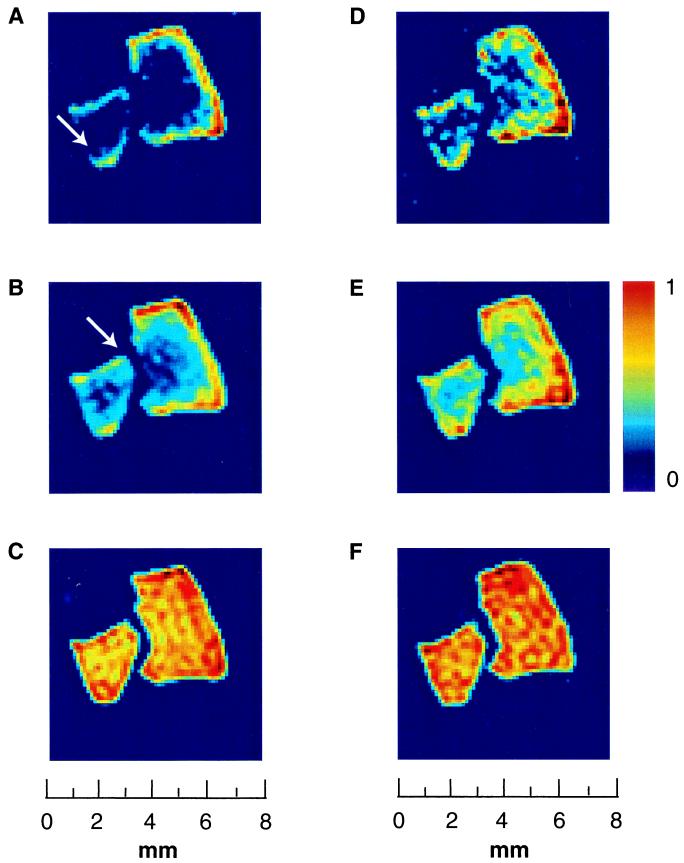
Fig. 2 shows the penetration of xenon into aerogel fragments as a function of the “transport time” (the time delay between excitation pulses) and the total gas pressure. NMR images of a higher pressure gas mixture (total pressure = 4 atm) penetrating aerogel fragments via diffusion are shown in Fig. 2 A–C, and a lower pressure gas mixture (total pressure = 1 atm) is shown in Fig. 2 D–F. For short time delays between the pulses, the images show xenon signal at the outer regions of the aerogel fragments (Fig. 2 A and D). The extent of xenon penetration into the material depends on the diffusion coefficient and can be estimated by the mean displacement R̄ = √2Dt, where D is the diffusion constant and t is the time duration of the diffusion. The diffusion coefficient of xenon inside the aerogel fragments depends on the overall gas pressure; thus, it is possible to visualize different degrees of gas penetration into the material in a given time period by comparing experiments at different gas pressures. Diffusion coefficients of xenon gas at two pressures inside the aerogel fragments, Daero, and in the bulk gas phase, Dbulk, are determined by pulsed-field gradient NMR experiments. For a lower pressure mixture (0.5 atm of Xe and 0.5 atm of N2) we find Daero = 0.65 mm2/s, whereas the high pressure mixture (3 atm of Xe and 1 atm of N2) yields Daero = 0.35 mm2/s. Bulk phase xenon diffusion coefficients, Dbulk , for low and high pressure mixtures are determined to be 5.5 mm2/s and 2.6 mm2/s, respectively. The different degrees of gas penetration (e.g., Fig. 2, compare B and E) can be observed only for short time delays. For longer times, the material becomes saturated with polarized gas as seen in the images of Fig. 2 C and F.
Figure 2.
Penetration of laser-polarized xenon into silica aerogel fragments at two different pressures as a function of time delay between excitation pulses. Shown are 2D magnetic resonance image slices perpendicular to the flow from a 3D data set, with a slice thickness of 100 μm and an in-plane resolution of 250 × 250 μm. (A–C) Magnetic resonance images of xenon adsorbed in aerogel fragments at high pressure (3 atm of Xe and 1 atm of N2; spectrum shown in Fig. 1A, dashed line around 25 ppm). The diffusion coefficient of xenon at T = 290 K under these conditions is Daero = 0.35 mm2/s. The pulse delay times are 0.2 s (A), 0.4 s (B), and 2 s (C). (D–F) Magnetic resonance images of xenon adsorbed in aerogel fragments at lower pressure (0.5 atm of Xe and 0.5 atm of N2; spectrum shown in Fig. 1A, solid line at 25 ppm). The diffusion coefficient of xenon at T = 290 K under these conditions is Daero = 0.65 mm2/s. The pulse delay times are 0.2 s (D), 0.4 s (E), and 2 s (F). The asymmetrical distribution of xenon spin density inside the aerogel fragments, for the shorter time delays, reflects the close proximity of fragments to each other and to the walls of the container, which attenuates the efficient accessibility of polarized gas to the fragments (white arrow).
An interesting feature of the xenon images is the asymmetrical distribution of xenon spin density in the aerogel fragments at short time delays (indicated by the white arrows in Fig. 2 A and B), a consequence of the differential flow and accessibility of gas to the fragments. Fig. 1C shows that, for some regions, the gas flow is obstructed, and therefore at short time delays, the delivery of freshly polarized xenon is limited. Such circumstances arise, for example, for fragments close to the glass walls of the sample container and for areas of close contact between fragments.
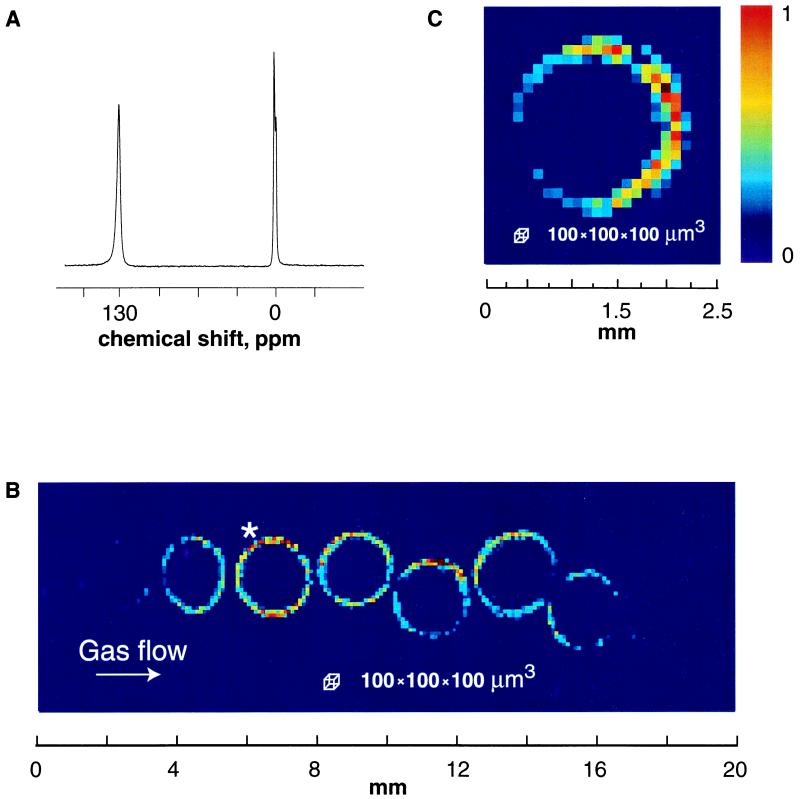
As shown in Fig. 3, particle contact and restricted gas flow also affect the images of gas penetration into zeolite particles. The technique thus presents a useful means of mapping out the dynamics of gases flowing over a bed with porous fragments, a common situation in industrial processes that use heterogeneous catalysts. The xenon atom has a diameter of about 4.4 Å, making it an appropriate probe of 13X zeolites with estimated pore size of about 7–8 Å (17). The NMR spectrum of laser-polarized xenon flowing through 13X zeolite particles of diameter ≅ 2 mm shows two signals: one from bulk phase 129Xe (reference peak) and a second one at 130 ppm arising from xenon occluded within the zeolite. A 2D magnetic resonance image slice of the occluded xenon, taken from the full 3D data set, in a plane parallel to the flow is shown in Fig. 3B, whereas Fig. 3C depicts a slice through one particle, perpendicular to the flow. The most apparent feature of Fig. 3 B and C is the high intensity in the outer area of the particles with signal rapidly decaying toward the center. The penetration of xenon into the material is indeed dominated by diffusion, but spin-lattice relaxation reduces the signal before the particles can become saturated with polarized gas†, in contrast to the situation for the aerogel fragments. Polarization-weighted xenon NMR imaging with variable time delays can be used to map out gas phase dynamics between particles with a resolution of 100 × 100 × 100 μm3, a compelling advance in gas phase imaging.‡
Figure 3.
(A) NMR spectrum of laser-polarized xenon flowing through spherical particles of 13× zeolites (T = 290 K). Xenon occluded within the zeolite gives rise to a signal at 130 ppm, referenced to bulk phase xenon gas at 0 ppm (1 atm of Xe and 1 atm of N2). (B) Magnetic resonance 2D image: longitudinal slice (along the direction of flow) from a full 3D data set for xenon occluded in zeolite particles. The 3D data with a resolution of 100 μm in all three dimensions (64 × 64 × 256 points) are Fourier-transformed with no zero-filling or smoothing filters. Spin-lattice relaxation reduces the polarization of xenon before the pellet is saturated completely with laser-polarized 129Xe. The asymmetric intensity of spin density in the pellets reflects close contact of neighboring particles, which interferes with the efficient flow and accessibility of polarized gas to the particles. (C) Magnetic resonance 2D image: transverse slice (perpendicular to the direction of flow) from a full 3D data set as described for B. The asterisk in B indicates which particle is depicted in the slice. The low signal intensity on the left-hand side of the particle is caused by its close proximity to the glass walls of the container, which interferes with the flow accessibility of polarized gas.
The method described in this contribution uses a unique imaging contrast modality, based on the transport of laser-polarized gases via flow and diffusion, providing snapshots of the gas dynamics, thereby allowing the visualization and investigation of transport phenomena in porous materials. By using the continuous-flow apparatus (18), polarization-weighted images can also be used as complementary data to the quantitatively direct, albeit time-consuming, NMR measurements of flow profiles and diffusion coefficients.
Acknowledgments
The authors thank Tom Lawhead for his expert preparation of glass sample containers and Arlon Hunt for providing aerogel samples. This work was supported by the Director, Office of Energy Research, Office of Basic Energy Sciences, Materials Sciences Division of the U.S. Department of Energy under contract no. DE-AC03-76SF00098. T.M. thanks the Alexander von Humboldt Foundation for a Feodor Lynen Fellowship.
Abbreviations
- 2D and 3D
two- and three-dimensional
- atm
atmosphere
Footnotes
Article published online before print: Proc. Natl. Acad. Sci. USA, 10.1073/pnas.050012497.
Article and publication date are at www.pnas.org/cgi/doi/10.1073/pnas.050012497
This method is not readily applicable to systems for which spin-lattice relaxation times are shorter than the duration of the dynamic processes under investigation. As a result, application of this technique to materials containing substantial concentration of paramagnetic centers is less feasible.
For xenon adsorbed in zeolites, the limit on resolution imposed by diffusion is estimated to be ≈55 μm, and the susceptibility limit is estimated to be ≈30 μm by using formulae from ref. 3.
References
- 1.Bear J. Dynamics of Fluids in Porous Media. New York: Dover; 1990. [Google Scholar]
- 2.Granick S. Science. 1991;253:1374–1379. doi: 10.1126/science.253.5026.1374. [DOI] [PubMed] [Google Scholar]
- 3.Callaghan P T. Principles of Nuclear Magnetic Resonance Microscopy. New York: Oxford Univ. Press; 1991. [Google Scholar]
- 4.Prado P J, Balcom B J, Mastikhin I V, Cross A R, Armstrong R L, Logan A. J Magn Reson. 1999;137:324–332. doi: 10.1006/jmre.1998.1674. [DOI] [PubMed] [Google Scholar]
- 5.Happer W, Miron E, Schaefer S, Schreiber D, van Wijngaarden W A, Zeng X. Phys Rev A At Mol Opt Phys. 1984;29:3092–3111. [Google Scholar]
- 6.Navon G, Song Y-Q, Rõõm T, Appelt S, Taylor R E, Pines A. Science. 1996;271:1848–1851. [Google Scholar]
- 7.Raftery D, Long H, Meersmann T, Grandinetti P J, Reven L, Pines A. Phys Rev Lett. 1991;66:584–587. doi: 10.1103/PhysRevLett.66.584. [DOI] [PubMed] [Google Scholar]
- 8.Driehuys B, Cates G D, Miron E, Sauer K, Walter D K, Happer W. Appl Phys Lett. 1996;69:1668. (lett.). [Google Scholar]
- 9.Albert M S, Cates G D, Driehuys B, Happer W, Saam B, Springer C S, Jr, Wishnia A. Nature (London) 1994;370:199–201. doi: 10.1038/370199a0. [DOI] [PubMed] [Google Scholar]
- 10.Wagshul M E, Button T M, Li H F, Liang Z, Springer C S, Jr, Zhong K, Wishnia A. Magn Reson Med. 1996;36:183–191. doi: 10.1002/mrm.1910360203. [DOI] [PubMed] [Google Scholar]
- 11.Saam B, Yablonsky D A, Gierada D S, Conradi M S. Magn Reson Med. 1999;42:507–514. doi: 10.1002/(sici)1522-2594(199909)42:3<507::aid-mrm13>3.0.co;2-u. [DOI] [PubMed] [Google Scholar]
- 12.Chen X J, Chawla M S, Heldund L W, Möller H E, MacFall J R, Johnson G A. Magn Reson Med. 1998;39:79–84. doi: 10.1002/mrm.1910390113. [DOI] [PubMed] [Google Scholar]
- 13.Möller H E, Chen X J, Chawla M S, Cofer G P, Driehuys B, Hedlund L W, Suddarth L E, Johnson G A. Magn Reson Med. 1999;41:800–808. doi: 10.1002/(sici)1522-2594(199904)41:4<800::aid-mrm20>3.0.co;2-k. [DOI] [PubMed] [Google Scholar]
- 14.Barrie P J, Klinowski J. Prog Nucl Magn Reson Spectrosc. 1992;24:91–108. [Google Scholar]
- 15.Zeng S Q, Hunt A, Greif R. J Non-Cryst Solids. 1995;186:264. [Google Scholar]
- 16.Gregory D M, Gerald R E, II, Botto R E. J Magn Reson. 1998;131:327–335. doi: 10.1006/jmre.1998.1358. [DOI] [PubMed] [Google Scholar]
- 17.Kärger J, Ruthven D. Diffusion in Zeolites and Other Microporous Solids. New York: Wiley; 1992. [Google Scholar]
- 18.Brunner E, Haake M, Kaiser L, Reimer J, Pines A. J Magn Reson. 1999;138:155–159. doi: 10.1006/jmre.1998.1675. [DOI] [PubMed] [Google Scholar]


