Abstract
Animals congenic for the char2 host response locus to the murine malarial parasite Plasmodium chabaudi have been bred, and they demonstrated a phenotypic difference from the parental lines. These congenic lines have been crossed back to the parental line to generate recombinants across the congenic intervals. The recombinants were inbred, and the subcongenic intervals were fixed. These lines were then challenged with parasites and assessed as being either resistant or susceptible. From the analysis of many subcongenic lines, it has become obvious that there are at least two loci underlying the char2 locus and that both of these mediate resistance when the haplotype derives from the resistant C57BL/6 strain.
Malaria, caused by the Plasmodium chabaudi parasite, is a debilitating disease that is responsible for 300 to 500 million clinical cases and over 1 million deaths each year (http://www.who.int). Efforts to control malaria have faced immense difficulties caused by the emergence of multidrug resistance in the parasite and insecticide resistance in the Anopheles mosquito vector. Despite extensive research efforts, development of an effective malaria vaccine has so far been unsuccessful. In regions where the parasite is endemic, exposure to the parasite has led to the evolution in human populations of natural defense mechanisms that protect against the clinical effects of malaria infection. By examining these host defense mechanisms and the genetic factors that influence their functions, it may be possible to uncover novel targets for anti-malaria therapeutics.
In humans, genetic polymorphisms have been identified that influence the onset, severity, and outcome of malaria infection (2, 7). The vast majority of these genes are involved in erythroid and immune processes. Erythrocyte polymorphisms, such as sickle-cell anemia, glucose-6-phosphate-dehydrogenase deficiency, and band 3 ovalocytosis, have been postulated to inhibit parasite growth, reduce parasite invasion, and promote parasite clearance (1, 14, 16). Among the variants that affect the immune response are HLA class I and class II haplotypes (11) and levels of the inflammatory cytokine tumor necrosis factor α (12). In addition, linkage analyses have detected chromosomal regions that affect the course of disease (8, 15). These studies show that the genetic components contributing to host resistance are complex and affect multiple genes. In human studies, population heterogeneity, parasite polymorphisms, and environmental heterogeneity compound the difficulties involved with identifying host genetic polymorphisms that protect against disease. It is easier to dissect a complex trait, like malaria resistance, in experimental mouse models.
Inbred strains of mice differ in susceptibility to the murine malaria agent Plasmodium chabaudi (17). Resistance in strains such as C57BL/6 is associated with survival, reduced blood-stage parasitemia at the height of infection, and a vigorous inflammatory immune response. Susceptible strains include C3H/He, SJL, and A/J. Using linkage analyses of backcross and intercross mice from C57BL/6, C3H/He, SJL, and A/J lines, several quantitative trait loci (QTL) that confer resistance to P. chabaudi malaria have been identified (2, 4-6, 9, 10). A locus that regulated peak parasitemia and survival to infection was mapped to chromosome 8 (char2) (4, 5). Recently, the char2 locus was confirmed in a partial genome scan in an F11 advanced intercross line (AIL) derived from A/J and C57BL/6 parents (9). Interestingly, the traits used in the Foote et al. (4) and Fortin et al. (5) studies, peak parasitemia and survival, were not employed in this AIL analysis. Instead, linkage was found to the first principal component score, PR1, which reflected the overall average level of parasitemia for days 2 to 7 postinfection. This suggested that char2 acted earlier in infection than suggested by the previous QTL analyses.
Progeny testing of a panel of chromosome 8 congenic mice, generated from C57BL/6 and C3H/He lines, showed that char2 could independently influence the outcome of P. chabaudi adami DS infection (3). The C57BL/6.C3H/He(7)-char2 (Char2-7) congenic strain, with a C57BL/6 background genome and a C3H/He interval spanning most of chromosome 8, was significantly more susceptible to infection than C57BL/6 controls. Compared to the C57BL/6 parental mice, Char2-7 mice had an earlier peak of infection, significantly higher peak parasitemia levels, and higher mortality rates. In contrast, lines with smaller congenic intervals towards the proximal and central sections of the chromosome survived infection, were resistant to malaria, and did not replicate the Char2-7 susceptibility phenotype. This suggested that there were either several genes of small effect contributing to the char2 QTL or that there was a major resistance gene at the distal end of chromosome 8 (D8Mit166-D8Mit156) in a region that did not exhibit linkage in the original genome scan. Interestingly, Hernandez-Valladares et al. (9) performed analyses for multiple QTLs in the AIL population but failed to find linked loci on chromosome 8. This, however, does not invalidate the hypothesis that there are multiple genes on chromosome 8 influencing the outcome of P. chabaudi infection. The mapping study may only have detected a subset of these genes. Unless the parental lines carried functionally different alleles, linked loci would not have been detected in the linkage analyses. Furthermore, since each QTL analysis only uncovered linkages to a subset of resistance traits, there could be loci that were missed.
In order to refine the map position of the char2 locus and determine if there were multiple P. chabaudi resistance genes on chromosome 8, we derived a series of recombinant lines from the Char2-7 congenic strain. Progeny testing confirmed that there were two or more genes at the char2 locus influencing the resistance trait. Two regions that were most likely to harbor these loci were identified and are targets for the generation of further recombinant congenic strains.
MATERIALS AND METHODS
Mice.
All mice were bred and maintained at The Walter and Eliza Hall Institute of Medical Research. A panel of 9 char2 congenic strains, with C57BL/6 background genomes, were generated by R. Burt from C3H/He and C57BL/6 inbred lines according to a previously described breeding and genotyping protocol (3). Recombinants within the C57BL/6.C3H/He(7)-char2 (Char2-7) congenic interval were created from (C57BL/6 × Char2-7) N2 progeny with the desired genotypes. C57BL/6.C3H/He(7a)-char2 (Char2-7a) and C57BL/6.C3H/He(11)-char2 (Char2-11) animals were intercrossed to create Char2-7a × Char2-11 congenic mice. Each line was intercrossed to generate homozygotes. Female mice at 7 to 10 weeks of age were used in infections. Age- and sex-matched C57BL/6 and C3H/He mice were used as controls. All experiments using mice were approved by The Royal Melbourne Hospital Research Foundation Animal Ethics Committee.
P. chabaudi infection.
An isolate of P. chabaudi adami DS was used in the infections and passaged through female C57BL/6 mice. Experimental mice were infected intravenously with 1 × 10⁴ or 2.5 × 10⁴ parasitized red blood cells (pRBCs). All mice were monitored for 20 days postinfection, and parasitemia levels were determined from Giemsa-stained thin blood smears as described previously (2).
Statistical analysis.
Log-rank analyses were used to test for differences between Kaplan-Meier cumulative survival curves for congenic and parental strains. Differences in parasite burdens over the course of infection between mouse strains were compared with a permutation test (http://bioinf.wehi.edu.au/software). Values of P < 0.05 were considered significant. Data are presented as the means ± standard errors of the means (SEM).
Normalization of mortality data and modeling.
In order to correct for the effect of changing parasite lethality, a method of normalizing the data using C57BL/6 and C3H/He as controls was developed. Since C57BL/6 is highly resistant to malaria, its mortality rate should be very low. Conversely, C3H/He is highly susceptible, and its mortality rate should be close to 100%. For each strain (i) in a batch (j), the mortality rate, pij, was adjusted (pij*) using pij* = (pij− pC57BL/6,j)/(pC3H/He,j − pC57BL/6,j). In the few cases where the proportion of congenics dying was lower than the proportion for C57BL/6 in that batch, the congenics rate was set to zero. Only female mice were included in the analysis.
A statistical model was developed to try to predict the location of the susceptibility locus or loci. The model for two loci is described here, but it generalizes to any number in a straightforward manner. We assume initially that the loci for malaria susceptibility are at marker positions m1 and m2. In each congenic strain, the marker alleles come from either C57BL/6 or C3H/He. If both alleles are from C57BL/6, then the proportion of mice dying, qi, will be low. If both are from C3H/He, then the proportion will be high. If one marker is from C3H/He and the other is from C57BL/6, then the proportion will be intermediate (in this case, there are two ways to select an allele from each strain, and these may be treated the same or independently). The likelihood of the data under the model is log L(data | m1, m2) ∝  , where summation is performed over all strains. The susceptibility loci, m1 and m2, may be found by calculating the likelihood for all possible loci pairs and selecting those that yield the maximum likelihood. This model has four parameters; however, this is reduced to three if we make the approximation that q(C57BL/6, C3H/He) = q(C3H/He, C57BL/6). The parameter values may either be assumed or estimated by maximum likelihood.
The model was first applied to the normalized mortality data, with fixed values for the model mortality rates, q(m1, m2), exploring a range of values. These parameters were also estimated using maximum likelihood. Simulations (results not shown) suggest that using fixed values is more robust to any inconsistencies remaining in the mortality data after normalization while still yielding the correct predicted loci.
RESULTS
Char2-7 recombinant congenic strains.
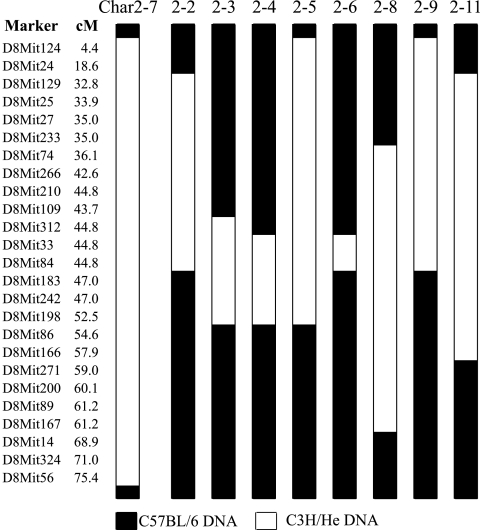
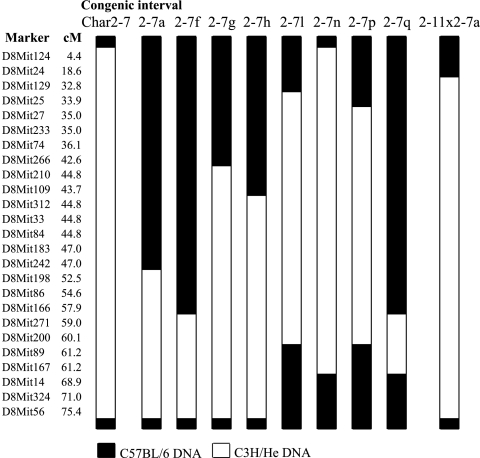
Progeny testing of the original panel of char2 congenic lines (Fig. 1) showed that only the Char2-7 strain, with a large portion of chromosome 8 inherited from the C3H/He strain, was significantly more susceptible to P. chabaudi malaria than the C57BL/6 parental mice. No other strain with smaller congenic intervals differed from the C57BL/6 controls. This result could derive from multiple determinants of resistance contributing to char2 or one major locus distal to the regions covered by the shorter congenic intervals. Therefore, nine Char2-7 recombinant congenic strains, targeting the distal end of chromosome 8, were generated (Fig. 2). Each recombinant strain was tested for susceptibility to malaria.
FIG. 1.
Genotype of the original panel of char2 congenic strains at a selection of microsatellite markers on chromosome 8. These lines have C57BL/6 background genomes and C3H/He congenic intervals. Map positions (in centimorgans [cM]) were obtained from the Massachusetts Institute of Technology database (http://www.broad.mit.edu/resources.html).
FIG. 2.
Genotype of the recombinant strains derived from the Char2-7 congenic line at a selection of microsatellite markers on chromosome 8. Map positions (in centimorgans [cM]) were obtained from the Massachusetts Institute of Technology database.
Multiple loci mediate resistance.
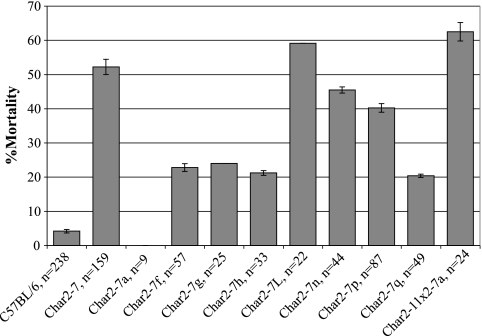
Animals from each recombinant congenic strain were challenged with P. chabaudi malaria to assess their response to infection. Char2-7a × Char2-11, Char2-7l, Char2-7n, and Char2-7p lines were highly susceptible to malaria, and in some challenges they appeared to replicate the Char2-7 phenotype (Fig. 3). Compared to C57BL/6 parental mice, these congenic strains experienced higher parasitemia levels and, with 40.2 to 62.5% of the mice dying, significantly higher mortality rates. The other recombinant strains showed, at best, only partial susceptibilities, with mortality rates below 24.0%. For strains with only subtle mortality phenotypes, this approached the limits of the study to differentiate between resistance and susceptibility. These phenotyping difficulties were compounded by intrastrain mortality rates that varied between experiments. Blood-stage parasite burdens were a more robust measure of resistance. Peak levels of parasitemia were highly correlated with susceptibility and appeared to be less prone to experimental variation. Despite the difficulties, these results confirmed that there were two or more loci influencing malaria resistance at the char2 QTL. The subtle susceptibility phenotype displayed by the Char2-7f recombinant confirms that a resistance locus resides within this congenic interval at the distal end of chromosome 8. Its failure to recapitulate the highly susceptible Char2-7 phenotype suggests that another locus lies proximal to the Char2-7f congenic interval. It was not possible to resolve whether the genes interacted additively or epistatically.
FIG. 3.
Mortality rates for Char2-7 recombinant congenic and C57BL/6 parental mice following infection with P. chabaudi pRBCs. Data are means ± SEM.
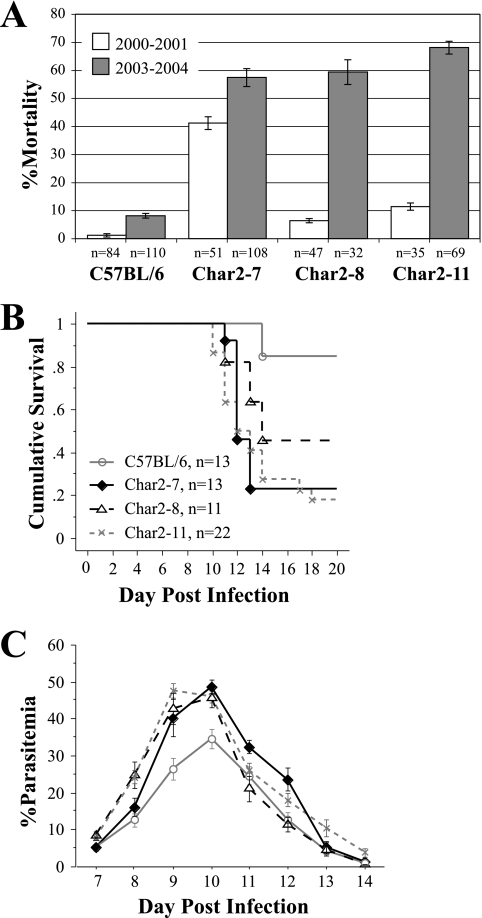
The parasite isolate steadily became more virulent as a result of serial passages through C57BL/6 mice. Over time, this led to minor increases in mortality rates that affected each mouse strain, including the parental mice. For the Char2-11 and Char2-8 congenic strains, however, the phenotypes altered dramatically over the four years that the malaria challenges were conducted. In 2001, these congenic mice had a level of resistance to P. chabaudi malaria similar to that of the C57BL/6 parental mice (3). Despite the lack of a significant difference, the congenic mice did have slightly higher mortality rates and parasitemia levels (see the supplemental material). From 2003, however, the Char2-11 and Char2-8 congenic animals were highly susceptible to malaria, and in female mice the recorded mortality rates were 68.1% and 59.4%, respectively. The congenic mice died at significantly higher rates than the C57BL/6 parental mice (8.2% mortality) and also had significantly higher parasitemia levels during infection (P < 0.05) (Fig. 4). Over time, the Char2-11 and Char2-8 mice became as susceptible as the Char2-7 congenic mice. The data for all experiments on all the congenic mice tested are presented in the supplemental material. These data were used for the statistical analysis.
FIG. 4.
Course and outcome of infection in Char2-7, Char2-8, and Char2-11 congenic mice and C57BL/6 controls. A. Mortality rates in the years 2000 to 2001 and 2003 to 2004. B. Kaplan-Meier cumulative survival curve from a 2003 to 2004 challenge. C. Average blood-stage parasitemia over the course of infection from a 2003 to 2004 challenge. Data are presented as means ± SEM.
Efforts to identify regions on chromosome 8 that harbored malaria susceptibility genes faced many obstacles. The variability inherent in the P. chabaudi infections led to difficulties in discriminating between subtle interstrain differences. It was difficult to compare results between experiments and impossible to obtain mice from all the congenic strains necessary for within-experiment comparisons. To overcome these variability problems, a statistical approach was employed.
Normalization and modeling.
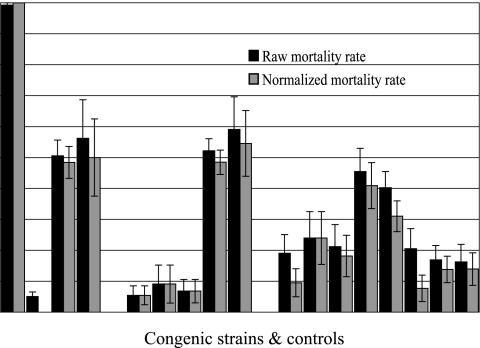
The raw and normalized mortality rates are shown in Fig. 5. Generally, the effect of normalization is quite small; however, the mortality rates of the Char2-7f, Char2-7p, and Char2-7q congenic mice are substantially reduced.
FIG. 5.
Effect of normalization on mortality rates for each congenic strain. Standard deviations are also shown.
Results of the single-locus model for a variety of parameter choices are given in Table 1. The loci giving the maximum likelihood of the data under a single-locus model fall in four regions or classes. Classes 1.1, 1.2, and 1.3 cluster together on one side of the region, while class 1.4 is on the other side. The fact that the predicted susceptibility locus jumps across the region for some choices of model parameter suggests that more than one locus may be involved. The model mortality rates estimated by maximum likelihood were q(C57BL/6) = 0.09 and q(C3H/He) = 0.4. The susceptibility locus in this case was near D8Mit27 or D8Mit233 (class 1.3).
TABLE 1.
Loci giving the maximum likelihood of the mortality data under a single-locus model for assumed mortality rates fall into four classes for the parameters exploreda
| Class | Marker | q(C57BL/6) and q(C3H/He) |
|---|---|---|
| 1.1 | D8Mit124-D8Mit24 | 0.01, 0.99 |
| 0.05, 0.99 | ||
| 0.1, 0.99 | ||
| 0.1, 0.9 | ||
| 1.2 | D8Mit25 | 0.01, 0.9 |
| 0.05, 0.9 | ||
| 0.05, 0.8 | ||
| 0.1, 0.8 | ||
| 0.1, 0.7 | ||
| 0.1, 0.65 | ||
| 1.3 | D8Mit27-D8Mit233 | 0.01, 0.8 |
| 0.01, 0.7 | ||
| 0.01, 0.65 | ||
| 0.05, 0.65 | ||
| 0.05, 0.5 | ||
| 0.1, 0.5 | ||
| 0.1, 0.4 | ||
| 0.2, 0.3 | ||
| 1.4 | D8Mit86-D8Mit166 | 0.01, 0.5 |
| 0.01, 0.4 | ||
| 0.01, 0.3 | ||
| 0.02, 0.3 | ||
| 0.05, 0.3 | ||
| 0.05, 0.4 | ||
| 0.1, 0.3 |
The maximum likelihood estimates of the model mortality rates for classes 1.1, 1.2, and 1.3 were 0.09 and 0.4 for q(C57BL/6) and q(C3H/He), respectively, where q is the variable applied by the model to give the mortality rate.
The results for a two-locus model are shown in Table 2. The loci giving maximum likelihood of the mortality data under a two-locus, three-parameter model fall into four regions or classes for the parameters explored. The maximum likelihood estimate of the model's mortality rates were q(C57BL/6, C57BL/6) = 0.05, q(C57BL/6, C3H/He) = q(C3H/He, C57BL/6) = 0.15, and q(C3H/He, C3H/He) = 0.48. The predicted loci in this case were near D8Mit27 or D8Mit233 as well as D8Mit86 or D8Mit166 (class 2.4).
TABLE 2.
Loci giving the maximum likelihood of the mortality data under a two-locus, three-parameter modela
| Class | Marker | q(C57BL/6, C57BL/6), q(C57BL/6, C3H/He), and q(C3H/He, C3H/He) |
|---|---|---|
| 2.1 | D8Mit27-D8Mit233 | 0.01, 0.5, 0.99 |
| D8Mit167-D8Mit56 | 0.01, 0.5, 0.9 | |
| 0.01, 0.5, 0.8 | ||
| 2.2 | D8Mit74-D8Mit348 | 0.01, 0.3, 0.99 |
| D8Mit167-D8Mit56 | 0.01, 0.3, 0.9 | |
| 0.01, 0.3, 0.8 | ||
| 0.01, 0.3, 0.7 | ||
| 2.3 | D8Mit25 | 0.01, 0.3, 0.6 |
| D8Mit86-D8Mit166 | 0.01, 0.2, 0.5 | |
| 0.01, 0.3, 0.5 | ||
| 0.05, 0.3, 0.5 | ||
| 0.05, 0.2, 0.5 | ||
| 0.1, 0.3, 0.5 | ||
| 2.4 | D8Mit27-D8Mit233 | |
| D8Mit86-D8Mit166 |
Assuming q(C57BL/6, C3H/He) = q(C57BL/6, C3H/He), where q is the variable applied by the model to give the mortality rate, falls into four classes for the parameters explored. The maximum likelihood estimate of the model mortality rates were 0.05, 0.15, and 0.48 for q(C57BL/6, C57BL/6), q(C57BL/6, C3H/He), and q(C3H/He, C3H/He), respectively.
Models were compared using the Akaike information criterion (AIC), which was calculated up to an additive constant. The AIC of the two-locus model with maximum likelihood estimates of the mortality rates was 858.3, while for the single-locus model the AIC was 894.3. A four-parameter two-locus and a three-locus model were also investigated. These offered no improvement over the three-parameter, two-locus model, as measured by the AIC. This supports the idea that there are only two susceptibility loci present in the Char2 region.
Because of the uncertainties introduced by the changes in parasite lethality, we adopt the approach of integrating the results across a spectrum of reasonable parameter choices. Two critical regions that had the highest likelihood of harboring the char2 resistance loci were identified at D8Mit27-D8Mit266 and D8Mit14-D8Mit56. A third region, D8Mit86-D8Mit166, also emerged for some model parameter values.
DISCUSSION
Genetic mapping studies have successfully identified loci that control blood-stage parasitemia and survival to P. chabaudi malaria in mice. The char2 locus on chromosome 8 was originally linked to peak levels of parasitemia and survival in crosses between resistant C57BL/6 and susceptible C3H/He and A/J mouse strains (4, 5). A panel of congenic strains, with C3H/He alleles on chromosome 8 transferred onto C57BL/6 backgrounds, was subsequently generated and tested for resistance to P. chabaudi infection (3). Only the strain with the largest congenic interval, Char2-7, was significantly more susceptible to malaria than the resistant C57BL/6 parental mice. This suggested that there were either multiple loci contributing to the char2 QTL or that there was a locus of large effect within the Char2-7 interval but outside the smaller congenic intervals. To fine map the char2 critical region(s), we derived and progeny tested a series of recombinant lines from the Char2-7 congenic strain. The char2 QTL displayed complex genetics, with two or more loci contributing to the Char2-7 susceptibility phenotype. Only the Char2-7a × Char2-11, Char2-7l, Char2-7n, and Char2-7p strains were highly susceptible to P. chabaudi malaria. The remaining recombinant lines were either resistant or only showed partial susceptibilities.
Susceptibility was associated with blood-stage parasitemia, with high peak parasitemia levels correlated with mortality. There appeared to be a threshold parasitemia level, beyond which death was the usual outcome. Although genetic determinants had a major influence on whether mice reached this parasitemia threshold, the high level of intrastrain variation between experiments suggested that minor changes in environmental or parasite factors could alter the outcome of infection.
The high level of phenotypic variation between experiments and the significant increase in susceptibility of the Char2-11 and Char2-8 congenic lines over time complicated efforts to finely map the char2 QTL. A statistical approach was necessary to adjust for the observed variation. Through data normalization and statistical modeling, two critical regions at the distal end (between D8Mit14 and D8Mit56) and central section (between D8Mit27 and D8Mit266) of chromosome 8, which were most likely to harbor malaria resistance loci, were identified. These have become target intervals for the generation of an additional series of recombinant congenic lines. These loci must interact to give a strong susceptibility phenotype; however, as a result of the variability encountered in the experiments, it is not clear if they have epistatic or additive effects. Interestingly, the original genome scan in a (C3H/He × C57BL/6)F2 population failed to detect multiple-resistance loci on chromosome 8. More than half the markers on chromosome 8, however, were significantly linked to resistance, so there was a possibility that several linked loci contributed to the char2 QTL. One of the limitations of the Mapmaker/QTL package (4) is that it only identifies loci that act independently. R/QTL, which can detect interacting loci, was used in a retrospective analysis of the linkage data but failed to detect additional loci and replicated the Mapmaker results (Russell Thomson, personal communication).
The individual effect of each of the char2 genes appears to be small, and given the variability of the survival phenotype, a massive effort will be required to progeny test recombinants for further fine-scale mapping. Based on mortality rates, the subtle susceptibility phenotypes were approaching the limits of differentiation. Blood-stage parasitemia was associated with resistance and was less vulnerable to experimental variability.
Conventional mapping strategies using congenic mouse strains confirmed that the char2 locus, detected in QTL mapping crosses, influenced the outcome of P. chabaudi infection. Fine-structure mapping, however, showed that multiple loci of small effect must combine to have an obvious effect on malaria resistance at the char2 QTL. This appears to be a common occurrence in mapping studies. Recently, a number of studies have found that loci identified in linkage analyses for traits such as susceptibility to obesity and epilepsy consist of several loci of small effect (13, 18). Given that polymorphisms in a large number of genes could potentially influence survival and the host response to malaria infection, the char2 results are not surprising. Epidemiological, linkage, association, and gene-targeting studies have already implicated a vast array of genes, involved in erythroid and immune processes, in malaria protection (2, 7). Genetic dissection of the underlying char2 genes will be challenging. Despite the difficulties in phenotyping subtle changes in susceptibility, the generation of further recombinant lines will be an important step towards the positional cloning of these genes. These congenic strains are also powerful tools for functional analyses, which will help identify candidate genes and pathways involved in malaria resistance.
Supplementary Material
Acknowledgments
This work was supported by grants from the National Institutes of Health, the Australian National Health and Medical Research Council, and the Howard Hughes Medical Institute.
Editor: J. F. Urban, Jr.
Footnotes
Supplemental material for this article may be found at http://iai.asm.org/.
REFERENCES
- 1.Allen, S. J., A. O'Donnell, N. D. Alexander, C. S. Mgone, T. E. Peto, J. B. Clegg, M. P. Alpers, and D. J. Weatherall. 1999. Prevention of cerebral malaria in children in Papua New Guinea by southeast Asian ovalocytosis band 3. Am. J. Trop. Med. Hyg. 60:1056-1060. [DOI] [PubMed] [Google Scholar]
- 2.Burt, R. A. 1999. Genetics of host response to malaria. Int. J. Parasitol. 29:973-979. [DOI] [PubMed] [Google Scholar]
- 3.Burt, R. A., V. M. Marshall, J. Wagglen, F. R. Rodda, D. Senyschen, T. M. Baldwin, L. A. Buckingham, and S. J. Foote. 2002. Mice that are congenic for the char2 locus are susceptible to malaria. Infect. Immun. 70:4750-4753. [DOI] [PMC free article] [PubMed] [Google Scholar]
- 4.Foote, S. J., R. A. Burt, T. M. Baldwin, A. Presente, A. W. Roberts, Y. L. Laural, A. M. Lew, and V. M. Marshall. 1997. Mouse loci for malaria-induced mortality and the control of parasitaemia. Nat. Genet. 17:380-381. [DOI] [PubMed] [Google Scholar]
- 5.Fortin, A., A. Belouchi, M. F. Tam, L. Cardon, E. Skamene, M. M. Stevenson, and P. Gros. 1997. Genetic control of blood parasitaemia in mouse malaria maps to chromosome 8. Nat. Genet. 17:382-383. [DOI] [PubMed] [Google Scholar]
- 6.Fortin, A., L. R. Cardon, M. Tam, E. Skamene, M. M. Stevenson, and P. Gros. 2001. Identification of a new malaria susceptibility locus (Char4) in recombinant congenic strains of mice. Proc. Natl. Acad. Sci. USA 98:10793-10798. [DOI] [PMC free article] [PubMed] [Google Scholar]
- 7.Fortin, A., M. M. Stevenson, and P. Gros. 2002. Susceptibility to malaria as a complex trait: big pressure from a tiny creature. Hum. Mol. Genet. 11:2469-2478. [DOI] [PubMed] [Google Scholar]
- 8.Garcia, A., S. Marquet, B. Bucheton, D. Hillaire, M. Cot, N. Fievet, A. J. Dessein, and L. Abel. 1998. Linkage analysis of blood Plasmodium falciparum levels: interest of the 5q31-q33 chromosome region. Am. J. Trop. Med. Hyg. 58:705-709. [DOI] [PubMed] [Google Scholar]
- 9.Hernandez-Valladares, M., J. Naessens, J. P. Gibson, A. J. Musoke, S. Nagda, P. Rihet, O. K. Ole-MoiYoi, and F. A. Iraqi. 2004. Confirmation and dissection of QTL controlling resistance to malaria in mice. Mamm. Genome 15:390-398. [DOI] [PubMed] [Google Scholar]
- 10.Hernandez-Valladares, M., P. Rihet, O. K. Ole-MoiYoi, and F. A. Iraqi. 2004. Mapping of a new quantitative trait locus for resistance to malaria in mice by a comparative mapping approach with human chromosome 5q31-q33. Immunogenetics 56:115-117. [Epub ahead of print.] [DOI] [PubMed] [Google Scholar]
- 11.Hill, A. V., C. E. Allsopp, D. Kwiatkowski, N. M. Anstey, P. Twumasi, P. A. Rowe, S. Bennett, D. Brewster, A. J. McMichael, and B. M. Greenwood. 1991. Common west African HLA antigens are associated with protection from severe malaria. Nature 352:595-600. [DOI] [PubMed] [Google Scholar]
- 12.Kwiatkowski, D., A. V. Hill, I. Sambou, P. Twumasi, J. Castracane, K. R. Manogue, A. Cerami, D. R. Brewster, and B. M. Greenwood. 1990. TNF concentration in fatal cerebral, non-fatal cerebral, and uncomplicated Plasmodium falciparum malaria. Lancet 336:1201-1204. [DOI] [PubMed] [Google Scholar]
- 13.Legare, M. E., F. S. Bartlett, Jr., and W. N. Frankel. 2000. A major effect QTL determined by multiple genes in epileptic EL mice. Genome Res. 10:42-48. [PMC free article] [PubMed] [Google Scholar]
- 14.Pasvol, G., D. J. Weatherall, and R. J. Wilson. 1978. Cellular mechanism for the protective effect of haemoglobin S against P. falciparum malaria. Nature 274:701-703. [DOI] [PubMed] [Google Scholar]
- 15.Rihet, P., Y. Traore, L. Abel, C. Aucan, T. Traore-Leroux, and F. Fumoux. 1998. Malaria in humans: Plasmodium falciparum blood infection levels are linked to chromosome 5q31-q33. Am. J. Hum. Genet. 63:498-505. [DOI] [PMC free article] [PubMed] [Google Scholar]
- 16.Ruwende, C., S. C. Khoo, R. W. Snow, S. N. Yates, D. Kwiatkowski, S. Gupta, P. Warn, C. E. Allsopp, S. C. Gilbert, N. Peschu, C. I. Newbold, B. M. Greenwood, K. Marsh, and A. V. S. Hil. 1995. Natural selection of hemi- and heterozygotes for G6PD deficiency in Africa by resistance to severe malaria. Nature 376:246-249. [DOI] [PubMed] [Google Scholar]
- 17.Stevenson, M. M., J. J. Lyanga, and E. Skamene. 1982. Murine malaria: genetic control of resistance to Plasmodium chabaudi. Infect. Immun. 38:80-88. [DOI] [PMC free article] [PubMed] [Google Scholar]
- 18.Stylianou, I. M., J. K. Christians, P. D. Keightley, L. Bunger, M. Clinton, G. Bulfield, and S. Horvat. 2004. Genetic complexity of an obesity QTL (Fob3) revealed by detailed genetic mapping. Mamm. Genome 15:472-481. [DOI] [PubMed] [Google Scholar]
Associated Data
This section collects any data citations, data availability statements, or supplementary materials included in this article.


