Abstract
Two Web-based breastfeeding programs were developed to provide new parents with necessary information on proper breastfeeding techniques. One version was plain text and the other version combined text with graphics. The computer was viewed as a valuable learning tool. The breastfeeding program that contained graphics was preferred over the text-only program. Educators are encouraged to use Web-based graphic programs to provide breastfeeding education to new parents.
Keywords: breastfeeding, computer patient education, computer graphics
Introduction
Several research articles describe the benefits of Web-based health education. For example, Web-based education has generally been shown to have the potential to promote positive health behaviors, support speedy return to function, and enable patients to be involved in decisions regarding their own care (Eng et al., 1998; Joint Commission on Accreditation of Healthcare Organizations, 1999; Matarrese & Helwig, 2000; Office of Patient Education, 1997; Office of Patient Education, 2000). The purpose of our study was to create a computer program for breastfeeding education and to determine the contribution, if any, of graphics to understanding the content and user satisfaction. Our study used computer technologies to develop two Web-based breastfeeding programs to provide breastfeeding information and techniques to parents. There were two different versions: text only and text with graphics.
This study addressed two research questions:
What are expectant parents' perceptions of two breastfeeding educational programs, one with and one without graphics?
Do expectant parents prefer the computer program with graphics over the program without graphics? The specific hypothesis for statistical testing of this question was: H0 (Null hypothesis) = There will be no statistically significant differences in preference between the education program that has graphics and the one that does not.
Additionally, statistical testing was conducted to determine if the order in which the participant views each program has an effect on program rating.
Review of Literature
Breastfeeding
The Office of Disease Prevention and Health Promotion, U.S. Department of Health and Human Services (2000) launched the Healthy People 2010 national goals. The goals include the following: At least 75% of mothers will breastfeed during the early postpartum period, at least 50% of that proportion will continue breastfeeding until their babies are 5–6 months old, and 25% of those mothers will continue to breastfeed until their babies are 1 year old. However, the current percentage of women in the United States who sustain breastfeeding still remains below the goals. In 1998, just 28.6% of mothers continued breastfeeding after six months and only 16.3% continued to breastfeed for one year (Neifert, 1999). Research by Hoyer and Pokorn (1998) has shown that mothers who breastfeed for a longer duration are those who are better informed regarding breastfeeding and those who decide before the birth to breastfeed. Thus, educational technologies may offer an educational strategy to help mothers gain supportive breastfeeding information and learn techniques important to promoting a longer duration of breastfeeding.
Recommendations for breastfeeding.
Breastfeeding has many well-documented benefits for infants, mothers, families, and the society. The American Academy of Family Physicians strongly recommends breastfeeding for at least six months (Moreland & Coombs, 2000). The American Academy of Pediatrics (AAP, 1997) has recommended exclusive breastfeeding during the first six months of life and a continuation for the second six months as optimum for nutrition in infancy. The World Health Organization recommendations are even stronger in that they recommend breastfeeding beyond 2 years of age for all infants (Baldwin, 2001).
Breastfeeding decisions.
The mother's decision of whether or not to breastfeed is usually made early in the pregnancy or before (Knapp, 1999). Losch, Dungy, Russell, and Dusdieker (1995) reported that nearly half to more than three-fourths of women made initial feeding decisions before pregnancy. Because prenatal care providers can significantly influence a mother's decision to breastfeed, physicians have been urged to discuss breastfeeding with the parents at the first and subsequent prenatal visits (Moreland & Coombs, 2000). AAP (1999) also suggested that a discussion of feeding plans and a provision of current breastfeeding educational resources be made available to expectant parents prior to delivery. Through group meetings, the La Leche League provides education to the breastfeeding mother during the last 13 weeks of her pregnancy. However, studies recommend ensuring that all pregnant women receive adequate information from early pregnancy throughout the prenatal period to make a fully informed decision about infant feeding. Thus, strategies to make breastfeeding education widely available become important.
Breastfeeding education subjects.
Provision of breastfeeding information should not be limited to the pregnant mothers; rather, information should be given to all individuals who will influence the decision-making process. Studies have shown that the father of the infant is one of the key persons (Freed & Fraley, 1993; Jones, 1987; Losch et al., 1995; Neifert, 1999). Breastfeeding support has been shown to be primarily from family networks, with health care providers in a secondary role (Marchand & Morrow, 1994).
Web-Based Health Education
As health information of all kinds becomes increasingly accessible over the Internet and as patient interest in self-care increases, patients seek and expect to receive more information about their health and explicit instructions about the next steps in their care. About one-third of the existing sites on the Internet are devoted to health care (Sandrich, 2000). Linderg and Humphreys (1998) found about 37% of consumers searching the Internet are seeking health information. Learning can be optimized using online sources because the Web offers privacy and flexibility for consumers in meeting their educational needs. Many research studies have compared the effectiveness of Web-based programs and the traditional education manual. Such research has shown that, in general, patients enjoy interacting with computers and have better recall with Web-based learning than with traditional methods (Kahn, 1993).
One guideline for effective Web-based health information is that material should be presented appropriately for the assessed reading level (Jimison & Sher, 1999). The average adult reading level in the United States is at the eighth- to ninth-grade level. Designing screens for one to three grade levels lower than the average adult reading level is recommended (Jimison & Sher, 1999; Office of Patient Education, 1997). However, regardless of skill level, most adults prefer easy-to-read material.
Benefits.
The advantages of Web-based patient education programs are variable. No doubt, Web-based education programs can provide individualized instruction, allowing users to progress at their own pace. Information from the Web can be printed and given to patients to review at home, overcoming the barrier of travel distance and travel time. Moreover, online health information is efficient to store and update. Web-based patient education programs are described as useful and accurate (Porcelli & Lobach, 1999).
Studies show that Internet patient education systems can improve patient satisfaction and affect self-help behaviors. A study by Matarrese and Helwig (2000) showed 80% of participants stated that, compared to other strategies, the Web-based health information improved their satisfaction as a learner. Research by Leaffer and Gonda (2000) showed that more than half of senior patients were more satisfied with their treatment after they performed a Web search and engaged in a subsequent discussion with their physicians about the information they found on the Internet. Jimison and Sher (1999) state, “Access to health information can enable patients to be more active participants in the treatment process, leading to better medical outcomes” (p. 139).
Studies show that Internet patient education systems can improve patient satisfaction and affect self-help behaviors.
Computer graphics.
Designing Web-based instruction can be simple or complex, depending on the level of multimedia strategies used. Multimedia includes text, static graphics, animations, audiotapes, Compact Discs (CD-ROM), and even Digital Videodiscs (DVD). The more complex the use of multimedia, the more expensive the task. Thus, it is important to document the benefit of adding multimedia strategies to a Web page. Designing online documents employing computer tools requires consideration of priorities and imposes limitations. The advantages of user-friendly computer programs are outlined in the Handbook of Informatics for Nurses and Health Care Professionals (Hebda, Czar, & Mascara, 1998).
The more complex the use of multimedia, the more expensive the task. Thus, it is important to document the benefit of adding multimedia strategies to a Web page.
Research results provide suggestions regarding the screen design for graphics. A national report in Taiwan (Lin-Toung Technology College, 1998) stated that a more simple strategy of static graphics with text or the strategy of animation with full audio can help students understand abstract concepts better than any of the following: static graphics with full audio, animation with text, or animation with cued audio group. Thus, all design strategies are not equal. In addition, a study by Funnell, Donnelly, and Anderson (1992) showed that visual media using simple graphics and line drawings are particularly effective for educating patients and are more acceptable than text accompanied by audio. Nielsen (1996) strongly recommended never including page elements that move incessantly; rather, allow users some peace and quiet to actually read the contents.
According to Brasseur (1999), visualization is one tool that individuals can use to effectively represent abstract information. Montoya (1998) concurs, suggesting that integrating images with text facilitates the learning process. Similarly, a research study by Staggers and Kobus (2000) showed that users had significantly faster response time, fewer errors, higher satisfaction, and a faster learning rate with graphics than with text.
Graphically arranged information can help students build better mental connections among concepts. Graphics also can help a reader tackle the daunting task of understanding an unstructured document. Because the unmotivated patient is one of the major barriers to achieving high-quality patient education (Funnell et al., 1992), printouts with graphics may make comprehension easier and may be a way to overcome this barrier.
Methods
Design
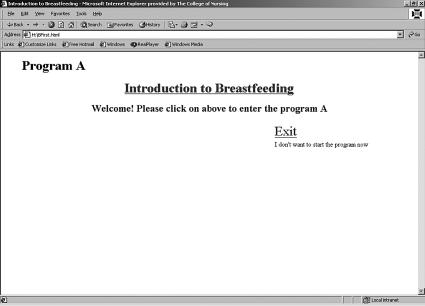
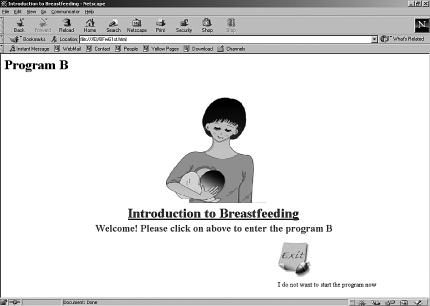
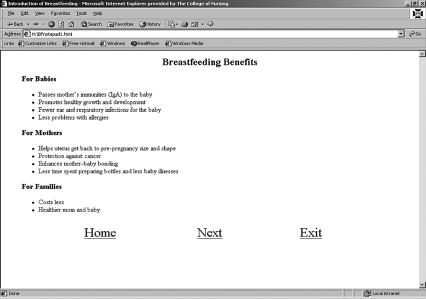
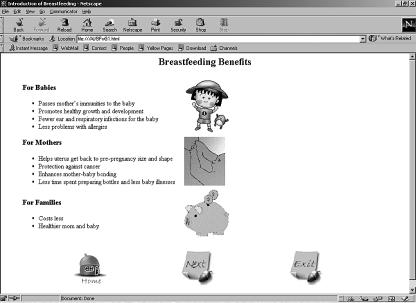
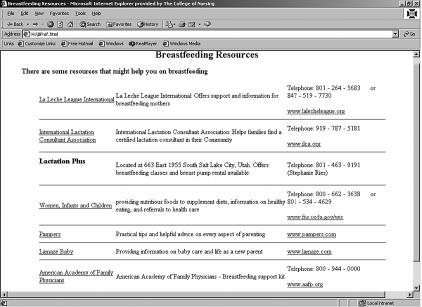
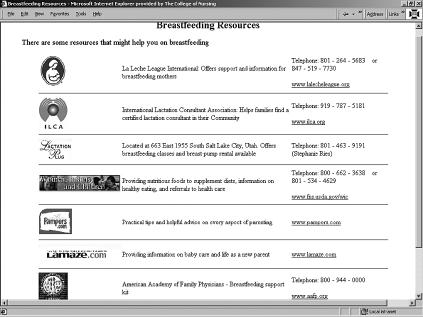
In order to investigate an effective strategy for breastfeeding specifically, a Web-based breastfeeding program was developed with two different versions. One version was text only and the second version added simple graphics (see examples in Appendix A). The breastfeeding information included in the two Web programs was based on handouts from the University of Utah Hospital. These handouts include breastfeeding benefits, breastfeeding steps, and methods for increasing and keeping milk supply. The original breastfeeding handouts were a plain text version with a reading level of sixth grade or less. The Web program maintained the same reading level as the written handouts, as measured by the SMOG Readability Formula (McLaughlin, 1969).
Sample
Following human-subjects review and approval, the Perinatal Education Office in University of Utah Hospital helped to recruit subjects for this study from participants in classes held for expectant parents planning to deliver at the University of Utah Hospital. Because a woman's husband or partner is a key person for decision-making related to feeding method, both parents were eligible for inclusion in this study. All subjects had received a diploma at the six-grade level or above. Also, subjects stated that they felt comfortable with the reading level of a daily newspaper in English. The sample size was 20 participants. Every subject evaluated both versions of the program. Both Nielsen (1993) and Rubin (1994) suggest six to eight subjects as sufficient for identifying 80% of the design issues. This study had adequate statistical power.
Most subjects, 15 of 20, completed the program in the Clinical Informatics Computer Lab, located on the second floor of the University of Utah College of Nursing. Four subjects took a disk home and used their personal computer; one subject completed the study in the hospital lobby. Multiple settings fit the idea of a Web-based program, overcoming the barrier of inconvenience or distance.
Instruments
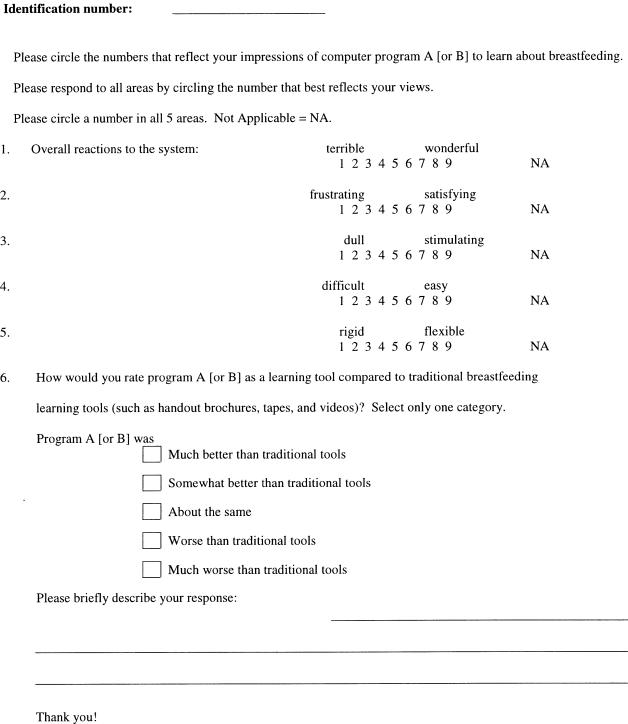
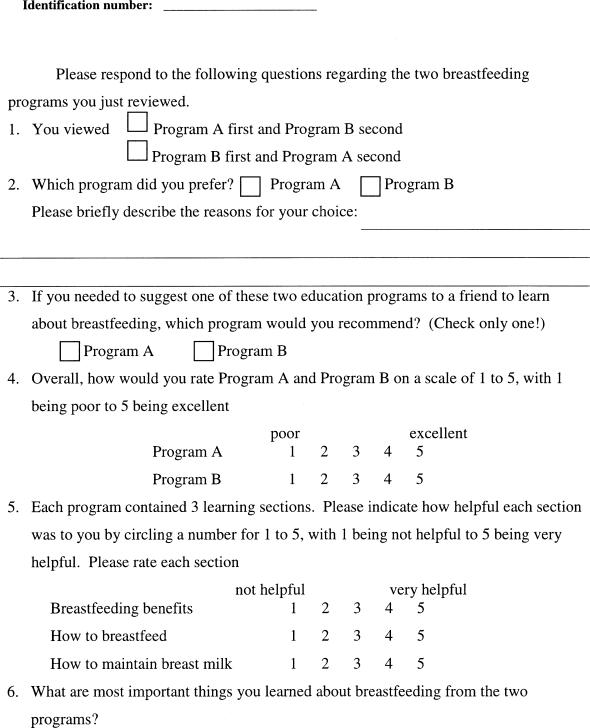
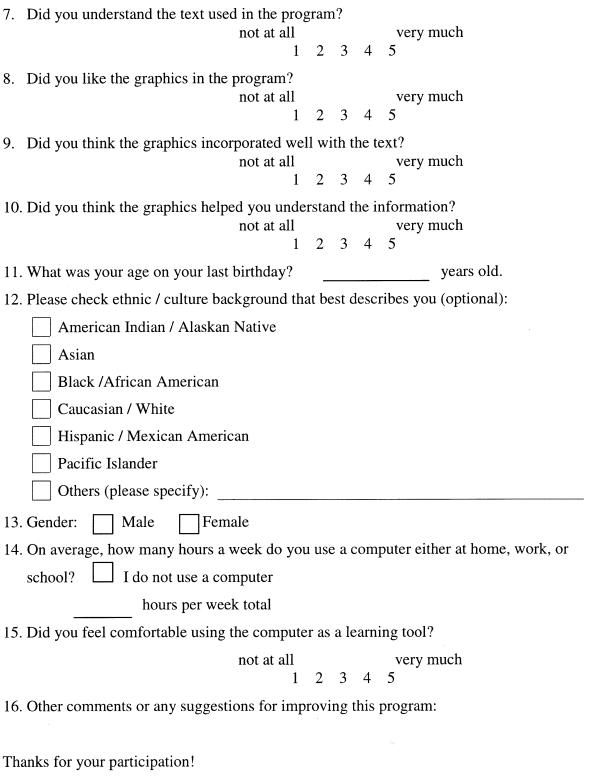
The study used the Overall User Reaction component of the Questionnaire for User Interaction Satisfaction (QUIS) version 7.0 to measure subject satisfaction with the educational program (Office of Technology Commercialization, 1990). This QUIS component was incorporated into the question concerning traditional tools (see Appendix B). Other questions that related to the subjects' perceptions of the programs were incorporated into the demographic questionnaire to create the Final Evaluation (see Appendix C). Check boxes, rating scales, and short answers were used for the questionnaire.
Data Collection Procedures
Each subject signed a written consent form indicating his or her agreement to participate in the study. The subjects were randomly assigned to complete the program of plain text or the text-with-graphics version first. Twenty envelopes were prepared with a number inside. Each subject drew an envelope before starting the computer program. Subjects who drew an odd number used the plain-text version first, followed by the text-with-graphics version. Subjects with even numbered identification began with the text-with-graphics version and used the plain-text version second.
The Web-based programs included instructions about breastfeeding. A written questionnaire contained the Overall User Reaction questionnaire and the Final Evaluation questionnaire. Based on the identification number drawn, the appropriate version of breastfeeding introductory information was shown to the subjects first. Next, the subjects were asked to answer the Overall User Reaction questionnaire regarding the version they viewed. Then, the other version of breastfeeding introductory information was presented to the users. After the users read through this version, they were asked to answer the Overall User Reaction questionnaire again. Finally, the users completed the Final Evaluation questionnaire regarding the subjects' background and personal preferences regarding the programs.
Data Analysis
Statistical Package for Social Science (SPSS) was used for performing statistical analysis of the results of the User Reaction Questionnaire and demographic questionnaire. The subjects were described using data from the demographic form. The mean scores of the user reaction questionnaires were used to evaluate user satisfaction with each of the Web-based programs. Subject responses were compared across versions of the program, plain text and text with graphics. Paired t-test and Repeated-Measures ANOVA were used to test the differences in ratings between the two programs and to investigate any effects of viewing order.
Results
Demographic data including age, hours of computer use, comfort levels with the computer, race, and gender were measured in this study. The average age of participants in this study was 31.5 years old (see Table 1). The youngest participant was 22 years old and the oldest was 49 years old. Additionally, the average of computer-using hours per subject per week was 17.375 hours. The minimum reported was 0 hours and the maximum was 50 hours. Some subjects did not have any experience using the computer and others listed themselves as experts in the computer field. Additionally, the subjects were asked if they felt comfortable using the computer as a learning tool. The average on the 5-point scale was 4.75. The range was from 3 to 5. Even though some subjects reported not customarily using a computer, almost everyone was comfortable with this computer usage.
Table 1.
Age, Computer-Using Hours, and Comfortable When Using Computer
| Item | N | Minimum | Maximum | Mean | Std. Deviation |
|---|---|---|---|---|---|
| Age | 20 | 22 | 49 | 31.50 | 7.480 |
| Computer-using hours per week | 20 | .0 | 50 | 17.375 | 18.0911 |
| Comfort level with the computer* | 20 | 3 | 5 | 4.75 | .550 |
Note: Comfort level with the computer is based on a 5-point scale with 1 being not at all comfortable and 5 being very comfortable.
The 20 subjects included four categories of race: one American Indian, one Black/African American, 17 Caucasian/White, and one Middle Eastern individual. In total, 85% of the subjects reported being Caucasian/White. Sixty percent of the sample were female and 40% male. This difference was expected, due to the topic being breastfeeding.
Overall Perceptions
To answer the first research question, descriptive statistics were used to determine parents' overall reaction to the two programs. Based on mean scores, Program B (the graphical version) was rated higher than Program A (the text-only version) for each of the five questions. The users' reaction regarding the computer program were potentially rated as terrible to wonderful,frustrating to satisfying,dull to stimulating,difficult to easy, and rigidity to flexibility.
A review of the participants' comments also showed a more positive reaction to Program B. Comments included, “The pages with graphics were better in that they were more informative” and “The graphics were more entertaining.” A content analysis of the added comments showed subjects much preferred the graphics program, and several noted their preference for video educational tools and links, even though this was not a choice in this study.
All of the subjects evaluated both programs, but in different order. Ten out of 20 subjects drew odd numbers and viewed Program A first; the other 10 subjects had even numbers and viewed Program B before Program A. Because the order could affect the subjects' evaluation regarding the two programs, a Repeated-Measures ANOVA was used to test the entire Overall User Reaction questionnaire and some parts of the Final Evaluation questionnaire. Paired t-test was used to compare the two programs.
The first question asked subjects to rate their overall reaction to the computer system on a scale of 1–9. For example, the first response was 1 (terrible) to 9 (wonderful). The results indicated that the order in which the programs were viewed did not have a significant effect in the rating scale (p = .333; see Table 2). Table 3 shows that the subjects were significantly more likely to rate Program B (with graphics) as more wonderful than Program A (without graphics): t = 4.125, df = 19, p = .001.
Table 2.
Repeated-Measures ANOVA on Question 1—Influence of Order
| Source | Type III Sum of Squares | df | Mean Square | F | Sig. |
|---|---|---|---|---|---|
| Time * ORDER | 1.225 | 1 | 1.225 | .991 | .333 |
Note: Dependent variable: Program B and Program A.
Table 3.
Paired T-test for Question 1
| Descriptor | Mean | Std. Deviation | Std. Error Mean | t | df | Sig. |
|---|---|---|---|---|---|---|
| Comparison to traditional tool | 1.45 | 1.572 | .352 | 4.125 | 19 | .001 |
Note: Descriptor comparisons Program B versus Program A. Statistically significant at α = .05.
The order in which the subjects viewed the program did not have a significant effect for any ratings on question numbers 2–5. Order was determined to be nonsignificant. Table 4 illustrates the results of the paired t-tests and levels of significance. In all cases, Program B was rated significantly better than Program A. Program B (with graphics) was viewed as significantly more satisfying, stimulating, easy, and flexible.
Table 4.
Paired T-test for Questions 2-5
| Descriptor | Mean | Std. Deviation | Std. Error Mean | t | df | Sig. (2-tailed) |
|---|---|---|---|---|---|---|
| Frustrating to satisfying | 1.60 | 1.729 | .387 | 4.138 | 19 | .001 |
| Dull to stimulating | 2.80 | 2.285 | .511 | 5.480 | 19 | .000 |
| Difficult to easy | .70 | 1.418 | .317 | 2.208 | 19 | .040 |
| Rigidity to flexibility | 1.75 | 1.997 | .446 | 3.920 | 19 | .001 |
Note: Descriptor comparisons Program B versus Program A. Statistically significant at α = .05.
Preferences
When asked to compare each program with traditional breastfeeding tools (such as handout brochures, tapes, and videos), subjects again preferred Program B (with graphics) to traditional tools. However, computer Program A (text only) was viewed as about the same as traditional learning tools.
However, the order in which the subject viewed the program affected the evaluation of whether or not the program was seen as better than the traditional learning tools. The subjects who viewed the text-only version first tended to give it a higher score than the people who viewed text with the graphics first. In contrast, when subjects viewed the program with graphics first, a higher standard appears to be set in their minds and both the other program (without graphics) and the traditional tools seemed inferior.
Subjects were asked how helpful each of the three sections was to them. The most important items were (in order) the techniques of breastfeeding, benefits, maintaining milk supply, and care of sore nipples (see Tables 5 and 6).
Table 5.
Helpful Section for Participants
| Section | N | Minimum | Maximum | Mean | Std. Deviation | Variance |
|---|---|---|---|---|---|---|
| Benefits | 20 | 3 | 5 | 4.20 | .696 | .448 |
| Breastfeeding steps | 20 | 4 | 5 | 4.55 | .510 | .252 |
| Keeping breast milk | 20 | 3 | 5 | 4.35 | .671 | .379 |
Table 6.
Most Important Thing Learned
| Comment | Number | Percentage (%)* |
|---|---|---|
| Techniques of breastfeeding | 10 | 27.8 |
| Benefits | 8 | 22.2 |
| Maintaining milk supply | 8 | 22.2 |
| Care of sore nipples | 4 | 11.1 |
| Relaxing before breastfeeding | 3 | 8.3 |
| Miscellaneous | 3 | 8.3 |
| Total | 36 | 99.9 |
Note: Total comments = 36.
Percentage recorded to nearest tenth.
The questionnaire contained four additional inquiries regarding the subjects' overall impression of the programs. A rating scale of 1–5 was used on each question, with 1 being not at all and 5 being very much. Subjects rated all aspects high on the 5-point scale, meaning they very much understood the text, liked the graphics, thought the graphics were well incorporated, and believed the graphics helped them understand the information. The average ratings went from 4.17 for liking the graphics to 4.89 for understanding the text.
Participants in this study were very positive about the breastfeeding education program and clearly rated the program with graphics as preferable to the text-only version. These results demonstrate the beneficial use of computer education tools and the added value of meaningful graphics.
Discussion
Parents preferred the Web-based breastfeeding program with graphics. Ninety percent of the subjects stated that they preferred Program B (with graphics) better and would like to recommend it to their friends. The graphics did not seem to slow the program usage. The results led to the conclusion that health care Web site designers should incorporate graphics with text to increase user satisfaction.
A printed handout on breastfeeding was given to the subjects after they finished the program. All of the parents commented positively on the handout. Some subjects requested a copy during the time they were viewing the computer program. A written tool to accompany the computer program may additionally increase learning. This is consistent with suggestions mentioned in the review of literature (Tang & Newcomb, 1998).
The viewing time was much shorter than expected. All of the subjects finished the entire process within 30–40 minutes. Some of the subjects thought that the length of the time to view the program was good. They did not feel overwhelmed. In addition, they could control the viewing time and link to other resources. The linked page contained Web sites for information on such topics as where to rent or buy a breast pump, nutrition, and other breastfeeding-related facts. Subjects could go to the sites and then return to the program tool as often as they desired. The Web-based format provided a great deal of flexibility for the users and allowed the users to find information of particular importance to his or her learning needs.
The Web-based format provided a great deal of flexibility for the users and allowed the users to find information of particular importance to his or her learning needs.
Implications for Practice
This project determined parents were highly satisfied with the Web-based breastfeeding programs, especially the text-with-graphics version. Therefore, educators are encouraged to use Web-based graphic programs to provide breastfeeding and other health education topics to new parents. Also, a printed handout to take home regarding the contents of patient education is recommended.
One of the benefits of using a Web-based leaning tool is that the program can be viewed at any number of locations. Expectant parents could view programs (such as this one on breastfeeding) at home or in prenatal classes. Surveys and evaluation tools could be included for instructor verification of learning and topic mastery.
Additional studies are needed on the use of Web-based tools at distant locations. It was also suggested that the breastfeeding program with text and graphics be translated into other languages, such as Spanish. Studies are needed to explore cultural factors that should be incorporated, access to computers and the Internet by different ethnic groups, and the ratio of graphical information to text for these groups. Future studies with larger, randomly assigned subjects are also needed to make conclusive statements on the value of graphics in educational computer programs and to test other health care topics.
Another suggestion for future study is examining the use of animation and/or video rather than static pictures. “Traditional learning tools” were identified as handouts, brochures, tapes, and videos. Some of the participants reported preferring the videos rather than the static graphics, especially on the section covering breastfeeding techniques. Thus, future studies could compare the preferences of participants regarding each item of the traditional learning tools and incorporate animation and/or video in the computer program.
Appendix A
Examples from Both Text-Only and Graphics Web-Based Versions
Appendix B
Overall User Reaction Questionnaire
Appendix C
Final Evaluation Questionnaire
References
- American Academy of Pediatrics [AAP]. Breastfeeding and the use of human milk. Pediatrics. 1997;100:1035–1039. doi: 10.1542/peds.100.6.1035. [DOI] [PubMed] [Google Scholar]
- American Academy of Pediatrics [AAP]. 1999. Ten steps to support parents' choice to breastfeed their baby (Project 6 HO4 MC 00009-021). The Maternal and Child Health Program, Health Resources and Services Administration, Department of Health and Human Services.
- Baldwin E. N. Extended breastfeeding and the law. Breastfeeding Abstracts. 2001;20:19–20. [Google Scholar]
- Brasseur L. The role of experience and culture in computer graphing and graph interpretive process. 1999. Proceedings on the Seventeenth Annual International Conference on Computer Documentation, New Orleans, LA, 9–15.
- Eng T. R, Maxfield A, Patrick K, Deering M. J, Ratzan S. C, Gustafson D. H. Access to health information and support: A public highway or a private road? Journal of the American Medical Association. 1998;280:1371–1375. doi: 10.1001/jama.280.15.1371. [On-line]. Available: http://jama.ama-assn.org/issues/v280n15/rfull/jpp80018.html. [DOI] [PubMed] [Google Scholar]
- Freed G. L, Fraley J. K. Effect of expectant mothers' feeding plan on prediction of fathers' attitudes regarding breastfeeding. American Journal of Perinatology. 1993;10:300–303. doi: 10.1055/s-2007-994745. [DOI] [PubMed] [Google Scholar]
- Funnell M. M, Donnelly M. B, Anderson R. M. Perceived effectiveness, cost, and availability of patient education methods and materials. Diabetes Educator. 1992;8:139–145. doi: 10.1177/014572179201800207. [DOI] [PubMed] [Google Scholar]
- Hebda T, Czar P, Mascara C. Ensuring the quality of information. 1998. Handbook of Informatics for Nurses and Health Care Professionals (pp. 30–44). Menlo Park, CA: Addison Wesley Longman.
- Hoyer S, Pokorn D. The influence of various factors on breastfeeding in Solvenia. Journal of Advanced Nursing. 1998;27:1250–1256. doi: 10.1046/j.1365-2648.1998.00649.x. [DOI] [PubMed] [Google Scholar]
- Jimison H. B, Sher P. P. Decision support for patients. 1999. In E. S. Berner, (Ed.), Clinical Decision Support Systems: Theory and Practice (pp.139–166). New York: Springer-Verlag.
- Joint Commission on Accreditation of Healthcare Organizations. 1999. Improving patient and family education: A health-care staff handbook. South Deerfield, MA: Channing L. Bete Co. [Google Scholar]
- Jones D. A. The choice to breastfeed or bottle feed and influences upon that choice: A survey of 1525 mothers. Child Care Health Development. 1987;13:75–85. doi: 10.1111/j.1365-2214.1987.tb00525.x. [DOI] [PubMed] [Google Scholar]
- Kahn G. Computer-based patient education: A progress report. MD Computing. 1993;10:93–99. [PubMed] [Google Scholar]
- Knapp R. B. Breastfeeding practices of WIC participants from the USSR (Union of Soviet Socialist Republics). Journal of the American Dietetic Association. 1999;99:1269–1271. doi: 10.1016/S0002-8223(99)00311-9. [DOI] [PubMed] [Google Scholar]
- Leaffer T, Gonda B. The Internet: An underutilized tool in patient education. Computers in Nursing. 2000;18:47–52. [PubMed] [Google Scholar]
- Linderg D. A. B, Humphreys B. L. Medicine and health on the Internet: The good, the bad, and the ugly. The Journal of the American Medical Association. 1998;280:1303–1304. doi: 10.1001/jama.280.15.1303. [DOI] [PubMed] [Google Scholar]
- College. Lin-Toung Technology. 31 July 1998. Compare the results of differences of audiovisual technique for learning abstract concepts. 15 p. [On-line]. Available: http://report.ice.ntnu.edu.tw/nscreport/882520275001/
- Losch M, Dungy C. I, Russell D, Dusdieker L. B. April 1995. Impact of attitudes on maternal decisions regarding infant feeding. Journal of Pediatrics, 126(4), 507–514. [On-line]. Available: http://home.mdconsult.com/das/article/body/jorg=journal&source=HS,MI&sp=335015&sid=3. [DOI] [PubMed]
- Marchand L, Morrow M. H. Infant feeding practices: Understanding the decision-making process. Family Medicine. 1994;26:319–324. [PubMed] [Google Scholar]
- Matarrese P, Helwig A. The development and assessment of Web-based health information for a corporate Intranet—A pilot study. 2000. Proceedings of the AMIA Symposium. [On-line]. Available: http://www.ncbi.nlm.nih.gov:80/entrez/query.fcgi?CMD=Display&DB=PubMed. [PMC free article] [PubMed]
- McLaughlin G. SMOG grading: A new readability formula. Journal of Reading. 1969;12(8):639–646. [Google Scholar]
- Montoya C. Digitaled images on the Web: A starring role in curriculum support. Medical Reference Services Quarterly. 1998;17:57–67. doi: 10.1300/J115v17n02_07. [DOI] [PubMed] [Google Scholar]
- Moreland J, Coombs J. Promoting and supporting breastfeeding. American Academy of Family Physicians. 2000;61:2093–2100,. 2103–2104. [PubMed] [Google Scholar]
- Neifert M. R. Clinical aspects of lactation: Promoting breastfeeding success. Clinics in Prenatalogy. 1999;26:281–306. [PubMed] [Google Scholar]
- Nielsen J. Interactive user-interface design. Computer. 1993;26(11):32–41. [Google Scholar]
- Nielsen J. May 1996. Top ten mistakes in web design. Alertbox. 3 p. [On-line]. Available: http://www.useit.com/alertbox/9605.html.
- Office of Disease Prevention and Health Promotion, U.S. Department of Health and Human Services. 2000. Healthy people 2010. [On-line]. Available: http://www.health.gov/healthypeople/document/HTML/Volume2/16MICH.htm. [Google Scholar]
- Office of Patient Education. 1997. An author's guide. Salt Lake City, UT: University of Utah Hospitals and Clinics. [Google Scholar]
- Office of Patient Education. 2000. Patient education workshop: Participant packet. Salt Lake City, UT: University of Utah Hospitals and Clinics. [Google Scholar]
- Office of Technology Commercialization. (October 1990). New system evaluates human-computer interface. [On-line]. Available: http://lap.umd.edu/quis/publications/newspaper1.html.
- Porcelli P. J, Lobach D. F. Integration of clinical decision support with on-line encounter documentation for well-child care at the point of care. 1999. Proceedings of the American Medical Informatics Association Symposium. 5 p. [On-line]. Available: http://www.ncbi.nlm.nih.gov:80/enterz/query.fcgi?CMD=Display&DB=PubMed. [PMC free article] [PubMed]
- Rubin J. 1994. Handbook of usability testing: How to plan, design, and conduct effective tests. New York: John Wiley & Sons. [Google Scholar]
- Sandrich K. The Internet as a patient / Medical education tool. 2000. Bulletin of the American College of Surgeons, 85, 47–49, 68.
- Staggers N, Kobus D. Comparing response time, errors, and satisfaction between text-based and graphical user interfaces during nursing order tasks. Journal of the American Medical Informatics Association. 2000;7:164–176. doi: 10.1136/jamia.2000.0070164. [DOI] [PMC free article] [PubMed] [Google Scholar]
- Tang P. C, Newcomb C. Informing patients: A guide for providing patient health information. Journal of the American Medical Informatics Association. 1998;5:563–570. doi: 10.1136/jamia.1998.0050563. [DOI] [PMC free article] [PubMed] [Google Scholar]


