Abstract
The protein expression profiles and antigenicities of both culture filtrates (CF) and cellular extracts (CE) of Mycobacterium paratuberculosis were compared by sodium dodecyl sulfate-polyacrylamide gel electrophoresis (SDS-PAGE), one-dimensional electrophoresis (1-DE) and 2-DE immunoblotting, and enzyme-linked immunosorbent assay (ELISA). The CF proteins were harvested from supernatants of stationary-phase liquid cultures and concentrated by size exclusion filtration. The CE proteins were extracted by mechanical disruption of cells using glass beads and a high-speed agitator. Analysis of SDS-PAGE gels showed that the majority of CF proteins had low molecular masses (<50 kDa), whereas CE protein mass ranged more evenly over a broader range up to 100 kDa. By 2-DE, CF proteins had a narrow array of pI values, with most being between pH 4.0 and 5.5; CE proteins spanned pI values from pH 4.0 to 7.0. The antigenicities of CF and CE proteins were first determined by 1-DE and 2-DE immunoblotting with serum from a cow naturally infected with M. paratuberculosis. The serum reacted strongly to more proteins in the CF than the CE. Sera from 444 infected and 412 uninfected cattle were tested by ELISA with CF and CE as solid-phase antigens. Receiver-operator characteristic curve analysis of the ELISA results showed a significantly greater area under the curve for CF compared to CE (P < 0.05). A high degree of variability in protein binding patterns was shown with 1-DE immunoblot analysis with 31 sera from M. paratuberculosis-infected cattle. Collectively, these results indicate that serologic tests for bovine paratuberculosis may be improved by using proteins derived from CF instead of CE. To maximize the diagnostic sensitivity of serologic tests, multiple proteins will be required. Even so, a CF ELISA may not be able to detect all M. paratuberculosis-infected cattle, in particular those in the early stages of infection that have yet to mount an antibody response.
Bovine paratuberculosis is diagnosed either by detecting the causative agent Mycobacterium paratuberculosis (also known as Mycobacterium avium subsp. paratuberculosis) or an immune response to the agent (6). Microbiological culture of the organism from feces is a widely used diagnostic test and is considered the reference assay against which other tests are compared. Culture of M. paratuberculosis on conventional solid bacteriological media is laborious and slow, requiring up to 16 weeks for assay completion (6). Detection of a cellular immune response by either skin testing or stimulation of leukocytes for gamma interferon release is useful for earlier diagnosis of infection, but these assays suffer from high variability and lower specificity (11, 16, 17, 20). Serologic assays, such as enzyme-linked immunosorbent assays (ELISAs), have low diagnostic sensitivity during early phases of the infection but are a useful tool for Johne's disease control because of low-cost, high-throughput, standardized protocols and correlation with M. paratuberculosis fecal-shedding levels. A recent comparison of commercial ELISA kits for bovine paratuberculosis diagnosis illustrated that the assays performed comparably overall, with diagnostic sensitivity ranging from 27.9 to 44.5% for fecal culture-positive cattle (8). Interestingly, numerous individual cattle were strongly responsive in one assay and not another (8). Although exact details of the antigen preparation methods for commercially available ELISA kits are proprietary, either protoplasmic fractions, other cellular extracts, or lipoarabinomannan are likely the basis of most assays because of the higher antigen yields and ease of preparation (1, 4, 7, 9, 21, 34, 37, 46). Based on a literature review, proteins secreted from M. paratuberculosis into the extracellular environment have received little attention as serodiagnostic assay antigen candidates (21). In contrast, secreted proteins of Mycobacterium tuberculosis are the focus of considerable research as human medicine tries to improve diagnostic assays for tuberculosis (18, 22).
In previous work, we observed that culture conditions significantly influence protein expression profiles of M. paratuberculosis (39). The purpose of the present study was to compare the M. paratuberculosis protein antigens found in the cellular to extracellular compartments by using sodium dodecyl sulfate-polyacrylamide gel electrophoresis (SDS-PAGE), immunoblotting, and ELISA. This work forms the basis of a search for secreted proteins that may improve serodiagnostic tests for bovine paratuberculosis.
MATERIALS AND METHODS
Bacterial strains.
M. paratuberculosis JTC303 was propagated in Middlebrook 7H9 (7H9) broth (Becton Dickinson, Cockeysville, MD) and modified Watson-Reid (WR) broth supplemented with mycobactin J (Allied Monitor, Fayetteville, MO). In addition, 7H9 broth was supplemented with 10% oleic acid-albumin-dextrose-catalase (Becton Dickinson). WR broth (pH 6.0) was prepared without the addition of sodium pyruvate (44). Mycobacterium phlei (ATCC 11758) was cultivated in WR broth, and cellular protein extracts were used to absorb cross-reacting serum antibodies prior to immunoblotting (preabsorption). Cellular extracts and culture filtrates were harvested when growth had reached stationary phase (38).
Culture filtrates (CF).
Bacterial cells grown in WR broth were removed by centrifugation at 30,000 × g for 10 min, followed by filtration (0.2-μm pore size; Nalge Nunc, Rochester, NY). The filtrate was then concentrated roughly 100-fold by using Centricon Plus-80 (Millipore, Billerica, MA) and dialyzed in 10 mM phosphate-buffered saline (PBS; pH 6.8). The concentration of soluble CF proteins was determined by the BCA protein assay kit (Pierce, Rockford, IL).
Cellular extracts (CE).
M. phlei and M. paratuberculosis were grown in WR or 7H9 broth, harvested by centrifugation (30,000 × g for 10 min), and washed three times in 10 mM PBS (pH 6.8). The resultant cell pellets were then homogenized by using an overhead stirrer (Wheaton Instruments, Milville, NJ) for 3 min on ice to minimize clumping of cells. After the addition of a protease inhibitor cocktail (Complete, Mini, EDTA-free, 0.05% [vol/vol]; Roche Diagnostics GmbH, Germany), 10 ml of the homogenized cell pellets was mixed with 20 g of glass beads (0.10 to 0.11 mm; Glassperlen; B. Braun Biotech International GmbH, Germany). The mixture was vigorously agitated for 10 min, while cooling with liquid CO2, using a high-speed agitator (model MSK; Braun Instruments, Allentown, PA). The homogenate was then centrifuged at 30,000 × g for 30 min, and the CE proteins were stored at −70°C. The concentration of CE proteins was also determined by using a BCA protein assay kit (Pierce, Rockford, IL).
Sera.
Sera were collected from healthy uninfected dairy cattle resident in herds at status level 4 in the U.S. Voluntary Bovine Johne's Disease Herd Status Program (8). Sera from cattle known to be infected with M. paratuberculosis were collected from cows in eight different dairy herds. All were naturally infected, clinically normal, and fecal culture positive (8). One of the infected cattle, Dolly, was euthanized according to AALAC protocols to verify her disseminated M. paratuberculosis infection by histopathology and culture of tissues. Serum sufficient to complete the one- and two-dimensional electrophoresis (1-DE and 2-DE) immunoblot analyses was obtained from this cow (i.e., the positive control).
Serum absorption.
Most ELISA kits for paratuberculosis diagnosis enhance assay specificity by absorbing clinical sample sera with antigens derived from M. phlei (9, 25, 46). The importance of this absorption step was well described by Bech-Nielsen et al. These authors reported that the sensitivity of an ELISA without absorption was 0% at 100% specificity in a subclinically infected herd, with absorption sensitivity increased to 33.3% (1). This procedure was adapted for immunoblot analysis and used in the present study to evaluate antigen specificity. The absorbent was a CE that had been prepared from an early-stationary-phase culture of M. phlei grown in WR broth. A similarly prepared CE of M. paratuberculosis served as an absorption control. Absorption with CF proteins was not possible due to low CF protein yield (approximately 68 mg from 1 liter of WR media). Serum absorption was performed by mixing sera with 1,500 μg of CE proteins/ml, followed by incubation at room temperature for 30 min.
1-DE.
The CE and CF proteins were separated under reducing conditions as described by Xiong et al. (45) with commercial precast gels (Jule Biotechnologies, Milford, CT). Gels were prepared in Tris buffer containing SDS (0.375 M Tris-HCl [pH 8.8], 0.1% SDS). Protein samples (10 μg) were loaded into each gradient gel (10 to 20% polyacrylamide, 10 wells, 1.5-mm thickness) well after gel placement in the electrophoresis apparatus (Bio-Rad Mini Protein II; Bio-Rad, Hercules, CA). Gels were electrophoresed for 2 h at 150 V, and the protein bands were visualized by Coomassie brilliant blue staining.
2-DE.
Proteins were mixed with 2-DE sample buffer (0.3% [wt/vol] SDS, 200 mM dithiothreitol, 28 mM Tris-HCl, 22 mM Tris base). After boiling for 10 min in a water bath, the mixture was placed on ice for 10 min. Nuclease-containing cleaning buffer (24 mM Tris base, 476 mM Tris-HCl, 50 mM MgCl2, 500 Kunitz units of DNase I/ml, 2.5 mg of RNase A/ml) was added to the sample buffer at a 1:10 ratio, followed by mixing by pipetting, and placed on ice for 10 min. Rehydration buffer (8.0 M urea, 2% CHAPS {3-[(3-cholamidopropyl)-dimethylammonio]-1-propanesulfonate}, trace amounts of bromophenol blue, 2.8 mg of dithiothreitol/ml, and 0.5% [vol/vol] commercial IPG buffer) was then added to the sample and cleaning buffer at 4:1 ratio. Electrophoresis was performed by using an IPGphore isoelectric focusing system (Amersham Bioscience, Uppsala, Sweden) with a pH 4 to 7 nonlinear IPG DryStrip (Amersham Bioscience). The program was set to run 12 h for rehydration, 500 V · h at 500 V, 1,000 V · h at 1,000 V, and 50,000 V · h at 8,000 V. Each IPG strip was loaded with 100 μg of soluble protein. Isoelectric focused strip gels were then placed into equilibration buffer (50 mM Tris-Cl, 6 M urea, 30% glycerol, 2% SDS, trace amounts of bromophenol blue, and double-distilled water) for 20 min. The equilibrated strips were loaded onto precast 2-DE gels with exponential gradients of 10 to 20% (wt/vol) acrylamide (Jule, Inc., Milford, CT). Protein spots were stained with Brilliant Blue R (Sigma, St. Louis, MO) or transferred to a nitrocellulose membrane (0.2-μm pore size; Bio-Rad) for immunoblotting.
Immunoblotting.
Protein transfer from acrylamide gels to nitrocellulose membranes (0.2-μm pore size; Bio-Rad) was performed as described by Davies et al. using Tris-glycine buffer containing 0.0375% SDS and 20% methanol (10). Before reaction with serum, nitrocellulose membranes were incubated for 1 h in blocking buffer (1% bovine serum albumin in PBS-0.1% Tween). Reaction of proteins with antibodies in either absorbed or nonabsorbed sera was performed for 15 h at room temperature on a rocking platform. Horseradish peroxidase (HRP)-conjugated secondary antibody to bovine immunoglobulin G (IgG; Bethyl, Montgomery, TX) was then added to the membrane, and blots were developed with 3,3′-diaminobenzidine tetrahydrochloride (Sigma, St. Louis, MO) in Tris-buffered saline (pH 7.6).
Documentation and image analysis.
Digital images of each gel were made by using a high-resolution scanner equipped with a transparency unit (PowerLook III; UMAX Technologies, Inc., Dallas, TX). Image analysis of 2-DE immunoblot paper was performed by using computer software (Phoretix 2D Advanced, version 6.01; Nonlinear Dynamics, Durham, NC). The net intensity of each spot was obtained after subtraction of the background. For 1-DE immunoblots, the band location and intensity were measured by using image analysis software (1D image analysis software; Kodak, NY).
ELISA and data analysis.
The CE or CF proteins were diluted in coating buffer (KPL, Gaithersburg, MD) to a final concentration of 1 μg/ml, and 100 μl of each antigen was coated onto 96-well plates (Maxisorp; Nalge Nunc International, Rochester, NY) at 4°C overnight. After being washed, the wells were blocked by adding 10% bovine serum albumin (KPL) at 37°C overnight. Absorbed serum was added to each well, followed by incubation for 30 min at room temperature. Wells were then washed three times with washing buffer (KPL). Antibody binding was detected by using HRP-conjugated secondary antibody to bovine IgG (Bethyl) and TMB substrate (TMBE-500, Moss, Inc., Pasadena, MD). The optical density (OD) of the final reaction in each well was measured at 450 nm (μQuant; Bio-Tek instruments, Inc., Winooski, VT). Receiver-operator characteristic curves were generated, and the area under each curve was determined and compared by using Prism version 4.0 (GraphPad Software, Inc.) (14). The difference between mean ODs for the two antigen preparations, CF and CE, was evaluated by using the Wilcoxon signed-rank test.
RESULTS
Antigenicity analysis and immunoblot by 1-DE.
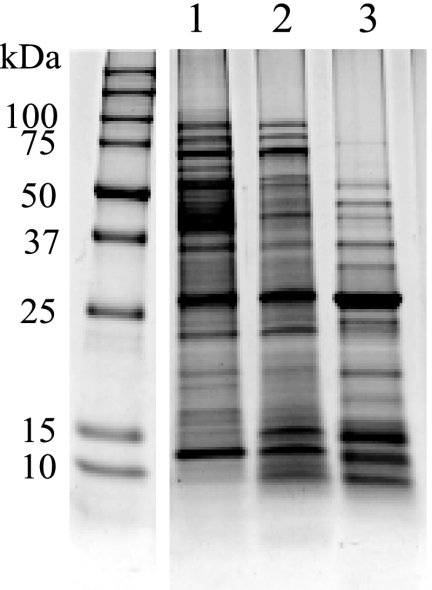
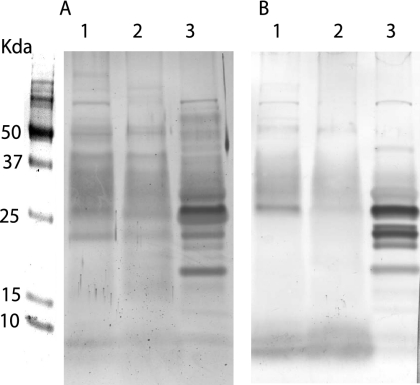
The CE protein profiles obtained differed depending on which culture medium was used to grow M. paratuberculosis (WR versus 7H9) as reported previously (38). Even greater variability was seen between the SDS-PAGE protein profiles for the two fractions, CF and CE (Fig. 1). Immunoblots further highlighted the antigenic disparity between CE and CF proteins (Fig. 2). Weak staining and few bands appeared after immunoblotting for CE proteins produced from M. paratuberculosis grown in WR or 7H9 medium. This pattern was observed both before and after M. phlei absorption (Fig. 2A and B, lanes 1 and 2). In contrast, immunoblot bands were more numerous and more intensely stained using CF proteins (Fig. 2A and B, lane 3). Low molecular mass proteins (<26 kDa) showed particularly strong reactivity with the positive control serum (Dolly). Minimal changes to this immunoblot pattern were seen when the serum was absorbed with M. phlei antigens (Fig. 2A, lane 3, versus panel B, lane 3).
FIG. 1.
SDS-PAGE of M. paratuberculosis CE proteins cultured in WR (lane 1) or 7H9 (lane 2) and the WR CF proteins (lane 3). Molecular masses are indicated on the left of the gel in kilodaltons.
FIG. 2.
Immunoblot of M. paratuberculosis CE proteins cultured in WR (lane 1) or 7H9 (lane 2) medium and the WR CF proteins (lane 3) reacted with serum before (A) and after (B) absorption with M. phlei CE proteins.
Proteome and immunoblot analysis by 2-DE.
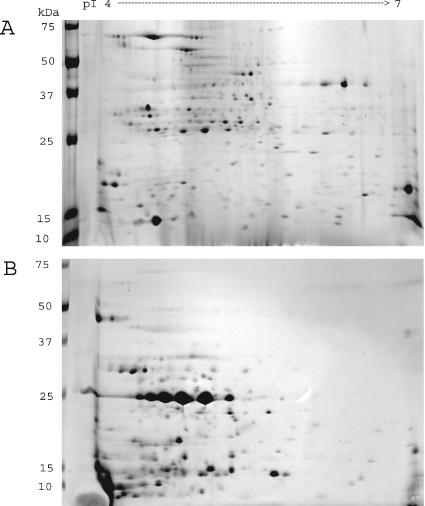
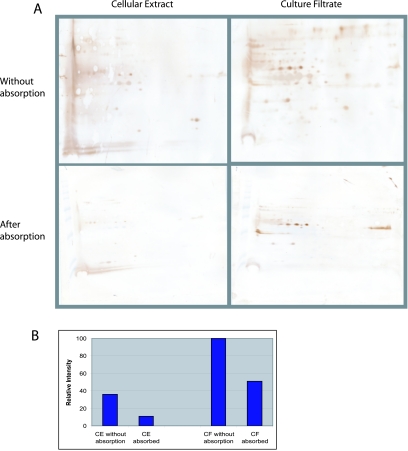
Image analysis of 23-by-30-cm 2-DE gels resolved approximately 400 (CE) and 240 (CF) proteins (Fig. 3). The CE proteins were evenly distributed by mass and pI on the 2-DE gel. In contrast, most CF proteins were <37 kDa and had acidic pI values (pH 4 to pH 5.5). Several proteins in both CE and CF preparations appeared as strings of spots of similar masses but different pIs, suggesting the existence of proteins modified by phosphorylation, glycosylation, or acylation (Fig. 3). The 2-DE immunoblots of CE and CF preparations were done with or without M. phlei CE protein serum absorption (Fig. 4A). The total staining intensity of all proteins was determined and compared by image analysis software (Fig. 4B). The total immunoreactivity of serum from an M. paratuberculosis-infected cow was greater with CF than CE proteins, a finding in agreement with the 1-DE immunoblot results (Fig. 2). The number of immunoreactive spots after serum absorption was much lower for both CE and CF antigens, but the effect was greater for CE proteins than for CF proteins. Some CF proteins' immunoblot staining intensity was not affected by serum absorption.
FIG. 3.
2-DE of M. paratuberculosis CE proteins (A) and CF proteins (B). Organisms were grown in WR medium and harvested at early stationary phase. After extraction for CE or concentration for CF, 100 μg of protein was applied to the first-dimension pH 4 to 7 nonlinear IPG strips. Second-dimension separation was done by SDS-PAGE on 10 to 20% acrylamide gels and visualized by brilliant blue R staining. The figure is representative of three independent experiments.
FIG. 4.
(A) 2-DE immunoblot of M. paratuberculosis CE and CF with or without serum absorption using M. phlei CE proteins. (B) The gels were digitized, the net spot intensity was calculated, and the results are summarized as a histogram to show the relative net intensity stained spots. The squares on the immunoblots show antigens not affected by serum absorption.
Antigenicity comparisons by 1-DE immunoblotting with multiple sera.
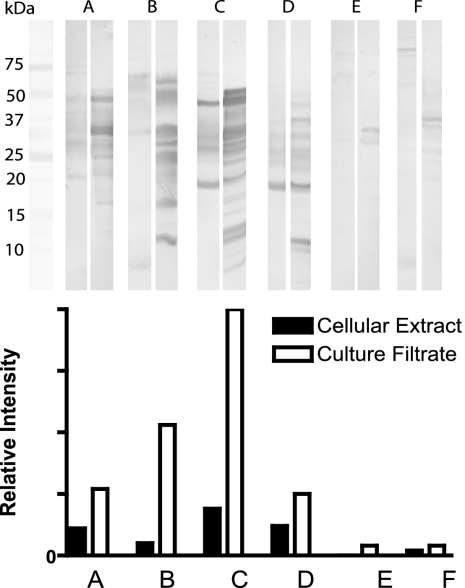
The antigenicities of CE and CF proteins by 1-DE immunoblot analysis were compared by using six sera randomly chosen from the population of >400 sera from M. paratuberculosis-infected cattle. Using image analysis software, each band's location was identified, and its net intensity was calculated. The total staining intensity of all bands was compared as the relative net intensity (Fig. 5). Although some sera had weak antibody responses to CE and CF, the signals to CF were in general much stronger.
FIG. 5.
Immunoblots of CE (left lane) and CF (right lane) proteins using sera from six M. paratuberculosis-infected cattle after absorption with CE of M. phlei, developed with 3,3′-diaminobenzidine tetrahydrochloride. The net band staining intensity was analyzed by using computer software (1D image analysis software; Kodak, New York, NY).
Comparison of CF and CE by ELISA.
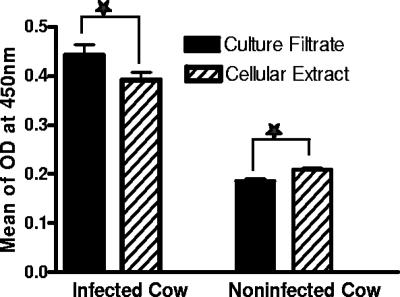
Sera from 444 infected and 412 infection-free cattle were tested by ELISA with CE and CF proteins as the solid-phase antigen. The mean ELISA OD values for CE and CF antigens were significantly different (P < 0.0169 and P < 0.001) for infected and infection-free cattle, respectively (Fig. 6). Receiver-operator characteristic analysis showing the relationship between specificity and sensitivity revealed that the area under each curve was significantly greater for CF than for CE antigens (0.7716 and 0.6623, respectively; P < 0.05).
FIG. 6.
ELISA results for 412 healthy and 444 naturally M. paratuberculosis-infected dairy cattle. CE or CF (1 μg/ml) was used as the solid-phase antigen.
Variability of immunoblot patterns to CF proteins.
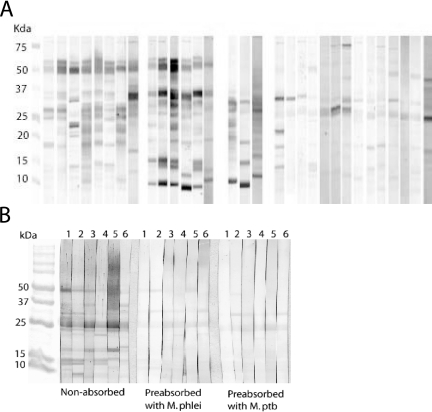
Immunoblot analyses with sera from 31 M. paratuberculosis-infected cattle and 6 infection-free cattle were done after first absorbing sera with M. phlei cellular extract proteins. Among the sera from infected cattle, protein binding patterns were highly variable (Fig. 7A). Seventeen cattle showed strong serum antibody binding to CF proteins of approximately 10, 15, 23, 30, 35, and 50 kDa, but no single protein was reactive with the serum antibody from all 17 cattle. The protein binding patterns for sera from the other 14 M. paratuberculosis-infected cattle were the same as for the sera from uninfected cattle. Sera from uninfected cows, after absorption with M. phlei CE proteins, showed weak reactions to a 25-kDa band of M. paratuberculosis CF. This weak reaction also was seen after absorption of sera with M. paratuberculosis CE proteins (Fig. 7B).
FIG. 7.
Variability of immunoblots profile. Every lane was loaded with 10 μg of M. paratuberculosis CF proteins from organism grown in WR medium. SDS-PAGE was done with 10 to 20% gradient gels. After protein transfer to nitrocellulose, serum was applied, incubated, and stained with rabbit anti-bovine IgG HRP conjugate and diaminobenzidine substrate. The reactivity of sera from 31 M. paratuberculosis-infected cattle, after absorption with M. phlei CE proteins, is shown in panel A. The reactivity of sera from six noninfected cattle is shown in panel B, both preabsorption and postabsorption with M. phlei or M. paratuberculosis. Absorption was done by using 1,500 of CE protein/ml.
DISCUSSION
The proteome of M. paratuberculosis strain JTC303 CF was different from that of the CE. Specifically, CF proteins generally had lower pIs (4.4 to 5.5) and smaller masses (most <30 kDa) than CE proteins. A similar protein pattern was shown in CF prepared from M. paratuberculosis strain ATCC 19698 cultured in Sauton media, suggesting that this difference is not caused by the strains of organism or culture medium (30). Rosseels et al. also showed by SDS-PAGE that M. paratuberculosis CF was markedly different from M. tuberculosis H37Rv CF, where major protein bands were visible at up to 100 kDa. Other mycobacteria also have been shown to have proteins with more acidic pI values than CE proteins (5, 19, 24). In work with Escherichia coli, Helicobacter pylori, and M. tuberculosis, researchers have suggested there is a correlation between pI and subcellular protein localization, especially for cytoplasmic and integral membrane proteins (33, 41). Cytoplasmic proteins have pIs in the range of 5 to 6, whereas integral membrane proteins have pIs of 8.5 to 9. The data presented by Pleissner et al. also revealed a distinct bimodal protein pI pattern centered at around 5 and 9 for M. tuberculosis proteins (29). We suspect that the correlation of a protein's pI with subcellular localization extends to secreted proteins. Moreover, the narrow range of pIs we found in M. paratuberculosis CF contrasted with CE supports the idea that these proteins are actively secreted and not simply released by autolysis of the cells as has been previously proposed (43).
The low pI value of CF proteins may point to their role in macrophage phagolyososome fusion. The low pH within lysosomes, i.e., pH 4.5 to 5.0, favors activation of a hydrolytic enzyme that degrades a wide range of macromolecule and microbes (13). In addition to being optimal for enzyme activation, this low pH would make many secreted mycobacterial proteins insoluble, with solubility being lowest when the pH approaches the pI of the protein. This fact may explain why pathogenic mycobacteria avoid fusion of the phagosome in which they reside in cells with lysosomes (31) and why they have mechanisms that modulate the pH inside the phagosome (36).
The immunoblot and ELISA results presented here showed that serum antibodies from naturally M. paratuberculosis-infected cattle react more strongly and to more proteins in CF than in CE. The obvious explanation for this difference is accessibility. Secreted proteins are more available for interaction with antigen-presenting cells, and T and B lymphocytes, which lead to antibody production. The accessibility of the immune system to most CE proteins, except for those on the mycobacterial cell surface, is likely to be limited.
The diversity of binding patterns of bovine serum antibodies to CF proteins observed in the present study is consistent with that reported for other mycobacterial infections in cattle, deer, and humans (23, 42). Beck et al. found at least four serum antibody response profiles when testing human tuberculosis patient sera against M. tuberculosis antigens (2, 3). Serum antibody responses are primarily affected by the stage of infection. Little or no detectable antibody is produced until the Th1 to Th2 immune response shift occurs (28). The same pattern is seen in paratuberculosis: the early cell-mediated immune response contains the infection for most of the natural history of the M. paratuberculosis infection. The organism appears to be in a dormant state during this stage of infection. When, for unknown reasons, the animal's immune system loses control of the pathogen, or the pathogen begins active replication, the organism disseminates, and the host response shifts to a Th2 type immune reaction. The hallmark of this infection stage is production of detectable serum antibodies. A positive relationship has been shown between the level of serum antibody production and the number of M. paratuberculosis isolated from fecal samples (8, 27).
A second possible explanation for the diversity in antibody-antigen binding patterns is host response variability to the infection. Paratuberculosis has diverse histopathological forms paralleling those of leprosy, ranging from lepromatous (multibacillary) to tuberculoid-like (paucibacillary) with many intermediate lesion categories (15). All forms are thought to represent the advanced stages of disease resulting from infection early in life since adult animals are generally resistant to infection (28). Tanaka et al. showed that cytokine gene expression profiles differ in lepromatous versus tuberculoid forms of paratuberculosis (40). Lepromatous lesions are associated with strong Th2-type cytokine expression and a strong antibody response.
Hormonal, physiological, nutritional, and pharmaceutical influences on the host immune response, both direct and indirect, may also contribute to serum antibody binding differences seen during paratuberculosis in cattle. During the few weeks prior to and after parturition, serum levels of antibody to M. paratuberculosis drop precipitously as antibody is shunted from serum into the colostrum (35). Feola et al. demonstrated the effects of bovine growth hormone on M. paratuberculosis growth rates both inside and outside bovine macrophages (12). Levamisol-treated cattle showed enhanced cell-mediated immune responses to M. paratuberculosis (26). Other parasiticides and corticosteroids also may have immunomodulatory effects that could influence the character of serum antibody production to this pathogen (32).
Our study has several important implications for the serodiagnosis of bovine paratuberculosis. First, serologic tests may be improved by the use of M. paratuberculosis proteins derived from CF instead of CE. Second, to increase the serodiagnostic sensitivity for M. paratuberculosis infection, multiple antigens are likely required. Finally, depending on the stage of infection, not all fecal-culture-positive cows may have detectable serum antibodies to any M. paratuberculosis protein.
Acknowledgments
We thank Elizabeth Manning, Alice Yuroff, and Sung Jae Shin, Department of Pathobiological Sciences, University of Wisconsin—Madison, for valuable comments and critical review of the manuscript.
This research was funded in part by the USDA-NRI Competitive Grant Program (project WIS 04405).
REFERENCES
- 1.Bech-Nielsen, S., J. B. Jorgensen, P. Ahrens, and N. C. Feld. 1992. Diagnostic accuracy of a Mycobacterium phlei-absorbed serum enzyme-linked immunosorbent assay for diagnosis of bovine paratuberculosis in dairy cows. J. Clin. Microbiol. 30:613-618. [DOI] [PMC free article] [PubMed] [Google Scholar]
- 2.Beck, S. T., O. M. Leite, R. S. Arruda, and A. W. Ferreira. 2005. Combined use of Western blot/ELISA to improve the serological diagnosis of human tuberculosis. Braz. J. Infect. Dis. 9:35-43. [DOI] [PubMed] [Google Scholar]
- 3.Beck, S. T., O. M. Leite, R. S. Arruda, and A. W. Ferreira. 2005. Humoral response to low-molecular-weight antigens of Mycobacterium tuberculosis by tuberculosis patients and contacts. Braz. J. Med. Biol. Res. 38:587-596. [DOI] [PubMed] [Google Scholar]
- 4.Braun, R. K., C. D. Buergelt, R. C. Littell, S. B. Linda, and J. R. Simpson. 1990. Use of an enzyme-linked immunosorbent assay to estimate prevalence of paratuberculosis in cattle of Florida. J. Am. Vet. Med. Assoc. 196:1251-1254. [PubMed] [Google Scholar]
- 5.Brunori, L., F. Giannoni, L. Bini, S. Liberatori, C. Frota, P. Jenner, O. F. Thoresen, G. Orefici, and L. Fattorini. 2004. Induction of Mycobacterium avium proteins upon infection of human macrophages. Proteomics 4:3078-3083. [DOI] [PubMed] [Google Scholar]
- 6.Collins, M. T. 1996. Diagnosis of paratuberculosis. Vet. Clin. N. Am. Food Anim. Pract. 12:357-371. [DOI] [PubMed] [Google Scholar]
- 7.Collins, M. T., D. C. Sockett, W. J. Goodger, T. A. Conrad, C. B. Thomas, and D. J. Carr. 1994. Herd prevalence and geographic distribution of, and risk factors for, bovine paratuberculosis in Wisconsin. J. Am. Vet. Med. Assoc. 204:636-641. [PubMed] [Google Scholar]
- 8.Collins, M. T., S. J. Wells, K. R. Petrini, J. E. Collins, R. D. Schultz, and R. H. Whitlock. 2005. Evaluation of five antibody detection tests for diagnosis of bovine paratuberculosis. Clin. Diagn. Lab. Immunol. 12:685-692. [DOI] [PMC free article] [PubMed] [Google Scholar]
- 9.Cox, J. C., D. P. Drane, S. L. Jones, S. Ridge, and A. R. Milner. 1991. Development and evaluation of a rapid absorbed enzyme immunoassay test for the diagnosis of Johne's disease in cattle. Aust. Vet. J. 68:157-160. [DOI] [PubMed] [Google Scholar]
- 10.Davies, R. L., R. A. Wall, and S. P. Borriello. 1990. Comparison of methods for the analysis of outer membrane antigens of Neisseria meningitidis by Western blotting. J. Immunol. Methods 134:215-225. [DOI] [PubMed] [Google Scholar]
- 11.de Lisle, G. W., P. Seguin, B. S. Samagh, A. H. Corner, and J. R. Duncan. 1980. Bovine paratuberculosis I. A herd study using complement fixation and intradermal tests. Can. J. Comp. Med. 44:177-182. [PMC free article] [PubMed] [Google Scholar]
- 12.Feola, R. P., M. T. Collins, and C. J. Czuprynski. 1999. Hormonal modulation of phagocytosis and intracellular growth of Mycobacterium avium subsp. paratuberculosis In bovine peripheral blood monocytes. Microb. Pathog. 26:1-11. [DOI] [PubMed] [Google Scholar]
- 13.Flynn, J. L., and J. Chan. 2001. Immunology of tuberculosis. Annu. Rev. Immunol. 19:93-129. [DOI] [PubMed] [Google Scholar]
- 14.Gardner, I. A., and M. Greiner. 2006. Receiver-operating characteristic curves and likelihood ratios: improvements over traditional methods for the evaluation and application of veterinary clinical pathology tests. Vet. Clin. Pathol. 35:8-17. [DOI] [PubMed] [Google Scholar]
- 15.Gonzalez, J., M. V. Geijo, C. Garcia-Pariente, A. Verna, J. M. Corpa, L. E. Reyes, M. C. Ferreras, R. A. Juste, J. F. Garcia Marin, and V. Perez. 2005. Histopathological classification of lesions associated with natural paratuberculosis infection in cattle. J. Comp. Pathol. 133:184-196. [DOI] [PubMed] [Google Scholar]
- 16.Huda, A., and H. E. Jensen. 2003. Comparison of histopathology, cultivation of tissues and rectal contents, and interferon-gamma and serum antibody responses for the diagnosis of bovine paratuberculosis. J. Comp. Pathol. 129:259-267. [DOI] [PubMed] [Google Scholar]
- 17.Huda, A., P. Lind, A. B. Christoffersen, and G. Jungersen. 2003. Analysis of repeated tests for interferon-gamma (IFN-γ) response and faecal excretion for diagnosis of subclinical paratuberculosis in Danish cattle. Vet. Immunol. Immunopathol. 94:95-103. [DOI] [PubMed] [Google Scholar]
- 18.Imaz, M. S., and E. Zerbini. 2000. Antibody response to culture filtrate antigens of Mycobacterium tuberculosis during and after treatment of tuberculosis patients. Int. J. Tuberc. Lung Dis. 4:562-569. [PubMed] [Google Scholar]
- 19.Jungblut, P. R., U. E. Schaible, H. J. Mollenkopf, U. Zimny-Arndt, B. Raupach, J. Mattow, P. Halada, S. Lamer, K. Hagens, and S. H. Kaufmann. 1999. Comparative proteome analysis of Mycobacterium tuberculosis and Mycobacterium bovis BCG strains: toward functional genomics of microbial pathogens. Mol. Microbiol. 33:1103-1117. [DOI] [PubMed] [Google Scholar]
- 20.Kalis, C. H., M. T. Collins, J. W. Hesselink, and H. W. Barkema. 2003. Specificity of two tests for the early diagnosis of bovine paratuberculosis based on cell-mediated immunity: the Johnin skin test and the gamma interferon assay. Vet. Microbiol. 97:73-86. [DOI] [PubMed] [Google Scholar]
- 21.Koets, A. P., V. P. Rutten, M. de Boer, D. Bakker, P. Valentin-Weigand, and W. van Eden. 2001. Differential changes in heat shock protein-, lipoarabinomannan-, and purified protein derivative-specific immunoglobulin G1 and G2 isotype responses during bovine Mycobacterium avium subsp. paratuberculosis infection. Infect. Immun. 69:1492-1498. [DOI] [PMC free article] [PubMed] [Google Scholar]
- 22.Lodam, A. N., M. V. Reddy, P. Narang, O. P. Gupta, and B. C. Harinath. 1996. Fractionation, analysis and diagnostic utility of Mycobacterium tuberculosis H37Ra excretory-secretory antigen in pulmonary tuberculosis. Indian J. Biochem. Biophys. 33:66-71. [PubMed] [Google Scholar]
- 23.Lyashchenko, K. P., J. M. Pollock, R. Colangeli, and M. L. Gennaro. 1998. Diversity of antigen recognition by serum antibodies in experimental bovine tuberculosis. Infect. Immun. 66:5344-5349. [DOI] [PMC free article] [PubMed] [Google Scholar]
- 24.Mattow, J., U. E. Schaible, F. Schmidt, K. Hagens, F. Siejak, G. Brestrich, G. Haeselbarth, E. C. Muller, P. R. Jungblut, and S. H. Kaufmann. 2003. Comparative proteome analysis of culture supernatant proteins from virulent Mycobacterium tuberculosis H37Rv and attenuated M. bovis BCG Copenhagen. Electrophoresis 24:3405-3420. [DOI] [PubMed] [Google Scholar]
- 25.Milner, A. R., A. W. Lepper, W. N. Symonds, and E. Gruner. 1987. Analysis by ELISA and Western blotting of antibody reactivities in cattle infected with Mycobacterium paratuberculosis after absorption of serum with M. phlei. Res. Vet. Sci. 42:140-144. [PubMed] [Google Scholar]
- 26.Mondal, D., R. P. Sinha, and M. K. Gupta. 1994. Effect of combination therapy in Mycobacterium paratuberculosis-infected rabbits. Indian J. Exp. Biol. 32:318-323. [PubMed] [Google Scholar]
- 27.Nielsen, S. S., and N. Toft. 2006. Age-specific characteristics of ELISA and fecal culture for purpose-specific testing for paratuberculosis. J. Dairy Sci. 89:569-579. [DOI] [PubMed] [Google Scholar]
- 28.Olsen, I., G. Sigurgardottir, and B. Djonne. 2002. Paratuberculosis with special reference to cattle: a review. Vet. Q. 24:12-28. [DOI] [PubMed] [Google Scholar]
- 29.Pleissner, K. P., T. Eifert, S. Buettner, F. Schmidt, M. Boehme, T. F. Meyer, S. H. Kaufmann, and P. R. Jungblut. 2004. Web-accessible proteome databases for microbial research. Proteomics 4:1305-1313. [DOI] [PubMed] [Google Scholar]
- 30.Rosseels, V., S. Marche, V. Roupie, M. Govaerts, J. Godfroid, K. Walravens, and K. Huygen. 2006. Members of the 30- to 32-kilodalton mycolyl transferase family (Ag85) from culture filtrate of Mycobacterium avium subsp. paratuberculosis are immunodominant Th1-type antigens recognized early upon infection in mice and cattle. Infect. Immun. 74:202-212. [DOI] [PMC free article] [PubMed] [Google Scholar]
- 31.Russell, D. G., H. C. Mwandumba, and E. E. Rhoades. 2002. Mycobacterium and the coat of many lipids. J. Cell Biol. 158:421-426. [DOI] [PMC free article] [PubMed] [Google Scholar]
- 32.Sajid, M. S., Z. Iqbal, G. Muhammad, and M. U. Iqbal. 2006. Immunomodulatory effect of various anti-parasitics: a review. Parasitology 132:301-313. [DOI] [PubMed] [Google Scholar]
- 33.Schwartz, R., C. S. Ting, and J. King. 2001. Whole proteome pI values correlate with subcellular localizations of proteins for organisms within the three domains of life. Genome Res. 11:703-709. [DOI] [PubMed] [Google Scholar]
- 34.Sockett, D. C., T. A. Conrad, C. B. Thomas, and M. T. Collins. 1992. Evaluation of four serological tests for bovine paratuberculosis. J. Clin. Microbiol. 30:1134-1139. [DOI] [PMC free article] [PubMed] [Google Scholar]
- 35.Stabel, J. R., and J. P. Goff. 2004. Efficacy of immunologic assays for the detection of Johne's disease in dairy cows fed additional energy during the periparturient period. J. Vet. Diagn. Investig. 16:412-420. [DOI] [PubMed] [Google Scholar]
- 36.Sturgill-Koszycki, S., P. H. Schlesinger, P. Chakraborty, P. L. Haddix, H. L. Collins, A. K. Fok, R. D. Allen, S. L. Gluck, J. Heuser, and D. G. Russell. 1994. Lack of acidification in Mycobacterium phagosomes produced by exclusion of the vesicular proton-ATPase. Science 263:678-681. [DOI] [PubMed] [Google Scholar]
- 37.Sugden, E. A., K. Stilwell, and A. Michaelides. 1997. A comparison of lipoarabinomannan with other antigens used in absorbed enzyme immunoassays for the serological detection of cattle infected with Mycobacterium paratuberculosis. J. Vet. Diagn. Investig. 9:413-417. [DOI] [PubMed] [Google Scholar]
- 38.Sung, N., and M. T. Collins. 2003. Variation in resistance of Mycobacterium paratuberculosis to acid environments as a function of culture medium. Appl. Environ. Microbiol. 69:6833-6840. [DOI] [PMC free article] [PubMed] [Google Scholar]
- 39.Sung, N., K. Takayama, and M. T. Collins. 2004. Possible association of GroES and antigen 85 proteins with heat resistance of Mycobacterium paratuberculosis. Appl. Environ. Microbiol. 70:1688-1697. [DOI] [PMC free article] [PubMed] [Google Scholar]
- 40.Tanaka, S., M. Sato, T. Onitsuka, H. Kamata, and Y. Yokomizo. 2005. Inflammatory cytokine gene expression in different types of granulomatous lesions during asymptomatic stages of bovine paratuberculosis. Vet. Pathol. 42:579-588. [DOI] [PubMed] [Google Scholar]
- 41.VanBogelen, R. A., E. E. Schiller, J. D. Thomas, and F. C. Neidhardt. 1999. Diagnosis of cellular states of microbial organisms using proteomics. Electrophoresis 20:2149-2159. [DOI] [PubMed] [Google Scholar]
- 42.Waters, W. R., M. V. Palmer, J. P. Bannantine, D. L. Whipple, R. Greenwald, J. Esfandiari, P. Andersen, J. McNair, J. M. Pollock, and K. P. Lyashchenko. 2004. Antigen recognition by serum antibodies in white-tailed deer (Odocoileus virginianus) experimentally infected with Mycobacterium bovis. Clin. Diagn. Lab. Immunol. 11:849-855. [DOI] [PMC free article] [PubMed] [Google Scholar]
- 43.Wayne, L. G., and G. A. Diaz. 1967. Autolysis and secondary growth of Mycobacterium tuberculosis in submerged culture. J. Bacteriol. 93:1374-1381. [DOI] [PMC free article] [PubMed] [Google Scholar]
- 44.Whittington, R. J., A. F. Hope, D. J. Marshall, C. A. Taragel, and I. Marsh. 2000. Molecular epidemiology of Mycobacterium avium subsp. paratuberculosis: IS900 restriction fragment length polymorphism and IS1311 polymorphism analyses of isolates from animals and a human in Australia. J. Clin. Microbiol. 38:3240-3248. [DOI] [PMC free article] [PubMed] [Google Scholar]
- 45.Xiong, Y., M. J. Chalmers, F. P. Gao, T. A. Cross, and A. G. Marshall. 2005. Identification of Mycobacterium tuberculosis H37Rv integral membrane proteins by one-dimensional gel electrophoresis and liquid chromatography electrospray ionization tandem mass spectrometry. J. Proteome Res. 4:855-861. [DOI] [PubMed] [Google Scholar]
- 46.Yokomizo, Y., R. S. Merkal, and P. A. Lyle. 1983. Enzyme-linked immunosorbent assay for detection of bovine immunoglobulin G1 antibody to a protoplasmic antigen of Mycobacterium paratuberculosis. Am. J. Vet. Res. 44:2205-2207. [PubMed] [Google Scholar]


