Abstract
The native flavin, FMN, has been removed from the l-lactate oxidase of Aerococcus viridans, and the apoprotein reconstituted with 12 FMN derivatives with various substituents at the flavin 6- and 8-positions. Impressive linear relationships are exhibited between the sum of the Hammett σpara and σortho parameters and the redox potentials of the free flavins, and between the redox potentials of the free and enzyme-bound flavins. Rapid reaction kinetics studies of the reconstituted enzymes with the substrates l-lactate and l-mandelate show an increase in the reduction rate constant with increasing redox potential, except that, with lactate, a limiting rate constant of ≈700 s−1 is obtained with flavins of high potential. Similar breakpoints are found in plots of the rate constants for flavin N5-sulfite adduct formation and for the reaction of the reduced enzymes with molecular oxygen. These results are interpreted in terms of a two-step equilibrium preceding the chemical reaction step, in which the second equilibrium step provides an upper limit to the rate with which the particular substrate or ligand is positioned with the flavin in the correct fashion for the observed chemical reaction to occur. The relationship of rate constants for flavin reduction and N5-sulfite adduct formation with flavin redox potential below the observed breakpoint indicate development of significant negative charge in the transition states of the reactions. In the case of reduction by substrate, the results are consistent either with a hydride transfer mechanism or with the so called “carbanion” mechanism, in which the substrate α-proton is abstracted by an enzyme base protected from exchange with solvent. These conclusions are supported by substrate α-deuterium isotope effects and by solvent viscosity effects on sulfite binding.
L-lactate oxidase (LOX) from Aerococcus viridans is a member of the family of FMN-containing enzymes that catalyze the oxidation of α-hydroxyacids (1). Considerable evidence has been accumulated that the dehydrogenation reaction involved proceeds via a carbanion mechanism (see refs. 2 and 3 for reviews). The recent crystal structure determination of d-amino acid oxidase (4, 5), a related enzyme involved in the oxidation of α-amino acids, has led to a reconsideration of its reaction mechanism, which, like that of the α-hydroxyacid oxidases, had been considered to involve a carbanion mechanism. Within the α-hydroxyacid oxidase family, glycolate oxidase and flavocytochrome b2 are the only enzymes whose crystal structures have been solved (6, 7). Unlike d-amino acid oxidase, which lacks an active site base capable of abstraction of the α-proton from the substrate, and with which a hydride transfer mechanism now appears likely (4, 8), both glycolate oxidase and flavocytochrome b2 have a histidine residue that appears to be positioned suitably to function as an active site base. This histidine and a set of other residues are conserved in all members of the α-hydroxyacid oxidase family. We have reported a preliminary x-ray analysis of l-lactate oxidase, but the structure has not yet been solved (9). Our main approach to solve the mechanism, therefore, has been based on rapid reaction kinetics studies. In these studies, we have employed substrate analogs, transition state analogs, and site-directed mutants of l-lactate oxidase (10, 11). Here, we have reconstituted apo-enzyme with a series of FMN analogs with different substituents at the 6- and 8- positions of the isoalloxazine ring and have studied the rapid reaction kinetics of the reductive half reaction either by the substrates l-lactate or l-mandelate, the oxidative half reaction with molecular oxygen, and the binding and dissociation of sulfite ion as a nucleophilic ligand and reactant of the enzyme. In the course of this work, it became evident that binding of substrates or ligand to the enzyme is a multistep process preceding the chemical events. Such factors are complicating ones in quantitative structure–function activity relationship (QSAR) studies, which could compromise the interpretation of such studies.
Materials and Methods
FMN analogs were prepared from riboflavin analogs by first conversion to the corresponding FAD analog by treatment with FAD synthase, as originally reported by Spencer et al. (12). Conversion of the FAD analogs to the corresponding FMN analogs was done by using Naja naja snake venom from Sigma just before reconstitution with the apo-enzyme.
l-lactate oxidase from A. viridans (LOX) was from Asahi Chemical Industries (Tokyo). Apo-LOX was made as follows: A diluted enzyme solution (A456 ≈ 1.0) was prepared in 50 mM phosphate buffer (pH 5.7) and KBr was added to 2 M. This enzyme solution was dialyzed for 2 days at 4°C with the same buffer that contained 1 g/250 ml of activated charcoal for adsorbing the released FMN. After the loss of FMN absorbance, the dialysis buffer was changed to 0.1 M phosphate buffer (pH 7) without KBr, and dialysis continued overnight. The resulting apo-enzyme was stored at −20 or −80°C and is stable for at least 1 year under these conditions. The reconstituted enzymes were prepared by titrating the FMN analog with apoenzyme and monitoring the characteristic absorbance changes, and then eliminating any nonbound flavin by concentration with a Centricon 30 (Amicon) ultrafilter, and finally passing through a column of Sephadex G-25 equilibrated with standard buffer [10 mM imidazole (pH 7.0) containing 100 mM KCl].
The midpoint potentials of the enzyme-bound flavin were determined by the xanthine/xanthine oxidase method (13) or, where appropriate, by equilibration with the pyruvate/l-lactate couple. The procedures for the rapid kinetic experiments and sulfite binding/release experiments were as described (1, 10). All reactions were carried out in 10 mM imidazole/100 mm KCl buffer (pH 7.0) at 25°C. Reaction traces were simulated by using a fourth-order Runge-Kutta algorithm implemented in Program A (J. Chiu, R. Wang, J. Dinervo, and D. P. Ballou, personal communication).
Results
Reconstitution of Apo-l-Lactate Oxidase with a Series of FMN Analogs.
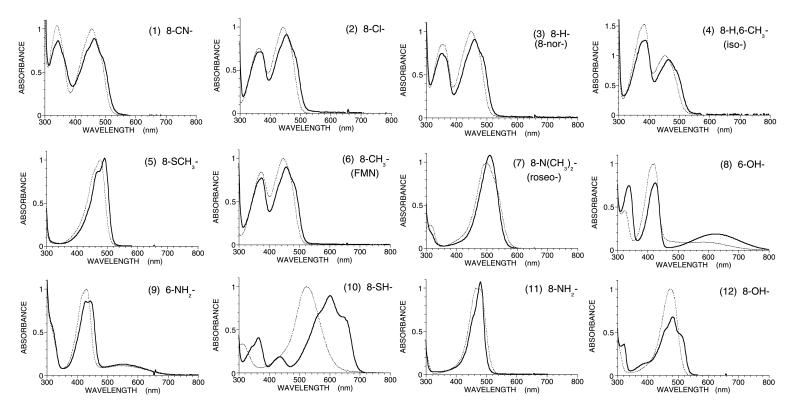
Apo l-lactate oxidase was reconstituted with 12 FMN analogs with different substituents at the flavin 6- and 8- positions. In all cases, reconstitution was complete after mixing equivalent amounts of FMN analog and apo-enzyme. Thus, flavin binding is tight, as is also the case with native enzyme. Fig. 1 summarizes the absorption spectra of the starting FMN analogs and the reconstituted enzymes. All of the reconstituted enzymes showed a red shift in their absorption peaks. The fine structure of the absorption spectra indicate the environment of flavin at the catalytic site is hydrophobic, as with the native enzyme. The flavin fluorescence was quenched both in wild-type LOX and the reconstituted LOX with all of the FMN analogs (data not shown).
Figure 1.
Absorption spectra of a series of FMN analogs (dotted lines) and the reconstituted lactate oxidase with these analogs (solid lines) in 0.1 M phosphate buffer (pH 7.0) at room temperature. The peak intensity of each FMN analog in free solution was normalized as unity. The numberings of absorbance spectra are based on the order of the redox midpoint potential of FMN analogs as follows: 1, 8-CN-FMN; 2, 8-Cl-FMN; 3, 8-H-FMN (norflavin); 4, 8-H,6-CH3-FMN (isoflavin); 5, 8-CH3S-FMN; 6, FMN; 7, 8-(CH3)2N-FMN (roseoflavin); 8, 6-OH-FMN, 9, 6-NH2-FMN; 10, 8-SH-FMN; 11, 8-NH2-FMN; 12, 8-OH-FMN.
8-Cl-FMN-LOX was not reactive with thiol compounds, indicating that the 8-position is buried in the protein matrix (14, 15). A similar phenomenon is found with lactate monooxygenase (16), glycolate oxidase (17), and flavocytochrome b2 (18), indicating that all members of the α-hydroxyacid oxidase family have a similar three-dimensional structure. It should be noted that the 8-position of d-amino acid oxidase is exposed to solvent (4, 5, 16). The absorption spectra of the enzymes reconstituted with 8-mercapto-, 6-OH-, and 8-OH-FMN show that the anionic form of the flavin is stabilized and, in the case of 8-mercapto FMN, also as the benzoquinoid resonance form (19).
Correlation of Hammett σ-Parameters with the Redox Midpoint Potential.
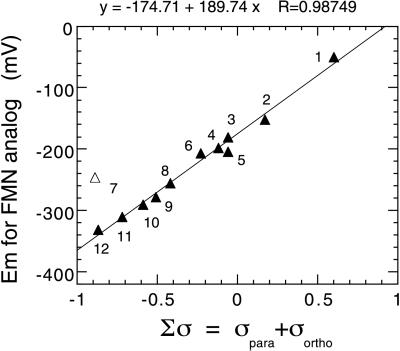
Because the 8- and 6- positions of the isoalloxazine ring are para- and ortho-, respectively, to the reaction center of the flavin N-5 position, Hammett σpara and σortho parameters can be used for representing the electronic characteristics of these functional groups. Therefore, in this study, we have used the sum of the Hammett σpara and σortho parameters, Σσ, in free energy relationship plots (20). Moreover, the absorbance spectra of the 6-OH-, 8-mercapto-, and 8-OH-FMN reconstituted enzymes reveal that they are stabilized in the anionic form (Fig. 1). Consequently the Hammett σ values for the anionic forms of these substituents have been used in the enzyme studies, but not with the free flavins, where an average of the values for the neutral and anionic forms was used. The correlation of the midpoint potentials of free FMN analogs with the sum of σ parameters is excellent (Fig. 2; Table 1). This relation indicates that the empirical Hammett σ parameters at the 6- and 8- positions reflect the electronic effects on the reactivity at the N-5 position of the flavin isoalloxazine ring. One exception is the case of roseo-FMN. The dimethylamino substituent is bulky and frequently results in deviations between calculated and experimental values, presumably because steric interactions twist the N(CH3)2 out of conjugation with the aromatic ring (20).
Figure 2.
Correlation of the redox midpoint potential and the sum of the Hammett σ parameters for the substituents at the 6- and 8- positions of the FMN analogs. The numbering of data points is the same as in Fig. 1 and Table 1. RoseoFMN data (open triangle) were omitted from the regression analysis.
Table 1.
Summary of the characterization of reconstituted l-lactate oxidase with FMN analogs
| No. | Substituted group | Hammett parameter
|
Absorption
peak
|
Midpoint potential
|
Reduction by
l-lactate
|
Reduction by
l-mandelate
|
Oxidation by
O2
|
Reaction with sulfite
|
|||||||||
|---|---|---|---|---|---|---|---|---|---|---|---|---|---|---|---|---|---|
| σpara | σortho | Σσ | Free, nm | Bound, nm | Free, mV | Bound, mV | kred, s−1 | Kd, mM | KIE | kred, s−1 | Kd, mM | KIE | kox, s−1⋅M−1 | kon, s−1⋅M−1 | koff, s−1 | ||
| 1 | 8-CN- | +0.66 | −0.06 | +0.60 | 454 | 464 | −50 | +47 | 714 | 0.55 | 1.7 | 12.2 | 0.38 | 4.3 | 2.76 × 10⁴ | 5.1 × 10⁵ | 5.0 × 10⁻⁴ |
| 2 | 8-Cl- | +0.23 | −0.06 | +0.17 | 442 | 454 | −152 | −65 | 600 | 0.42 | 0.270 | 0.35 | 5.01 × 10⁵ | 4.3 × 10⁵ | 8.7 × 10⁻³ | ||
| 3 | 8-H- | +0.00 | −0.06 | −0.06 | 448 | 460 | −180 | −110 | 726 | 0.51 | 0.051 | 0.28 | 8.01 × 10⁵ | 4.0 × 10⁵ | 0.020 | ||
| 4 | 8-H-,6-CH3- | +0.00 | −0.12 | −0.12 | 452 | 464 | −198 | −142 | 263 | 1.20 | 0.045 | 1.00 | 1.56 × 10⁴ | — | — | ||
| 5 | 8-CH3S- | +0.00 | −0.06 | −0.06 | 476 | 492 | −204 | −151 | 220 | 62 | 0.019 | 11 | 9.22 × 10⁵ | 1,020 | 0.3 | ||
| 6 | 8-CH3- | −0.17 | −0.06 | −0.23 | 448 | 457 | −207 | −128 | 320 | 1.00 | 4.6 | 0.038 | 0.64 | 3.8 | 1.84 × 10⁶ | 1.5 × 10⁵ | 0.076 |
| 7 | 8-(CH3)2N- | −0.83 | −0.06 | −0.89 | 505 | 509 | −246 | −220 | 2.17 | 245 | — | — | 1.98 × 10⁶ | 17.6 | 0.93 | ||
| 8 | 6-O−- | −0.17 | −0.25* | −0.42* | 428 | 426 | −255 | −270 | 0.038 | 97 | — | — | 1.96 × 10⁴ | — | — | ||
| 9 | 6-NH2- | −0.17 | −0.34 | −0.51 | 428 | 444 | −278 | −217 | 8.71 | 4.06 | — | — | 1.20 × 10⁵ | — | — | ||
| 10 | 8-S−- | −0.53* | −0.06 | −0.59* | 520 | 600 | −290 | −224 | 0.026 | 0.12 | — | — | 1.26 × 10⁶ | 45 | — | ||
| 11 | 8-NH2- | −0.66 | −0.06 | −0.72 | 480 | 482 | −310 | −255 | 1.76 | 1.63 | >3 | — | — | 3.58 × 10⁶ | 1,230 | 2.2 | |
| 12 | 8-O−- | −0.81 | −0.06 | −0.87 | 475 | 485 | −331 | −318 | <10−3 | — | — | — | 1.62 × 10⁶ | 2 | 0.36 | ||
KIE, the kinetic isotope effect.
*Average value between neutral and anionic form.
Correlation of the Redox Midpoint Potentials Between Free and Enzyme-Bound FMN Analogs.
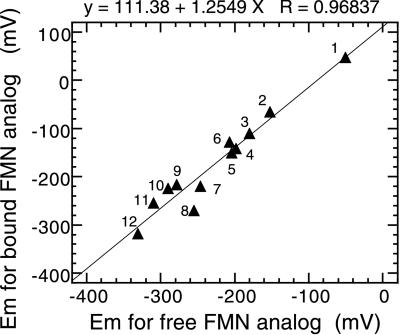
When the midpoint potentials of the reconstituted enzymes with FMN analogs are plotted vs. those of the free FMN analogs, a simple linear relationship is observed (Fig. 3; Table 1). This is true even in the case of roseo-FMN. The poorest correlation is with 6-OH-FMN, whose equilibrium is shifted to the anionic form when bound to the enzyme. The linear correlation indicates that each flavin makes the same interactions with the protein in the reconstituted enzymes, but the strengths vary. The redox potential of the enzyme-bound flavin is uniformly more positive than that of the free flavin, indicating a higher affinity of the reduced flavin to the enzyme than that of the oxidized form. The slope of ≈1.3 is almost identical to that found with many of the same flavins bound to p-hydroxybenzoate hydroxylase (21) and shows that the more electron-withdrawing the substituent is, the stronger the preference for the enzyme to bind the reduced flavin.
Figure 3.
Correlation of the midpoint potentials between enzyme-bound and free FMN analogs. The numbering of the data points is the same as in Fig. 1 and Table 1.
QSAR Analysis of l-Lactate Oxidase Reconstituted with FMN Analogs.
For brevity of presentation, we have plotted the experimental results with the reconstituted enzymes as a function of the measured redox potentials but, for QSAR analyses, have used the Hammett constants of the free flavins in the calculation of the Hammett ρ values.
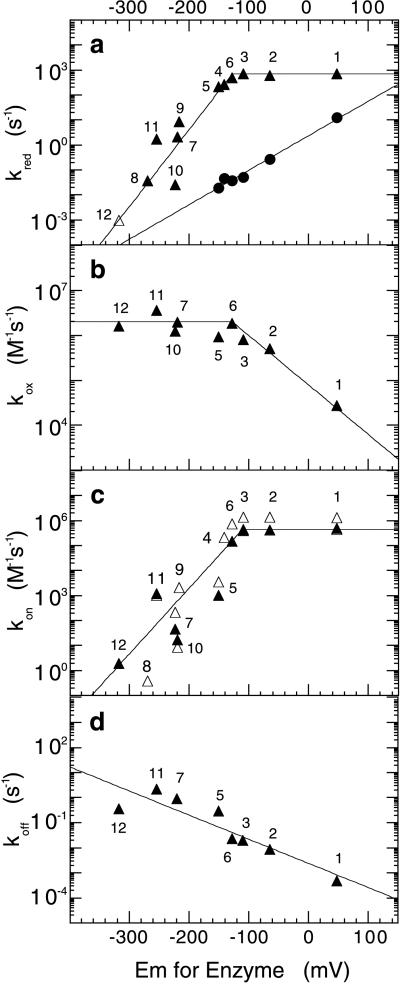
The observed saturating rate constants of the reductive half reaction with l-lactate correlate reasonably well with the redox midpoint potential up to ≈−120 mV and then keep constant at ≈700 s−1 with FMN analogs of higher redox potential (Fig. 4a, triangles). The correlation is even better if the point for 8-mercaptoflavin is discarded. This is reasonable because, in the benzoquinoid form, this flavin bears a negative charge analogous to that in the reduced form, and so is likely to be reduced more slowly than neutral flavins. The reduction rate constants with the poor substrate, l-mandelate, show a linear relation with the redox potential even in the higher redox potential region. When plotted versus the Hammett Σσ values of the free flavins, the slopes yield ρ values of ≈+4–5 for lactate and ≈+3.3 for mandelate. As expected for the reaction of reduced enzyme with oxygen, where the enzyme flavin is the electron donor to oxygen, the opposite relation with the redox potential is found (Fig. 4b), including a break point in the plot at approximately the same redox potential (≈−120 mV). When plotted vs. the Hammett Σσ values of the free flavins for the part of the plot with electron-withdrawing substituents at the flavin 8- position, a slope of ≈−2.5 is obtained for the Hammett ρ value. The rate constants for reaction of O2 with enzyme containing 6-substituted flavins are 1–2 orders of magnitude smaller than with 8-substituted flavins of similar redox potential and show no consistent correlation.
Figure 4.
Correlation of a series of reaction rate constants and midpoint potentials of apo-lactate oxidase reconstituted with FMN analogs. The numbering of the data points is the same as in Fig. 1 and Table 1. (a) Reductive half reaction with l-lactate (triangles) or l-mandelate (circles). (b) Oxidative half reaction with molecular oxygen. (c) Sulfite binding reaction (closed triangles); calculated second order rate constant for reaction with l-lactate, from the relationship kred/Kd′ (open triangles). (d) Sulfite release reaction. The values of koff were determined as described in ref. 2.
Flavoproteins of the α-hydroxyacid oxidase family show a pronounced reactivity with sulfite to form reversibly an adduct at the flavin N5-position (2, 3). It was therefore of interest to measure the kinetics of this reaction with the present series of substituted LOXs. The results are shown in Table 1 and Fig. 4 c and d. Remarkably, the kon values show a similar pattern to those of the kred values for lactate, with increasing values as the redox potential is raised, until again a break point is reached at ≈−120 mV, beyond which the values remain approximately the same. On the other hand, the values of koff show no obvious break point, and decrease consistently as the redox potential of the enzyme flavin is increased (Fig. 4d). When the rate constants are plotted vs. the Hammett Σσ values of the free flavins, a ρ value of ≈+6 is obtained for kon with those flavins before the break point, and a value of ≈ −2.4 is obtained for koff over the whole range. It should be noted that the values of Kd derived from the simple expression Kd = koff/kon are the same, within experimental error, as those derived from equilibrium titration of the enzymes with sulfite (results not shown).
Discussion
The most remarkable finding of this study is that the dependence of the rate constants on redox potential of enzyme reduction by l-lactate (kred, a first order rate constant), for the reoxidation of reduced enzyme by molecular O2 (kox, a second order rate constant), and for the formation of the flavin N5-sulfite adduct (kon, a second order rate constant) all have a break point close to that of normal flavin and then reach limiting values. The limiting second order rate constants observed for sulfite and O2, both ≈106 M−1⋅s−1, suggest the possibility that the reactions become partly diffusion-controlled, even though the numerical values are ≈2–3 orders of magnitude smaller than those usually assumed for typical enzyme-substrate/ligand interaction (22). This result can be explained by the simple model that substrate/ligand binding to the active site is at least a two-step process preceding the observed chemical event (i.e., enzyme flavin reduction by l-lactate, flavin reoxidation by O2, or formation of the flavin N5-adduct):
 |
where EL represents the primary collision complex, and EL′ represents the reactant properly positioned in the active site for the subsequent chemical event, resulting in the modified flavin, E′P. The second step could be a conformational change or diffusion through the active site cleft to the flavin. The dependence of the observed rate constant for formation of E′P, kobs, as a function of ligand concentration, when k5 ≫ k6 gives
 |
or
 |
Thus, a plot of 1/kobs vs. 1/[L] is linear, with a y intercept of (k3 + k3 + k5)/k3k5and a slope/intercept of K′d = (k2k4 + k2k5 + k3k5)/k1(k3 + k4 + k5). Such plots were used to determine the values of kred and Kd′ reported in Table 1.
It should be noted that the expression kred/K′d = k1k3k5/(k2k4 + k2k5 + k3k5) is the same as that for the steady state parameters kcat/Km of a ping-pong mechanism using the same set of rate constants before reaction with the second substrate. It is apparent that this ratio, commonly used as an indicator of enzyme efficiency, and giving a lower limit to the value of k1, in fact only approximates to k1 when k3k5 is much bigger than k2k4 and k2k5.
The expression for kred = k3k5/(k3 + k4 + k5) approaches the value of k5, the rate constant for the chemical step, when k3 is much bigger than k4 and k5. This is presumably the situation with enzyme-containing flavins of low redox potential, where there is a reasonable linear free energy relationship for flavin reduction by substrate. With flavins of potential greater than that of FMN, presumably k5 now becomes much larger than k3, so that the observed rate constant is now limited by k3. The experimental results can be nicely modeled in this way, with a large value of k1, consistent with the large values expected of diffusion of substrate to enzyme, but followed by a secondary slower process, with a rate constant k3 of ≈1,000 s−1. In this model, the chemical event, with rate constant k5, is not adequately expressed at high values of k5 because the preceding step is now rate-limiting.
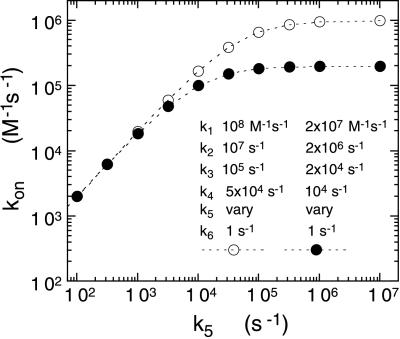
A similar model holds for the reaction of reduced enzyme with O2 and for the reaction of oxidized enzyme with sulfite. In both cases, the experimentally observed rate constants are directly proportional to O2 and sulfite concentrations, respectively, yielding the second order rate constants given in Table 1. This result is still consistent with the three-step model, provided that the initial binding step is weak and k3 and k4 are large. Under these conditions, although the model still predicts saturating kinetics, at most concentrations of ligand, the observed rate constant is directly proportional to [L] and the observed rate constant is given by the ratio k1k3k5/(k2k4 + k2k5 + k3k5). Fig. 5 shows a theoretical plot of this apparent second order rate constant for a given set of values of k1, k2, k3, k4 as a function of varying the value of k5. The plot clearly mimics the results shown in Fig. 4 for the observed second order rate constants with both sulfite and oxygen. Fig. 5 also shows the results of decreasing the values of k1, k2, k3, and k4 by a factor of 5, as a model for a possible viscosity effect of 5, which could be expected for results in ≈40% sucrose at 25°C. It is instructive to note that, if only k1 and k2 are decreased, but k3 and k4 left at their initial values, no viscosity effect is predicted on the value of kobs. When all four rate constants, k1, k2, k3, and k4, are decreased by a factor of 5, the same results are predicted as when only k3 and k4 are decreased. The theoretical viscosity effect is only exhibited at values of k5 ⩾ k4. Accordingly, we studied the effect of 40% sucrose on the sulfite binding kinetics with four selected flavins bound to the enzyme. With the high potential flavins, 8-CN- and 8-Cl-FMN bound to the enzyme, the viscosity effect with 40% sucrose on the value of kon was 2.8 and 2.3, respectively. With native (FMN) enzyme, the viscosity effect was 1.65. With 8-SCH3-FMN enzyme, which has a 103 smaller value of kon, there was no observed viscosity effect, in agreement with the model.
Figure 5.
Calculated relationship of the value of kon (e.g., the second order rate constant for reaction with sulfite) as a function of the value of k5 for the model described in the text. The values of kon were calculated from the ratio k1k3k5/(k2k4 + k2k5 + k3k5) as described in the text. The same values were confirmed by computer simulation of the three-step binding model. The two sets of curves simulate a 5-fold viscosity effect on the entry and positioning of reactant before the observed chemical step, k5.
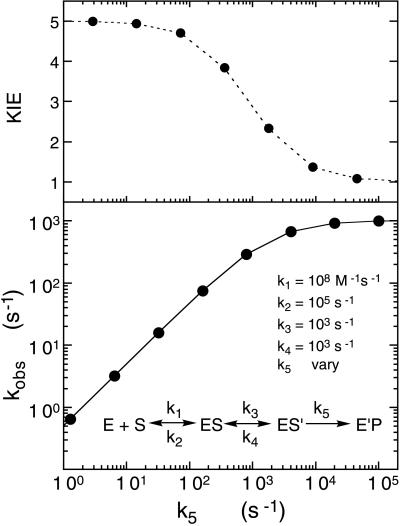
It is interesting to note that the ratio of kred/Kd′ with lactate as substrate is very similar to the observed kon value for sulfite with all of the substituted flavin enzymes (Fig. 4). The observed results with l-lactate both in terms of kred and kred/Kd′ can be modeled well with the rate constants used for the simulations of Fig. 6. With these values, kred reaches a saturating value of 900–1,000 s−1, with k5 values between 104 and 105 s−1, and the ratio kred/Kd′ reaches a limiting value of ≈1 × 10⁶ M−1⋅s−1, with k5 values between 103 and 104 s−1. It should be noted that fitting of the sulfite and lactate data cannot be achieved with the same numerical values of rate constants. The sulfite-binding data require considerably larger ratios of k2/k1 than for lactate and a value of k3 in the neighborhood of 105 s−1 to simulate the observed results. This requires that the primary step in lactate binding must be tighter than that with sulfite but that the latter should move to the correct position over the flavin for nucleophilic attack on the flavin N5-position considerably faster than lactate positions itself for reduction of the flavin, by whatever chemical mechanism. The fact that very similar values are obtained for the apparent second order rate constants with sulfite and l-lactate (Fig. 4c), but that the fitting of the data require quite different combinations of rate constants, points out the possibility of misleading interpretation of kred/Kd′ or kcat/Km ratios in QSAR analyses. It should be noted that the concept of multistep binding of substrate to an enzyme is not new and in one form or another has been used to account for the fact that measured or calculated rates of protein–ligand interactions are frequently much lower than expected for diffusion-controlled interactions (see, for example, ref. 22 for a good discussion).
Figure 6.
Computer simulation for the relation of the observed rate constant for flavin reduction versus the intrinsic rate constant, k5, for the model shown, where the second equilibrium step provides a limit to the rate at which substrate is able to position itself in the enzyme active site in the optimal position for reduction to occur. The calculated values shown in the lower graph are for a progression of 5-fold increases in the value of k5. The top graph shows the expected isotope effect for each 5-fold change of k5. Thus, full isotope effects are exhibited at values of k5 below that of k3, but decrease to zero as the value of k5 becomes larger than that of k3.
Having established that a limiting step in the reduction of the enzyme flavin by l-lactate can be the rate at which the substrate is brought to the correct position in relation to the flavin to permit the chemical step to occur, what can be concluded about the mechanism of substrate dehydrogenation reaction from the behavior with those flavins in which the chemical step clearly depends on the redox potential of the bound flavin and the electronic properties of the flavin substituents? The slopes of the plots of kred vs. the Hammett σpara + σortho constants are quite high, giving positive ρ values of 4–5 for l-lactate with flavins of low potential and ≈3.3 for l-mandelate for the whole range of flavins studied. In the reaction with sulfite, the slope before the break point is even greater, giving a ρ value of ≈6. The ρ values indicate the development of considerable negative charge in the transition state, which is not surprising because the product, reduced flavin or the flavin N5-sulfite adduct, is negatively charged. The reaction of sulfite involves a nucleophilic attack of the sulfite ion on the flavin N5 and so is a reasonable model for attack of a substrate carbanion on the same position. The magnitude of the Hammett ρ value could reflect the earliness or lateness of the transition state in the reaction coordinate, with the transition state for sulfite being closer to the final product than with lactate or mandelate.
The observation of a significant ρ value for the reduction of the enzyme by l-lactate is consistent with any mechanism in which the observed rate constant for flavin reduction depends on a step that generates substantial negative charge on the isoalloxazine. The direct transfer of a hydride from l-lactate to the flavin meets this requirement. However, limiting cases of other mechanisms also are consistent with a large ρ value. Substrate α-deprotonation followed immediately by carbanion attack on the flavin N5 and adduct decomposition to pyruvate and reduced flavin could still be consistent with the data if substrate deprotonation is a rapidly equilibrating step. Under those conditions, kobs = Kproton transferkadduct, where Kproton transfer is the equilibrium constant for α-deprotonation by the enzyme and kadduct is the combined rate constant for flavin adduct formation and subsequent breakdown. This requires shielding of the active site from solvent, so that the proton abstracted by the active site base is incorporated at the flavin N5-position in the breakdown of the postulated adduct (23). Note that, as with sulfite adduct formation, significant negative charge would develop on the isoalloxazine in the transition state of the reaction of the carbanion with the flavin.
One expectation of the model presented here is that the kinetic isotope effect for α-deuterolactate should be greatest at low values of kred and minimal, or even non-existent, when kred is limited by the diffusion events preceding the chemical step. This expectation is met, at least partially. With normal flavin enzyme, the kinetic isotope effect is 4.6. With 8-NH2-FMN enzyme, an isotope effect of >3 was observed but could not be determined accurately. With 8-CN-FMN enzyme, a small isotope effect of 1.7 was observed, instead of the 1.0 effect expected from the model of Fig. 6. With the slowly reacting l-mandelate as substrate, substantial isotope effects are observed (Table 1), again consistent with the model.
As expected, the rate constant for reaction of oxygen with the reduced flavin enzyme shows the opposite dependence on redox potential as the reduction reaction. More remarkable is the observation that again a limiting second order rate constant is reached, with a single breakpoint at around a redox potential of −120 to −140 mV, below which there is no further increase in rate constant. Again, as with the reaction with sulfite, this can be explained by the two-step binding model, in which the primary binding step is approximately diffusion-controlled and thermodynamically very weak, followed by a secondary step of the order of 105 s−1, which provides an upper limit of the chemical event of reoxidation of the reduced flavin. The slope of the plot where the observed rate constant depends on redox potential yields a Hammett ρ value of ≈−2.5, consistent with a decrease of negative charge in conversion of the anionic reduced flavin to the neutral oxidized flavin, and again consistent with a late transition state. The reactivity profile with oxygen is similar to that found with p-hydroxybenzoate hydroxylase, including the breakpoint at approximately the same flavin redox potential (21).
Finally, it should be noted that the dissociation rate constants for reversal of the flavin-sulfite interaction, koff, show a linear dependence on flavin redox potential, with the numerical values decreasing consistently as the flavin potential is increased; i.e., the value of k is greatest with electron-donating substituents and smallest as the flavin substituent becomes more electron-withdrawing in nature. The slope of koff vs. the Hammett σpara + σortho constants gives a ρ value of ≈−2.4, consistent with a transition state more positive in nature than the initial flavin N5-sulfite adduct and indicative of an early transition state.
Acknowledgments
We thank Dr. Y. S. V. N. Murthy for synthesis of 8-CN-riboflavin, Dr. M. Ortiz-Maldonado for the synthesis of 8-H-riboflavin, Dr. S. Chakraborty and Mr. J. Snow for preparing the flavin analogs at the FAD level, and the Fujii-Otsuka Foundation (Tokushima, Japan) for travel support to V.M. This work was supported in part by National Institutes of Health Grant GM-11106 to V.M.
Abbreviations
- LOX
l-lactate oxidase
- QSAR
quantitative structure–function activity relationship
Footnotes
Article published online before print: Proc. Natl. Acad. Sci. USA, 10.1073/pnas.040559797.
Article and publication date are at www.pnas.org/cgi/doi/10.1073/pnas.040559797
References
- 1.Maeda-Yorita K, Aki K, Sagai H, Misaki H, Massey V. Biochimie. 1995;77:631–642. doi: 10.1016/0300-9084(96)88178-8. [DOI] [PubMed] [Google Scholar]
- 2.Ghisla S, Massey V. In: Chemistry and Biochemistry of Flavoenzymes. Muller F, editor. Vol. 2. Boca Raton, FL: CRC; 1991. pp. 243–289. [Google Scholar]
- 3.Lederer F. In: Chemistry and Biochemistry of Flavoenzymes. Muller F, editor. Vol. 2. Boca Raton, FL: CRC; 1991. pp. 156–242. [Google Scholar]
- 4.Mattevi A, Vanoni M A, Todone F, Rizzi M, Teplyakov A, Coda A, Bolognesi M, Curti B. Proc Natl Acad Sci USA. 1996;93:7496–7501. doi: 10.1073/pnas.93.15.7496. [DOI] [PMC free article] [PubMed] [Google Scholar]
- 5.Mizutani H, Miyahara I, Hirotsu K, Nishina Y, Shiga K, Setoyama C, Miura R. J Biochem. 1996;120:14–17. doi: 10.1093/oxfordjournals.jbchem.a021376. [DOI] [PubMed] [Google Scholar]
- 6.Lindqvist Y, Branden C I, Mathews F S, Lederer F. J Biol Chem. 1991;266:3198–3207. [PubMed] [Google Scholar]
- 7.Xia Z X, Mathews F S. J Mol Biol. 1990;212:837–863. doi: 10.1016/0022-2836(90)90240-M. [DOI] [PubMed] [Google Scholar]
- 8.Pollegioni L, Umhau S, Molla G, Harris C M, Ghisla S, Pilone M S. In: Flavins and Flavoproteins. Ghisla S, Kroneck P, Sund H, Macheroux P, editors. Berlin: Rudolf Weber Scientific; 1999. pp. 551–566. [Google Scholar]
- 9.Morimoto Y, Yorita K, Aki K, Misaki H, Massey V. Biochimie. 1998;80:309–312. doi: 10.1016/s0300-9084(98)80072-2. [DOI] [PubMed] [Google Scholar]
- 10.Yorita K, Aki K, Ohkuma-Soejima T, Kokubo T, Misaki H, Massey V. J Biol Chem. 1996;271:28300–28305. doi: 10.1074/jbc.271.45.28300. [DOI] [PubMed] [Google Scholar]
- 11.Yorita K, Janko K, Aki K, Ghisla S, Palfey A B, Massey V. Proc Natl Acad Sci USA. 1997;94:9590–9595. doi: 10.1073/pnas.94.18.9590. [DOI] [PMC free article] [PubMed] [Google Scholar]
- 12.Spencer R, Fisher J, Walsh C. Biochemistry. 1976;15:1045–1053. doi: 10.1021/bi00650a016. [DOI] [PubMed] [Google Scholar]
- 13.Massey V. In: Flavin and Flavoproteins. Curti B, Ronchi S, Zanetti G, editors. Berlin: de Gruyter; 1991. pp. 59–66. [Google Scholar]
- 14.Moore E G, Cardemil E, Massey V. J Biol Chem. 1978;253:6413–6422. [PubMed] [Google Scholar]
- 15.Massey V, Hemmerich P. Biochem Soc Trans. 1980;8:246–257. doi: 10.1042/bst0080246. [DOI] [PubMed] [Google Scholar]
- 16.Schopfer L M, Massey V, Claiborne A. J Biol Chem. 1981;256:7329–7337. [PubMed] [Google Scholar]
- 17.Lindqvist Y, Branden C I. J Biol Chem. 1989;264:3624–3628. [PubMed] [Google Scholar]
- 18.Xia Z X, Shamala N, Bethge P H, Lim L W, Bellamy H D, Xuong N H, Lederer F, Mathews F S. Proc Natl Acad Sci USA. 1987;84:2629–2633. doi: 10.1073/pnas.84.9.2629. [DOI] [PMC free article] [PubMed] [Google Scholar]
- 19.Massey V, Ghisla S, Moore E G. J Biol Chem. 1979;254:9640–9650. [PubMed] [Google Scholar]
- 20.Hansch C, Leo A. Exploring QSAR. Washington, DC: Am. Chem. Soc.; 1995. pp. 1–9. [Google Scholar]
- 21.Ortiz-Maldonado M, Ballou D P, Massey V. Biochemistry. 1999;38:8124–8137. doi: 10.1021/bi990560e. [DOI] [PubMed] [Google Scholar]
- 22.Gutfreund H. Kinetics for the Life Sciences. Cambridge, U.K.: Cambridge Univ. Press; 1995. [Google Scholar]
- 23.Walsh C, Lockridge O, Massey V, Abeles R H. J Biol Chem. 1973;248:7040–7054. [PubMed] [Google Scholar]


