

Abstract
Environmental allergens are major triggers for pediatric asthma. While children’s greatest exposure to indoor allergens is in the home, other public places where children spend a large amount of time, such as school and day care centers, may also be sources of significant allergen encounters. The purpose of this article is to describe schoolroom allergen levels from 3 different geographic sites obtained from dust samples collected in the, fall and in spring. Environmental dust samples were collected from elementary schools in Birmingham (AL), Detroit (MI), and Houston (TX), from 4 room locations, including the cafeteria, library, upper grades, and lower grades. Samples were assayed for dust mite (Dermatophagoides pteronyssinus and Dermatophagoides farinae), cat (Felis domesticus), and cockroach (Blatella germanica 2) allergen levels. Allergen levels varied by geographic location and type of schoolroom. Schoolroom settings differed by the type of flooring (hard and carpet), room characteristics and use (food service, library shelves with books, and general classroom with multiple types of materials [individual desks and different types of furniture]), and the average age of the schoolroom dwellers (younger vs older children). Dust mite, cat, and cockroach allergens were present in all schoolrooms and all sites at varying levels by season and by type of room. Schools may be important sources of direct allergen exposure and reservoirs that could potentially contribute to allergic sensitization and, disease exacerbation in. children. Further studies are needed to carefully examine the environmental allergen load in schools and its effect on children.
INTRODUCTION
Environmental allergens, such as house-dust mites, cockroach, and pet dander, are major triggers of pediatric asthma that can result in exacerbations of asthma and related comorbidities, such as otitis media, sinusitis, and allergic rhinitis. An Institute of Medicine1 report concluded that there was sufficient evidence to conclude a causal relationship between indoor allergen exposure and asthma exacerbations in sensitized children. While a child’s greatest exposure to indoor allergens is likely to be in the home, other public places where they spend a large amount of time, such as school and day care centers, may also be sources of significant allergen encounters. Previous research has clearly documented the variety and extent of allergens in homes, whereas environmental studies in schools have been less comprehensive. Allergen levels at sensitization or near-sensitization thresholds have been found in Swedish schools,2 New Zealand schools,3 and Baltimore4 schools. School buildings vary, and a variety of physical (humidity, temperature, and season), structural (type of building and age), and behavioral factors (maintenance and cleaning practices) can affect allergen concentrations.1
The purpose of this paper is to describe the allergen levels in varying school settings. This may be the first paper to report comparative allergen levels at 3 different geographic sites. This study component was part of 3 National Heart, Lung, and Blood Institute (NHLBI)-funded projects on asthma in elementary schools, where the purpose was to identify children with asthma and to provide asthma education.
METHOD
Sample
The sample was comprised 41 public schools from diverse, large inner-city geographic areas representing the Southeast (Birmingham, AL; n = 18), the Midwest (Detroit, MI; n = 13), and the Southwest (Houston, TX; n = 20). The population served by these schools was predominantly low income (more than two thirds of children participating in free or reduced-cost lunch programs) and minority (African-American: Birmingham and Detroit; mix of African-American and Hispanic: Houston).
Procedures
Dust was collected from 4 locations in the schools, including the cafeteria, library, upper grades (UG = third to fifth grade, although mostly fourth-grade rooms), and lower grades (LG = kindergarten to second grade, although mostly first grade). On school days, we collected samples during the fall (Birmingham: October–December 1997; Detroit: October 1997; and Houston: December 1997) and spring (Birmingham: March–May 1998; Detroit: June 1997; and Houston: May 1997), using the same collection protocol in all sites.
Samples were collected using a vacuum cleaner (Eureka Mighty Mite II; Bloomington, IL) equipped with a standardized collection sock fitted in the vacuum hose. A 3-m2 area in the middle of the schoolroom was vacuumed for a period of 2 minutes. Areas were selected that had student activity or traffic.
Samples were assayed for dust mite allergens, Dermatophagoides pteronyssinus (Der p 1) and Dermatophagoides farinae (Der f 1), cat allergen Felis domesticus (Fel d 1), and cockroach allergen Blatella germanica 2 (Bla g 2). Assays for all sites were done in a single laboratory (D.O.) by methods (monoclonal antibody assays, Indoor Biotechnologies, Ltd, Charlottesville, VA) previously described.5 We used sensitization threshold levels for Der p 1, Der f 1, and Fel d 1 at greater than 2000 ng/g dust and Bla g 2 threshold levels at greater than 40 ng/g dust (1 allergen unit/g dust).6
Statistical Analysis
Descriptive statistics were calculated for allergens by city and schoolroom type. Data were analyzed using the schoolroom as the unit of analysis. Since allergen data were not normally distributed, nonparametric Kruskal-Wallis and Mann-Whitney tests were used to compare median concentrations. Data analyses were carried out using SAS (Statistical Analysis Software, version 6.12, SAS Institute Inc, Cary, NC).
RESULTS
Indoor allergens were shown to vary with different environments. Specific allergen levels varied depending on the geographic location, season, and type of schoolroom.
Both Der f 1 and Der p 1 were found in significantly higher levels in Birmingham and Houston, although the differences were dependent on season and classroom type (Tables 1 and 2). Spring levels of Der f 1 (higher in libraries, LG with carpet or hard floor [hardF], and UG with carpet) and Der p 1 (higher in library, LG, and UG) were significantly higher in Birmingham, though levels were dependent on type of classroom and flooring.
Table 1.
Median Dermatophagoides farinae (Der f 1) Allergen Levels by Type of Room and Season*
|
Fall |
Spring |
|||||||
|---|---|---|---|---|---|---|---|---|
| Birmingham Mdn (n) | Detroit Mdn (n) | Houston Mdn (n) | p Value | Birmingham Mdn (n) | Detroit Mdn (n) | Houston Mdn (n) | p Value | |
| Cafeteria | 176.83 (17) | 77.6 (8) | 27.15 (19) | .82 | 13.71 (13) | 19.0 (13) | 40.0 (19) | .06 |
| Library | 822.55 (11) | 276.00 (13) | 533.06 (19) | .02 | 238.5 (16) | 17.5 (13) | 67.5 (20) | .01 |
| Lower grades | ||||||||
| Carpet | 1278.06 (5) | 300.28 (5) | 200.70 (11) | .01 | 1125.92 (10) | 13.0 (4) | 38.5 (10) | .05 |
| Hard floor | 333.01 (10) | 274.38 (5) | 50.76 (9) | .1707 | 28.505 (8) | 105 (10) | 27.35 (10) | .0460 |
| Upper grades | ||||||||
| Carpet | 653.48 (7) | 80.49 (1) | 360.95 (9) | —† | 182.435 (8) | 26.0 (1) | 47.0 (9) | —† |
| Hard floor | 450.66 (8) | 125.83 (11) | 158.81 (10) | .02 | 71.23 (9) | 13.0 (11) | 33.0 (11) | .01 |
Data expressed as ng of Der f 1/g dust. Sample size is in parentheses.
Inadequate sample size to compare across 3 sites.
Table 2.
Median Dermatophagoides pteronyssinus (Der p 1) Allergen Levels by Type of Room and Season*
|
Fall |
Spring |
|||||||
|---|---|---|---|---|---|---|---|---|
| Birmingham Mdn (n) | Detroit Mdn (n) | Houston Mdn (n) | p Value | Birmingham Mdn (n) | Detroit Mdn (n) | Houston Mdn (n) | p Value | |
| Cafeteria | 182.57 (17) | 11.2 (13) | 1822.57 (19) | .0001 | 954.2 (15) | 28.5 (12) | 98.0 (19) | .13 |
| Library | 637.49 (17) | 11.2 (13) | 7463.435 (20) | .0001 | 2457.715 (18) | 34.0 (13) | 425.5 (20) | .0001 |
| Lower grades | ||||||||
| Carpet | 2783.45 (7) | 11.2 (5) | 5404.48 (11) | .0006 | 4455.3 (10) | 19.25 (4) | 1558.5 (10) | .0045 |
| Hard floor | 265.88 (11) | 11.2 (5) | 2764.54 (9) | .01 | 2462.22 (8) | 26.0 (10) | 103.5 (10) | .0023 |
| Upper grades | ||||||||
| Carpet | 452.69 (9) | 285.01 (1) | 7039.45 (9) | .0016 | 2981.1 (8) | 43.0 (1) | 448.00 (9) | .05 |
| Hard floor | 402.12 (9) | 11.2 (11) | 2350.525 (10) | .0001 | 2063.33 (9) | 33.0 (11) | 77.00 (11) | .01 |
Data expressed as ng of Der p 1/g dust. Sample size is in parentheses.
Despite the absence of domestic cats in the sampled schools, cat allergen was found. Birmingham (LG with hardF and UG with hardF) had significantly greater Fel d 1 levels in the fall as compared to the other 2 sites (Figure 1a). High levels of Bla g 2 were found in spring in libraries and classrooms with carpet; however, Birmingham had higher levels in the libraries and UG with carpet (Figure 1b).
Figure 1.
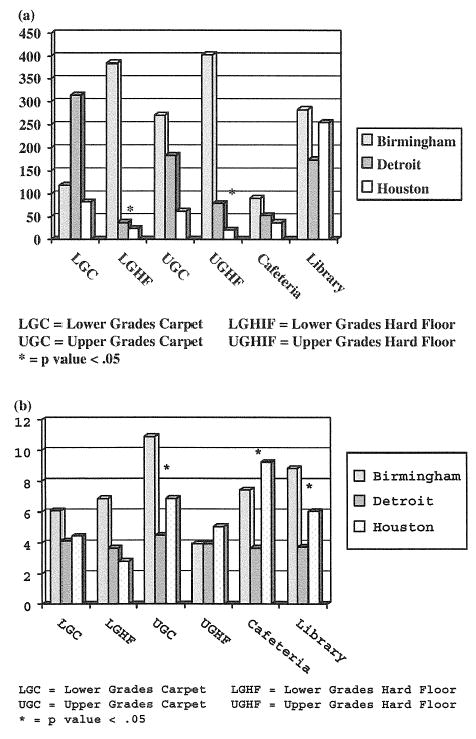
(a) Fel d1 Levels by Type of Room, Fall (ng/g sieved dust) and (b) Bla g 2 Levels by Type of Room, Spring (ng/g sieved dust)
Sensitization threshold levels were exceeded in all types of Birmingham schoolrooms (ranging from a minimum of 5% of cafeterias to a maximum of 35% of LG rooms) for all allergens, except Fel d 1 in the cafeteria. Der p 1, Fel d 1, and Bla g 2 sensitization threshold levels were exceeded in all types of Houston schoolrooms ranging from 3% for Bla g 2 to 68% for Der p 1 in libraries. Fewer Detroit schoolrooms exceeded threshold levels with the exception of the library (8%: Fel d 1, 4%: Bla g 2) and UG (4%: Der p 1).
DISCUSSION
Exposure to some indoor allergens in children has clearly been documented to increase the risk of sensitization, to provoke acute respiratory symptoms, and to exacerbate asthma.1 While allergen risks for children with asthma have been substantiated in the home, few US studies have examined allergen levels in schools. Children spend 90% of their time indoors, and school-aged children spend substantial time, approximately 8 hours/day, approximately 180 days/year, in school.
This is the first large, multisite study to describe multiple allergen levels in diverse schoolroom settings along with geographic and seasonal variations. We have demonstrated that schools may be important sources of direct allergen exposure for children.
Dust mite allergens proliferate in warm temperatures and high-humidity areas7,8 such as Birmingham and Houston compared to Detroit schools, where temperatures and ambient humidity are less extreme. School settings, particularly LG classrooms and libraries, have similar dust mite reservoirs such as upholstered furniture, large floor pillows, and books. Children in LG classrooms are typically more physically active in schoolrooms thus increasing air turbulence. Although not expected, we also found high levels of dust mites in UG classrooms with hardF.
Levels of cat allergen, a tenacious substance, were higher in carpeted classrooms in Detroit and Houston, although these differences were not seen in Birmingham. While cat ownership is unknown for individuals in our sites, it is notable that cat allergen was present significantly in our schoolrooms despite low cat ownership among minority populations similar to this study’s sites. Fel d 1 levels, while relatively low (median range about 20–400 ng/g) in our study, were higher than the levels found in dust in home studies.9
In the present study, detectable cockroach allergen levels (Bla g 2) were found in all study sites and in all schoolrooms sampled in the fall and spring with no geographic difference in the fall. In spring, however, greater levels of Bla g 2 were found in the cafeteria in Houston and in the libraries and carpeted UG classrooms in Birmingham. Factors favoring seasonal variation of cockroach infestation may be multiple, although it is likely that the warm moist environments of Houston and Birmingham in spring are more conducive to cockroach population than those in Detroit. The Inner City Asthma Study, involving 8 centers and 937 children, found cockroach allergen to be a significant factor in house-dust samples and to be related to asthma morbidity.10
High levels of allergen were found in many of the schoolrooms, with some sites exceeding sensitization threshold levels. Dust mite levels were higher in Birmingham and Houston, especially in schoolrooms with carpet. Fel d 1 was found at higher levels in Birmingham schoolrooms in the fall, and Bla g 2 was higher, as expected, in cafeteria schoolrooms, where food reservoirs are present. Sensitization threshold levels were rarely exceeded in Detroit, although threshold levels were exceeded in all types of Birmingham schoolrooms and in most Houston schoolrooms.
While the allergen exposure time in children’s homes and its relationship to allergic respiratory disease has been well documented, children’s allergen exposure time in school environments and its potential effects have had less examination. Time spent in the school setting differs from time spent in homes in that children’s daily activities in the school vary with levels of activity and the amount of time spent in each type of the schoolroom (limited time in cafeteria and library and varying activity in classrooms). Further studies are needed to examine potential additive effects of allergen exposures in schools and to evaluate what impact interventions to reduce allergen load may have on children’s asthma outcomes.
Footnotes
This study was supported by National Heart, Lung, and Blood Institute, Interventions to Improve Asthma Management/Intervention, W. C. Bailey PI (HR56077), N.M.C. PI (HR56078) and L.K.B. PI (HR56079).
Contributor Information
Stuart L. Abramson, Associate Professor of Pediatrics and Immunology (abramson@bcm.tmc.edu), Baylor College of Medicine, Houston TX 77037, and Texas Children’s Hospital, 6621 Fannin St, Suite FC330.01, Houston, TX 77030.
Anne Turner-Henson, Professor (turnhena@uab.edu), UAB School of Nursing, 1530 3rd Avenue South, Birmingham, AL 35294.
Lise Anderson, Project Associate (lisand@umich.edu), Obstetrics and Gynecology, University of Michigan School of Public Health, L4000 Womens 0276, Ann Arbor, MI 48109.
Mary P. Hemstreet, Professor Emeritus (mphmd@aol.com).
Shenghui Tang, Research Associate (shenghuitang@fda.hhs.gov), UAB School of Medicine, 1530 3rd Avenue South, Birmingham, AL 35294.
L. Kay Bartholomew, Associate Professor ( leona.k.bartholomew@uth.tmc.edu), School of Public Health, University of Texas at Houston, 7000 Fannin, Houston, TX 77030.
Christine L.M. Joseph, Senior Epidemiologist (cjoseph1@hfhs.org), Department of Epidemiology and Research Biostatistics, Henry Ford Health System, 1 Ford Place. Suite 3E, Detroit, MI 48202.
Shellie Tyrrell, Health Behavior Research Consultant (shelltyrrell@aol.com), formerly at University of Texas at Houston School of Public Health, 228 Alta Street, Salt Lake City, UT 84103.
Noreen M. Clark, Professor (nmclark@umich.edu), University of Michigan School of Public Health, SPH Dean’s Office, 3520 SPH I 2029, Ann Arbor, MI 48109; and.
Dennis Ownby, Professor (downby@mcg.edu), Medical College of Georgia School of Medicine, Section of Allergy, BG 1019, 1120 15th Street, Augusta, GA 30912, Texas Children’s Hospital, 6621 Fannin St Suite FC330.01, Houston, TX 77030..
References
- 1.Institute of Medicine, Committee on the Assessment of Asthma and Indoor Air, Division of Health Promotion and Disease Prevention. Clearing the Air: Asthma and Indoor Air Exposures. Washington, DC: National Academy Press; 2000. [Google Scholar]
- 2.Munir AK, Einarsson R, Schou C, Dreborg SK. Allergens in school dust: 1. The amount of major cat (Fel d 1) and dog (Can f 1) allergens in dust from Swedish schools is high enough to probably cause perennial symptoms in most children with asthma who are sensitized to cat and dog. J Allergy Clin Immunol. 1993;91(5):1067–1074. doi: 10.1016/0091-6749(93)90221-z. [DOI] [PubMed] [Google Scholar]
- 3.Patchett K, Lewis S, Crane J, Fitzharris P. Cat allergen (Fel d 1) levels on school children’s clothing in primary school classrooms in Wellington, New Zealand. J Allergy Clin Immunol. 1997;100(6 pt 1):755–759. doi: 10.1016/s0091-6749(97)70269-0. [DOI] [PubMed] [Google Scholar]
- 4.Sarpong SB, Wood RA, Karrison T, Eggleston PA. Cockroach allergen (Bla g 1) in school dust. J Allergy Clin Immunol. 1997;99(4):486–492. doi: 10.1016/s0091-6749(97)70074-5. [DOI] [PubMed] [Google Scholar]
- 5.Peterson EL, Ownby DR, Kallenbach L, Johnson CC. Evaluation of air and dust sampling schemes for Fel d 1, Der f 1, and Der p 1 allergens in homes in the Detroit area. J Allergy Clin Immunol. 1999;104(2 pt 1):348–355. doi: 10.1016/s0091-6749(99)70378-7. [DOI] [PubMed] [Google Scholar]
- 6.Pope AM, Patterson R, Burge A, editors. Committee on the Health Effects of Indoor Allergens, National Research Council, National Academy Press; Washington, DC: 1993. Indoor Allergens: Assessing and Controlling Adverse Health Effects. [PubMed] [Google Scholar]
- 7.Arlian LG, Bernstein H, Bernstein IL, et al. Prevalence of dust mites in the home of people with asthma living in eight different geographic areas of the United States. J Allergy Clin Immunol. 1992;90(3 pt 1):292–300. doi: 10.1016/s0091-6749(05)80006-5. [DOI] [PubMed] [Google Scholar]
- 8.Wickman M, Nordvall SL, Pershagen G, Sundell J, Schwartz B. House dust mite sensitization in children and residential characteristics in a temperate region. J Allergy Clin Immunol. 1991;88(1):89–95. doi: 10.1016/0091-6749(91)90305-8. [DOI] [PubMed] [Google Scholar]
- 9.Almqvist C, Larsson PH, Egmar AC, Hedren M, Malmberg P, Wickman M. School as a risk environment for children allergic to cats, and a site for transfer of cat allergen to homes. J Allergy Clin Immunol. 1999;103(6):1002–1004. doi: 10.1016/s0091-6749(99)70172-7. [DOI] [PubMed] [Google Scholar]
- 10.Gruchalla RS, Pongracic J, Plaut M, Evans R, III, et al. Inner City Asthma Study: relationships among sensitivity, allergen exposure, and asthma morbidity. J Allergy Clin Immunol. 2005;115(3):478–485. doi: 10.1016/j.jaci.2004.12.006. [DOI] [PubMed] [Google Scholar]