Abstract
Nondestructive method of measuring soluble solids content (SSC) of citrus fruits was developed using Fourier transform near infrared reflectance (FT-NIR) measurements collected through optics fiber. The models describing the relationship between SSC and the NIR spectra of citrus fruits were developed and evaluated. Different spectra correction algorithms (standard normal variate (SNV), multiplicative signal correction (MSC)) were used in this study. The relationship between laboratory SSC and FT-NIR spectra of citrus fruits was analyzed via principle component regression (PCR) and partial least squares (PLS) regression method. Models based on the different spectral ranges were compared in this research. The first derivative and second derivative were applied to all spectra to reduce the effects of sample size, light scattering, instrument noise, etc. Different baseline correction methods were applied to improve the spectral data quality. Among them the second derivative method after baseline correction produced best noise removing capability and yielded optimal calibration models. A total of 170 NIR spectra were acquired; 135 NIR spectra were used to develop the calibration model; the remaining spectra were used to validate the model. The developed PLS model describing the relationship between SSC and NIR reflectance spectra could predict SSC of 35 samples with correlation coefficient of 0.995 and RMSEP of 0.79 °Brix.
Keywords: FT-NIR spectroscopy, Soluble solids content, Intact citrus, Partial least squares analysis, Reflectance mode
INTRODUCTION
Soluble solids content (SSC) is a major characteristic used for assessing citrus fruit quality. Near-infrared spectroscopy (NIRS) has been used as a rapid and nondestructive technique for determining the soluble solids content of fruit. Kawano et al.(1992) measured sugar content of peaches in the wavelength region of 680~1235 nm. Their experiments indicated good correlation between the NIR spectra and the sugar content (r=0.97, SEP=0.05 °Brix). Slaughter (1995) developed calibration models to predict SSC (r=0.92, SEP=1.0 °Brix), sucrose content (r=0.87, SEP=0.58 °Brix), sorbitol content (r=0.88, SEP=0.23 °Brix) of intact peaches and nectarines in the wavelength range of 400~1000 nm. Lammertyn et al.(1998) examined the prediction capacity of the quality characteristics of soluble solid content of Jonagold apples with a wavelength range between 380 and 1650 nm. The SEP of the PLS (partial last square) models for SSC was 0.26 °Brix. Chang et al.(1998) used near infrared spectroscopy (from 1000 nm to 2500 nm) to determine the sugar content in the juice and flesh of cantaloupe. Peiris et al.(1999) established a relationship between the reflectance spectra (800~1650 nm) and SSC of Jonagold apples by means of the PLS technique and obtained the correlation of 79%~91%. Chen and Shaw (1999) detected the sugar content of “Sinwater” pears and “New-century” pears by using a portable near-infrared spectrophotometer in the wavelength range of 950 nm to 1650 nm. Their experimental results indicated that the calibration curve with PLS models and second difference treatment had a 0.92 correlation coefficient with a 0.48 °Brix SEC (standard error of calibration) and a 0.49 °Brix SEP. Lu (2001) evaluated the potential of NIR reflectance (800~1700 nm) for measurement of sugar content (r=0.97, SEP=0.71~0.65 °Brix) of sweet cherries. Lu and Ariana (2002) investigated an NIR sensing technique in interactance mode for rapid acquisition of spectral information in the spectral region between 900 nm and 1500 nm to predict the sugar content of two apple cultivars. The correlation coefficients of prediction for sugar content were equal to, or greater than, 0.81 and prediction errors were between 0.5% and 0.7% for the two cultivars. Slaughter et al.(2003) investigated a nondestructive optical method based upon near infrared spectrophotometric techniques for determining SSC of fresh whole prune. The results of SSC prediction were: r 2=0.96, SEP=1.02 °Brix. Liu et al.(2004) and Ying et al.(2004) discussed three different kinds of mathematical treatments (original, first derivative and second derivative) in range of 800~2500 nm to detect the sugar content of apples.
Current applications of NIR spectroscopy in agriculture product and food processing include quantitative determinations in a wide range of products. However, little work has been done on analyses of intact citrus fruits. The use of FT-NIR spectroscopy in SSC estimation of intact citrus fruits is described in this article.
The objectives of this study were: (1) to estimate SSC of citrus by FT-NIR spectroscopy; (2) to establish relationships between the FT-NIR measurements and SSC; (3) to compare the prediction performance of calibration models with different calibration techniques; (4) to find the optimal wavelength range for developing the best calibration models.
MATERIALS AND METHODS
Immediately after spectrum acquisition, the soluble solids content of citrus samples was measured for validating nondestructive NIR reflectance (800~ 2500 nm) spectroscopic method, and models for predicting SSC quality of citrus fruits were developed by using PLS and PCR (principle component regression) methods. A piece of citrus flesh was removed from the location of the NIR measurement. The juice from this sample was squeezed directly onto a refractometer (Atago Co., PR-1 Brix-Meter, Tokyo, Japan) with hand and the °Brix data were recorded.
Materials
‘Gannan’ citrus used in the experiments were bought in May 2005 from the commercial fruit market in Hangzhou, Zhejiang. Morphological properties of ‘Gannan’ citrus samples were shown in Table 1. The citrus were packed in cartons and stored at 0 °C until the experiments were conducted. All citrus were examined again and defective citrus such as those showing wormhole, bruise and chilling injury, were eliminated. A total of 170 ‘Gannan’ citrus were used for the experiments. For model development, all samples were divided into two groups, 135 citrus were used for calibration and the other 35 citrus were used for validation.
Table 1.
Morphological properties of ‘Gannan’ citrus (n=170)
| Min. | Max. | Mean | SD | |
| Diameter (mm) | 33.25 | 42.54 | 37.66 | 0.21 |
| Height (mm) | 29.18 | 40.27 | 34.52 | 0.67 |
| Weight (g) | 56.30 | 82.50 | 70.60 | 3.16 |
Reflectance measurement
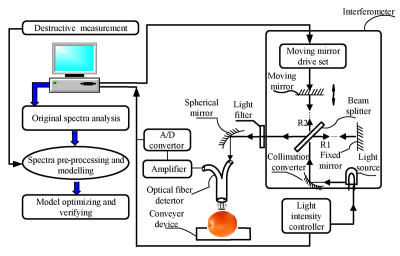
NIR spectra were acquired by using a commercial FT-NIR spectrometer (Nexus FT-NIR spectrometer, Thermo Nicolet Co., USA). The FT-NIR spectrometer was equipped with an interferometer, an InGaAs detector, and a wide band light source (Quartz Tungsten Halogen, 50 W). The detector can detect the spectral signals in a spectral range of 800~2500 nm. Samples were analyzed at room temperature (approximately 22~24 °C) without any previous sample treatment. The measurement was expressed as log(1/R). The experimental parameters used to obtain enough sensitivity in measuring the reflectance spectra of citrus samples by the FT-NIR spectrometer are shown in Table 2. The schematic of FT-NIR detecting system is shown in Fig.1.
Table 2.
Experimental setup of the FT-NIR spectrometer
| Parameters | Value |
| Spectral range (cm−1) | 12500~4000 |
| Sampling interval (cm−1) | 2.0 |
| Scan number (times) | 64 |
| Resolution (cm−1) | 16 |
| Mirror velocity (cm/s) | 0.9494 |
| Aperture size (μm) | 16 |
Fig. 1.
Schematic of spectra detecting system
The reflectance spectra were measured at one location on each citrus. These locations were marked for SSC measurements later. The signals accumulated by 64 repetitive scans were averaged and then transformed to absorption, log(1/R), to create one spectrum per measurement at wavelength interval of 2 cm−1. A white Teflon block was used as a reference for reflectance measurements. A reference spectrum was collected and stored before citrus samples were measured.
Soluble solids measurement
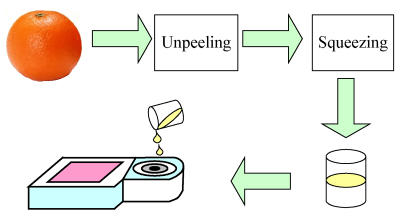
A digital refractometer (Atago Co., PR-1 Brix-Meter, Tokyo, Japan) was used for citrus SSC measurement. The juice that exuded from the position of spectrum collection was used for measurement, as shown in Fig.2.
Fig. 2.
Schematic of SSC measurement process
Multivariate data analysis
1. Region selection
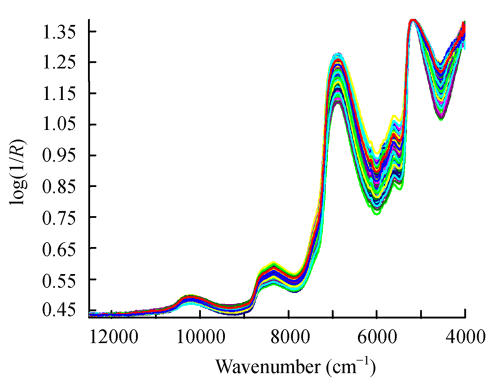
The selection of the portion of the spectra to be used in calibration is crucial and determines the quality of the model. Wavenumbers below 4500 cm−1 were discarded due to the insensitivity of the InGaAs detector, where the intensity spectrum drops drastically and the reflectance spectrum becomes noisy, as shown in Fig.3.
Fig. 3.
Original reflectance spectra of 170 ‘Gannan’ citrus samples
2. Spectral correction
In this study, three types of path length correction algorithm were used in this work. The first correction scheme assumes that the path length is a fixed pathlength. The standard normal variate (SNV) is another approach to be used (Antti, 1999). This algorithm removes the scattering by normalizing each spectrum by the standard deviation of the responses across the entire spectral range. Multiplicative scatter correction (also known as multiplicative signal correction (MSC)) was also used. This technique (commonly used in chemometrics) regresses a measured spectrum against a reference spectrum and corrects the former using its slope. In this work, the mean spectra of the calibration set were used as the reference spectra. The three algorithms were programmed in the TQ Analyst v6.2.1 (Thermo Nicolet Co., USA).
3. Regression method
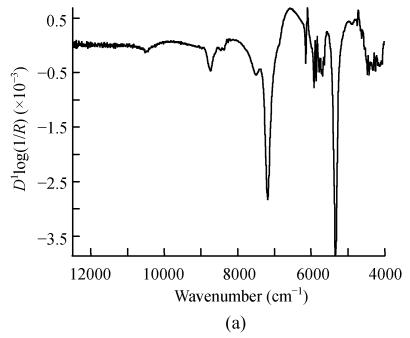
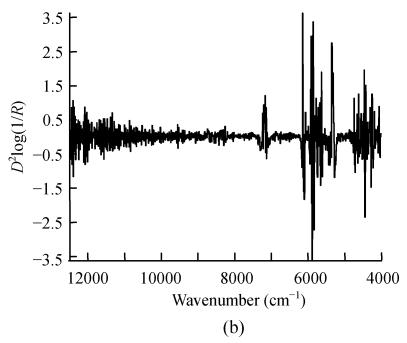
The commercial software package, TQ Analyst v6.2.1, was used for processing the spectral data and developing determination models for the calibration and validation parts of the sample dataset. Preprocessed spectral data such as the first derivative of log(1/R) and its second derivative were analyzed for PLS and PCR. Typical spectra of log(1/R), D 1log(1/R) and D 2log(1/R) are presented in Fig.4. Models formulated the relationship between the NIR spectra to the SSC in each fresh juice sample.
Fig. 4.
Typical citrus sample spectra of (a) D 1log(1/R) and (b) D 2log (1/R) between 12500 and 5000 cm−1
In this study, the quality of the model was quantified by the root mean square error of calibration (RMSEC), the root mean square error of prediction (RMSEP) and the correlation coefficient (r 2) between the predicted and measured values. A good model should have a low RMSEC, a low RMSEP and a high r 2 value, but also a small difference between RMSEC and RMSEP. The RMSEC and RMSEP are calculated as follows:
 , ,
|
 , ,
|
with ŷi=predicted value of the ith sample; yi=measured value of the ith sample; I c=number of samples in calibration set; I p=number of samples in prediction set, and
 . .
|
RESULTS AND DISCUSSION
Samples composition
Summary distributional statistics for calibration and validation dataset are shown in Table 3. Any interpretation of calibration results depends greatly on the precision of the determined chemical composition of the samples. The SSC of citrus fruits varied from 8.8 °Brix to 16.6 °Brix, with 13.1 °Brix for the mean SSC and 1.71 °Brix for the standard deviations (SD). The SSC measurements (n=170) were fairly normally distributed around the mean (max=16.6 °Brix, min=8.8 °Brix). The determination values of samples SSC cover a large enough range, which is helpful for developing models.
Table 3.
Statistic values of calibration and prediction sets for SSC value
| Sample sets | Samples | Min. | Max. | Mean | SD |
| Samples | 170 | 8.8 | 16.6 | 13.10 | 1.71 |
| Calibration | 135 | 8.8 | 16.6 | 12.95 | 1.64 |
| Prediction | 35 | 9.0 | 16.0 | 13.21 | 1.73 |
Spectral correction for calibration models
Among the samples analyzed for the SSC parameter, 135 samples were selected for calibration by TQ v6.2.1 quantitative software, and the remaining samples were used for validation.
In this work, three types of pathlength correction algorithm were used. The results of PLS regression calibration models for log(1/R) using different spectral correction are presented in Table 4. It is obvious that different spectral correction is not useful for improving the quality of models, which is due to juice samples being transparent liquid without light scattering to affect the path length.
Table 4.
Results PLS regression methods for D 1log(1/R) using different spectral correction in the wavelength range of 12500~4000 cm−1
| Spectral correction | No. of factors | r | RMSEC | RMSEP |
| MSC | 8 | 0.995 | 0.174 | 0.390 |
| SNV | 9 | 0.995 | 0.172 | 0.392 |
| Constant | 9 | 0.996 | 0.148 | 0.408 |
Statistical calibration models
It is desirable for a model to have a low error of calibration, with as few factors as possible. The selection of calibration models based on this criterion, with the total described variance considered to be appropriate (about 90%), was conducted by means of the TQ v6.2.1 software. The results for the selected calibration models of PLS and PCR for the log(1/R), D 1log(1/R), and D 2 log(1/R), are presented in Table 5.
Table 5.
Results of PLS regression and PCR methods calibration models for the log(1/R), D 1log(1/R), and D 2log(1/R) with full spectral range
| Methods | Statistical parameter | Spectrum |
||
| log(1/R) | D1log(1/R) | D2log(1/R) | ||
| PLS | Factors (n) | 4 | 8 | 1 |
| r2 | 0.755 | 0.995 | 0.621 | |
| RMSEC | 1.140 | 0.174 | 1.370 | |
| PCR | PCs (n) | 3 | 3 | 3 |
| r2 | 0.657 | 0.541 | 0.514 | |
| RMSEC | 1.310 | 1.470 | 1.490 | |
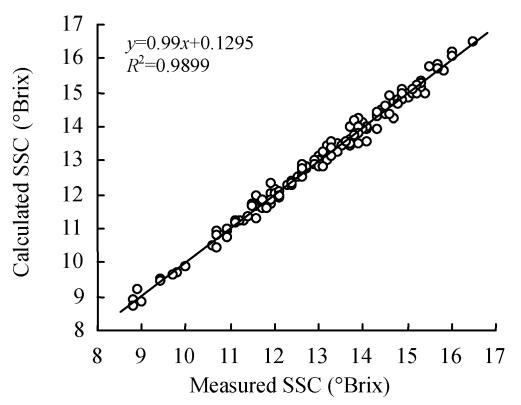
It is obvious that the PLS method produces the best calibration results using D 1log(1/R) for SSC. An example of the calibration results of SSC by the FT-NIR versus laboratory measurements is represented in Fig.5, where the ordinate and abscissa axes represent the measured and the fitted values of the appropriate parameters, respectively. But PCR models seem to produce a poor RMSEC.
Fig. 5.
Calibrations of PLS by the FT-NIR system versus laboratory measurements of SSC of intact citrus samples
Statistical prediction analysis
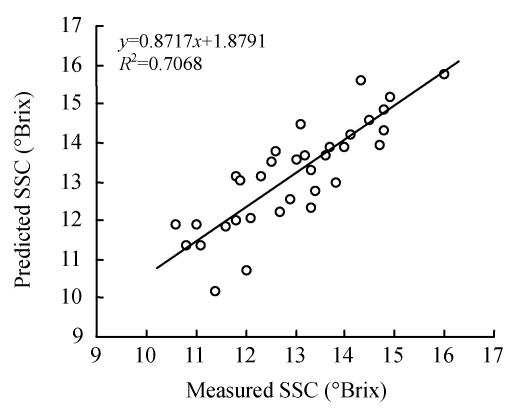
The RMSEP represents the sensitivity of prediction. The results of these predictions are presented in Table 6. In contrast, PCR results indicate that the PLS method is preferable. PLS prediction results for SSC are presented in scatter plots (Fig.6). The correlation between the measured and predicted values of the parameters is high for SSC.
Table 6.
Results for prediction errors of PLS regression method for the log(1/R), based on about 30% of the dataset, for SSC parameter
| Methods | Statistical parameter | Spectrum |
||
| log(1/R) | D1log(1/R) | D2log(1/R) | ||
| PLS | Factors (n) | 4 | 8 | 1 |
| r2 | 0.755 | 0.995 | 0.621 | |
| RMSEP | 0.798 | 0.790 | 1.080 | |
| PCR | PCs (n) | 3 | 4 | 1 |
| r2 | 0.682 | 0.711 | 0.325 | |
| RMSEP | 1.052 | 1.218 | 1.089 | |
Fig. 6.
Predictions of PLS by the FT-NIR system versus laboratory measurements of SSC of intact citrus samples
CONCLUSION
Near infrared reflectance was used to estimate the SSC in citrus fruit from 800 nm to 2500 nm. This research established a technique, based on FT-NIR spectroscopy, for non-destructively estimating SSC of intact citrus fruit.
By means of multivariate calibration techniques (PLS and PCR), relationships were established between reflectance spectra and SSC parameter of citrus fruit. The first derivative spectra with PLS were found to provide the best prediction of the SSC of intact citrus fruit with a RMSEP of 0.790 and correlation coefficient (r) of 0.995. The non-destructive FT-NIR measurements provided good estimation of the SSC index of citrus fruit. The predicted values were highly correlated with destructively measured values of SSC. The method will be valuable whenever a large number of samples needs to be rapidly analyzed.
Footnotes
Project supported by New Century Excellent Talents in University (No. NCET-04-0524), and the Research Fund for the Doctoral Program of Higher Education (No. 20030335060) of China
References
- 1.Antti H. Multivariate Characterization of Wood Related Materials. Umea, Sweden: University of Umea; 1999. Ph.D. Thesis. [Google Scholar]
- 2.Chang W, Chen S, Guo L. Determination of sugar content in cantaloupe (II) near infrared spectroscopy. Journal of Agricultural Machinery. 1998;7(1):87–98. [Google Scholar]
- 3.Chen C, Shaw J. Determination of the sugar content and acidity of pears by a portable near-infrared spectrophotometer. Journal of Agricultural Machinery. 1999;8(1):49–57. [Google Scholar]
- 4.Kawano S, Sato T, Iwamoto M. Determination of Sugars in Satsuma Orange Using NIR Transmittance. In: Murray I, editor. Proceedings of the Fourth International Conference on NIR Spectroscopy; Aberdeen, Scotland: School of Agriculture; 1992. [Google Scholar]
- 5.Lammertyn J, Nicolay B, Ooms K, de Semedt V, de Baerdemaeker J. Non-destructive measurement of acidity, soluble solids and firmness of Jonagold apples using NIR-spectroscopy. Transactions of the ASAE. 1998;41(4):1089–1094. [Google Scholar]
- 6.Liu Y, Ying Y, Chen Z, et al. Application of Near Infrared Spectroscopy with Fiber Optics for Detecting Interior Quality in Peaches; Proceedings of SPIE—The International Society for Optical Engineering, V5271: Monitoring Food Safety, Agriculture, and Plant Health; Boston, USA. 2004. pp. 347–355. [Google Scholar]
- 7.Lu R. Predicting firmness and sugar content of sweet cherries using near-infrared diffuse reflectance spectroscopy. Transactions of the ASAE. 2001;44(5):1265–1271. [Google Scholar]
- 8.Lu R, Ariana DA. Near-infrared sensing technique for measuring internal quality of apple fruit. Applied Engineering in Agriculture. 2002;18(5):585–590. [Google Scholar]
- 9.Peiris KHS, Dull GG, Leffler RG, Kays SJ. Spatial variability of soluble solids or dry-matter content within individual fruits, bulbs, or tubers: implications for the development and use of NIR spectrometric techniques. HortScience. 1999;34(1):114–118. [Google Scholar]
- 10.Slaughter DC. Nondestructive determination of internal quality in peaches and nectarines. Transactions of the ASAE. 1995;38(2):617–623. [Google Scholar]
- 11.Slaughter DC, Thompson JF, Tan ES. Nondestructive determination of total and soluble solids in fresh prune using near infrared spectroscopy. Postharvest Biology and Technology. 2003;28(3):437–444. doi: 10.1016/S0925-5214(02)00204-1. [DOI] [Google Scholar]
- 12.Ying Y, Liu Y, Wang J, et al. Non-Destructive Measurement of Sugar Content in Fuji Apple with Bifurcated Fiber Optic Sensor; Proceedings of SPIE—The International Society for Optical Engineering, V5272: Industrial and Highway Sensors Technology; Boston, USA. 2004. pp. 263–272. [Google Scholar]


