Abstract
Despite numerous experiments and static electronic structure calculations, the nature of hydrated-electron clusters, (H2O)n−, remains poorly understood. Here, we introduce a hybrid ab initio molecular dynamics scheme, balancing accuracy against feasibility, to simulate vibrational and photoelectron spectra of (H2O)n−, treating all electrons quantum-mechanically. This methodology provides a computational tool for understanding the spectra of weakly bound and supramolecular anions and for elucidating the fingerprint of dynamics in these spectra. Simulations of (H2O)4− provide quantitative agreement with experimental spectra and furnish direct evidence of the nonequilibrium nature of the cluster ensemble that is probed experimentally. The simulations also provide an estimate of the cluster temperature (T ≈ 150–200 K) that is not available from experiment alone. The “double acceptor” electron-binding motif is found to be highly stable with respect to thermal fluctuations, even at T = 300 K, whereas the extra electron stabilizes what would otherwise be unfavorable water configurations.
Keywords: ab initio molecular dynamics, hydrated electron, photoelectron spectroscopy
The hydrated electron (1), eaq−, is an important intermediate in the chemistry of aqueous systems exposed to ionizing radiation, including water droplets in the upper atmosphere, nuclear fission reactors, radioactive waste, and, upon irradiation, living tissue. Anionic water clusters undergo the same electron-scavenging reactions as does the aqueous electron (2) and provide a means for studying stepwise evolution toward eaq−. Vertical electron-binding energies (VEBEs) have been measured, by photoelectron spectroscopy, for all (H2O)n− clusters with n = 2–11 and many larger clusters (3–6). As n increases, the dominant feature in these spectra shifts to higher energy, but this otherwise smooth evolution is interrupted at n = 4 by an abrupt jump to much higher energy, which has been interpreted as the onset of a common structural motif among the n = 4–11 clusters (5). Here, we study (H2O)4− as a representative example (7–9) of this electron-binding motif.
Vibrational spectra (7–10) for small hydrated-electron clusters (n ≤ 6) reveal an electron-binding motif thought to be inconsistent with the spectral signatures of e− in bulk water (11, 12), suggesting that the manner in which water networks bind an extra electron changes qualitatively as a function of cluster size. Vibrational (7–10, 13, 14), electronic (15–18), and photoelectron (3–6) spectra of size-selected (H2O)n− clusters have been measured across a wide range of n but are difficult to interpret in the absence of detailed calculations. For n > 6, the vibrational spectra have not yet been assigned to particular isomers and probably include contributions from multiple isomers, because these clusters are likely to possess significant internal energy (19, 20). An estimate of this internal energy is essential to interpreting the spectra, because clusters are prone to exhibit multiple isomers with similar energies and there exists both experimental (6) and computational (21) evidence of temperature dependence in the electron-binding motif. In this work, we report an attempt to characterize the internal energy of a cluster by using ab initio molecular dynamics simulations (22, 23) in which the atoms are propagated according to classical mechanics, with forces computed on the fly by solving the quantum-mechanical all-electron problem at each molecular dynamics time step.
Vibrational spectra of (H2O)n− isomers reveal vibrational redshifts (relative to neutral water) of up to 300 cm−1 in the O–H stretching region, (7–10, 13), suggesting substantial penetration of the excess electron into the water network (24). This penetration, in turn, suggests that many-electron quantum mechanics may be necessary for a correct description of the unpaired electron in (H2O)n−. Previous studies have established that electron correlation (as opposed to mean-field electrostatics) is often responsible for most of the VEBE in weakly bound anions, (25, 26) but the fact that electron correlation is important does not mean that correlation effects are strong. We have demonstrated previously (27) that the most important correlations are captured by a second-order perturbative treatment [second-order Møller-Plesset perturbation theory (MP2)], and here we show that modest levels of ab initio electronic structure theory can account quantitatively for the features of both vibrational and photoelectron spectra of (H2O)n− clusters.
Results and Discussion
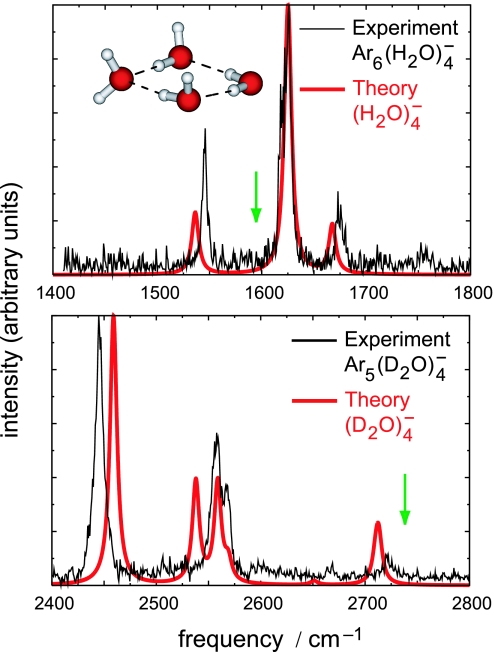
Fig. 1 juxtaposes experimental vibrational spectra (7, 9) for Ar6(H2O)4− and Ar5(D2O)4− with calculated spectra for bare (H2O)4− and (D2O)4−, obtained by using density functional theory (DFT). The excellent agreement between theory and experiment is evidence that, even in the case of weakly bound anions, DFT can accurately predict properties such as geometries and vibrational frequencies that depend on a single electronic potential surface. DFT methods are also affordable enough that trajectory simulations using DFT forces have become fairly common (22). However, DFT methods significantly overestimate VEBEs for weakly bound anions (28), and our simulations therefore use a hybrid methodology, in which relatively inexpensive DFT calculations are used to propagate trajectories on the (H2O)n− potential surface, whereas more accurate MP2 calculations are used to obtain the time-dependent VEBE along each trajectory. To put the computational costs into perspective, note that calculation of a single 500-fs trajectory for (H2O)n− using DFT forces requires 19 h of computer time, followed by an additional 5 h to calculate VEBE(t) at the MP2 level in intervals of 2 fs. Calculation of VEBE(t) at the coupled-cluster singles and doubles with noniterative triples [CCSD(T)] level, which many previous studies have established as quantitatively reliable for VEBE predictions, (26, 29, 30) requires 61 days of computer time for the same 500-fs trajectory.
Fig. 1.
Experimental (7, 9) and calculated vibrational spectra for (H2O)4− in the H–O–H bend region and for (D2O)4− in the O–D stretch region. Harmonic frequencies were computed at the B3LYP/aug3-cc-pVDZ level (28) and scaled by factors that reproduce the H–O–H bend and O–D symmetric stretch frequencies in H2O and D2O (green arrows) at the same level of theory, then broadened with 8-cm−1 Lorentzians. Ar atoms present in the experimental spectra perturb peak positions by an estimated 0.4 cm−1 per Ar atom (8).
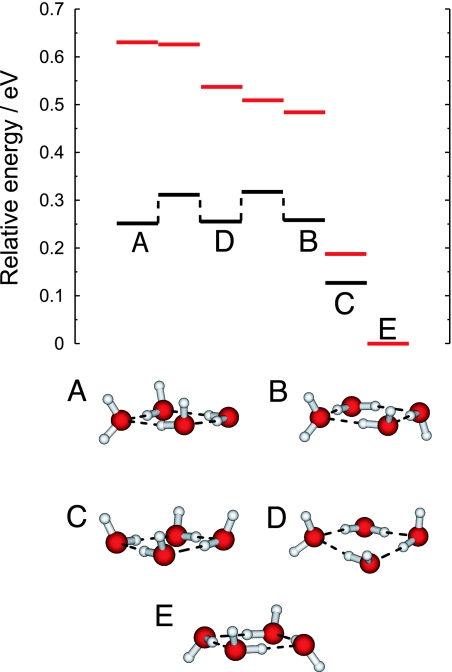
A sketch of the potential energy surface for (H2O)4− is shown in Fig. 2. Isomers A–C were assigned in the original experimental report of the photoelectron spectrum (5), a portion of which appears in Fig. 3 and is discussed below. The dominant peak was assigned to isomer A and the low-energy shoulder was assigned to isomer B, although we subsequently pointed out (28) that the latter assignment is ambiguous, as the nearly iso-energetic isomer D (which differs from B only by flipping one hydrogen to the other side of the ring) has a VEBE quite similar to B. Isomers A, B, and D are each examples of the so-called double hydrogen-bond acceptor (AA) electron-binding motif, in which the excess electron is localized near two hydrogen atoms belonging to the same AA-type water molecule, as illustrated in Fig. 4a.
Fig. 2.
Partial sketch of the potential surface for (H2O)4 (red lines) and (H2O)4− (black lines). Isomers A–D are local minima on the (H2O)4− potential surface, and the energies of (H2O)4 are shown at the optimized anion geometries. Isomer E is the global minimum on the (H2O)4 potential surface and does not bind an electron. Geometries were optimized at the B3LYP/6-31(1+,3+)G* level (27, 28), and single-point energies were computed at the CCSD(T)/6-31(1+,3+)G* level.
Fig. 3.
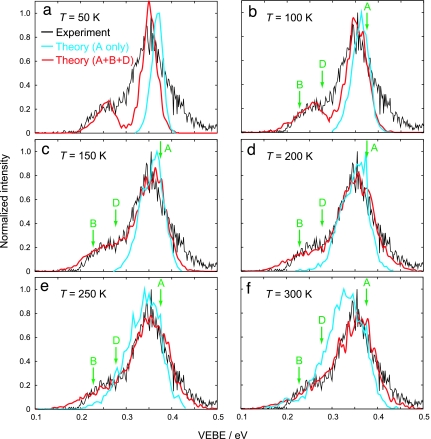
Experimental (5) photoelectron spectrum (black lines) and simulated spectra (colored lines) for (H2O)4−. (A low-intensity feature at 0.06 eV in the experimental spectrum, corresponding to isomer C, is not shown.) Shown in blue are spectra for isomer A only, in which the MP2/6-31(1+,3+)G* VEBEs are blueshifted by 0.031 eV, corresponding to the difference between MP2 and CCSD(T) VEBEs. Initial velocities for these trajectories are sampled from a Maxwell-Boltzmann (MB) distribution of rigid monomer rotations and translations, with no initial intramolecular velocity. Shown in red are spectra simulated for isomers A, B, and D, where the initial velocities were sampled from a MB distribution of nuclear velocities, and the resulting isomeric spectra are fit to experiment by using the model described in the text. Green arrows show the VEBEs calculated at the minimum-energy geometry of each isomer.
Fig. 4.
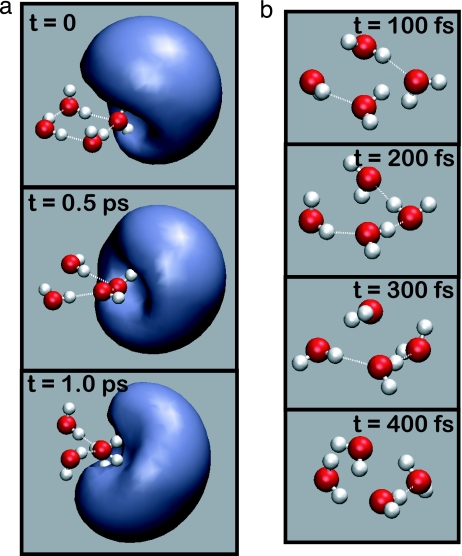
Snapshots from ab initio molecular dynamics simulations. (a) Snapshots of the singly occupied molecular orbital dynamics as a function of time, for isomer A of (H2O)4− at 300 K. (b) Snapshots from the (H2O)4 trajectory, after electron detachment from a at t = 0.
The structures depicted for isomers A–D in Fig. 2 are optimized geometries of the anionic cluster, but Fig. 2 also indicates the energy of each neutral cluster at the same geometry. (The difference in neutral and anion energies at the same geometry defines the VEBE.) This partial sketch of the (H2O)4− and (H2O)4 potential surfaces illustrates several important features that are shared generally by small (H2O)n− clusters (n = 4–6), and probably by larger clusters as well. First, the anionic clusters exhibit multiple isomers that are essentially iso-energetic, but whose VEBEs are different enough to be resolved experimentally, which is the case for isomers A, B, and D of (H2O)4−. Of these, isomer A exhibits the largest VEBE, not because it is intrinsically more stable as an anion, but because the corresponding neutral cluster is less stable, as compared with the neutral analogues of B and D. Electron detachment from the stable anionic clusters probes an unstable portion of the (H2O)4 potential surface, thus amplifying the energetic consequences of small geometrical distortions.
Another general feature of e− hydration in small clusters is that water configurations similar to the global potential minimum of (H2O)n bind an electron only very weakly, if at all. In the case of (H2O)4, the global minimum (isomer E in Fig. 2) does not bind an electron at all, whereas the closely related isomer C has an experimental VEBE of only 0.06 eV and an extremely weak photoelectron intensity (5), despite being the lowest-energy isomer of (H2O)4−. (Because the isomer C feature is well separated from the rest of the spectrum, this isomer is not included in our simulations.) In contrast, isomers A, B, and D bind the electron strongly and appear as intense features in the photoelectron spectrum, even though they are higher in energy than isomer C, and the corresponding neutral water configurations are highly unstable. Thus, it is immediately clear that the experimental photoelectron spectrum for (H2O)4− is inconsistent with an equilibrium distribution of either the neutral or the anionic tetramer clusters.
Calculations on various (H2O)20 and (H2O)24 isomers and their anions suggest some generality to these observations (28, 27). In these clusters, isomers with large VEBEs (>1.0 eV, consistent with the experimental VEBE for clusters in this size regime) have so far been located only for structures involving significant distortion away from geometries that are stable on the neutral potential surface. Stable neutral isomers have thus far been found to possess only weakly bound anions. Monte Carlo simulations of (H2O)13−, using an electron–water pseudopotential, also suggest that experimental photoelectron spectra are inconsistent with an equilibrium cluster distribution (31).
Because we solve the quantum-mechanical all-electron problem at each molecular dynamics time step, our simulations yield a singly occupied molecular orbital (SOMO) for the extra electron whose time evolution unambiguously identifies the electron-binding motif. Fig. 4a displays snapshots from a single trajectory of isomer A at T = 300 K. The dangling hydrogen atoms of the two hydrogen-bond donor–acceptor water molecules exert a mild influence that slightly perturbs the SOMO in the direction of these hydrogen atoms, but this effect is small and highly fluxional. On the whole, the SOMO (and also the electron density difference between the anionic and neutral clusters) remains localized near the AA water molecule, even at 300 K, and even in the presence of significant hydrogen-bond dynamics. None of the trajectories used in this study exhibit any change in binding motif on the time scale of 0.5–1.0 ps, indicating that the AA motif is thermally robust on vibrational time scales, even at 300 K. This finding is significant, because vibrational spectra for considerably larger clusters (up to n = 24 have been reported) are also consistent with the spectral signature of the AA binding motif (13, 14).
Upon electron detachment, however, the AA water molecule immediately begins to pinwheel and break hydrogen bonds, and within 100–200 fs the cluster has isomerized to a minimum-energy structure of (H2O)4 consisting of four donor–acceptor water molecules. Starting from the same nuclear positions and velocities as in Fig. 4a, the neutral cluster dynamics after electron detachment at t = 0 are shown in Fig. 4b. This rapid reorganization of the water network after electron detachment vividly illustrates that the extra electron stabilizes unusual water configurations.
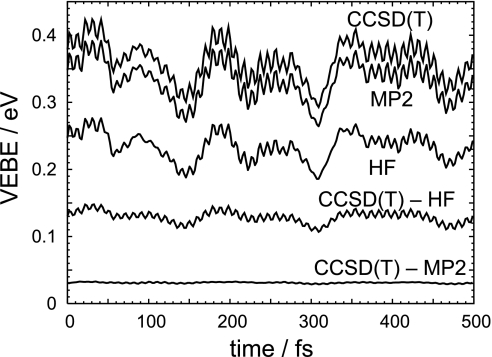
Traditionally, theoretical studies of anions have focused on calculation of VEBEs at minimum energy geometries and comparison to peaks in the photoelectron spectrum. In reality, however, VEBEs are not static quantities; they fluctuate as the molecular geometry fluctuates, and consequently photoelectron spectra for cluster anions can be quite broad (compare Fig. 3). Fig. 5 depicts the time-dependent electron binding energy, VEBE(t), for a particular trajectory of isomer A at T = 150 K. Over the course of this 500-fs trajectory, Hartree-Fock (HF) theory, which incorporates electrostatic contributions to electron binding but neglects instantaneous electron correlation, including the electron-water dispersion interaction, underestimates the VEBE by 0.129 ± 0.009 eV (1σ) relative to high-level CCSD(T) theory. This result means that the electron correlation contribution to the VEBE fluctuates by only 0.009 eV, or in other words that the effect of correlation is almost independent of geometry, at least for thermal fluctuations within a single basin on the potential surface. The difference between the MP2 and CCSD(T) results is only 0.031 ± 0.001 eV over the same trajectory, indicating that post-MP2 correlations are effectively geometry-independent. This finding implies that time-dependent VEBEs from affordable ab initio molecular dynamics simulations can be corrected easily to reproduce accurate, but prohibitively expensive, CCSD(T) results.
Fig. 5.
Time-dependent VEBE for a typical isomer A trajectory at T = 150 K, calculated at the HF, MP2, and CCSD(T) levels, with the 6-31(1+,3+)G* basis set. Also shown are differences between the CCSD(T) and the HF or MP2 result.
For trajectories confined to a single basin on the potential surface, VEBE(t) fluctuates on two distinct time scales (compare Fig. 5). Fast (≈10 fs) fluctuations originate in the O–H stretching modes on the AA water molecule, which are the most intense transitions in isomer A's vibrational spectrum. Intense infrared transitions are associated with normal modes that substantially modify the cluster dipole moment, and one might expect motion along these coordinates to affect the VEBE significantly. Indeed, we find that fluctuations in the dipole moment track fluctuations in the VEBE quite closely, on both fast and slow time scales.
The second time scale evident in Fig. 5 has a period τ ≈ 150 fs. The lowest vibrational frequency for isomer A having significant infrared intensity is the H–O–H bend on the two donor–acceptor water molecules, but at 1,625 cm−1 (τ = 21 fs), this mode is far too fast to account for the slower time scale evident in VEBE(t). Of the modes that are soft enough (ω < 220 cm−1) to be responsible for the long-wavelength VEBE fluctuations, none accounts for >2% of the total infrared intensity. We conclude that the thermal width of the photoelectron spectrum results from a collusion of low-frequency torsions and is not assignable to any one specific mode. It is therefore difficult to identify a simple reaction coordinate responsible for the spectral width; in particular, the hydrogen-flipping motion along the B → D reaction coordinate changes the VEBE by at most 0.04 eV.
Although standard electronic structure calculations (i.e., locating and characterizing stationary points on the potential energy surface and calculating the corresponding VEBEs) are often helpful in assigning the main photoelectron peak for small (H2O)n− clusters, the analysis above suggests that static calculations are of little help in explaining the details of such spectra and may be ambiguous in cases where numerous isomers exhibit similar VEBEs, as anticipated in larger clusters (28, 31).
Instead, we simulate a photoelectron spectrum for (H2O)4− by binning VEBE(t) data from ensembles of classical trajectories at temperatures ranging from 50 to 300 K. In Fig. 3, these simulated spectra are juxtaposed with the experimental spectrum. Because isomers A, B, and D are each separated by barriers of ≈0.065 eV (1.5 kcal/mol), trajectories at these temperatures do not isomerize on sub-ps time scales, which allows us to decompose the overall photoelectron intensity distribution I(E) into a linear combination of the photoelectron spectra caused by individual isomers,
Here α, δE, and the isomeric populations pi(0 ≤ pi≤ 1) are fit parameters. In Fig. 3, we present the simulated photoelectron energy distribution IA(E) for isomer A, and also the overall I(E) obtained from a fit to the experimental spectrum. The fits afford energy shifts ranging from δE = 0.018 eV at T = 50 K to δE = 0.050 eV at T = 300 K, and the shift of δE = 0.035 eV obtained at 150 K is the best match to the value of 0.031 eV that was determined by comparison of the MP2 and CCSD(T) data in Fig. 5.
Isomeric populations vary according to temperature, but typically pA ≥ 0.8, pB ≈ 0, and pD ≤ 0.2. These three isomers are essentially iso-energetic, hence the experiments do not probe a thermodynamic distribution even among the three AA isomers. The best fit of the experimental data consistently assigns pB ≈ 0, which is interesting in view of the fact that this isomer has only a slightly lower VEBE than does isomer D (0.229 eV versus 0.278 eV, at their respective minimum-energy geometries). Evidently, the thermal spread in the VEBE for isomer B cannot account for the observed shoulder in the photoelectron spectrum, a conclusion that would be impossible without ab initio molecular dynamics simulations. In fact, peak photoelectron intensity typically does not coincide with the VEBE calculated at the minimum-energy geometry, even in the case of a reasonably well resolved feature like that arising from isomer A. As Fig. 3 shows, the difference can be as large as 0.05 eV, larger than the 0.03 eV attributable to post-MP2 electron correlation effects.
An important motivation for including thermal fluctuations in VEBE calculations is the desire to quantify spectral widths as a function of temperature. For T ≤ 100 K, the simulated photoelectron spectra for isomer A are considerably narrower than the main feature in the experimental spectrum, whereas for T ≥ 250 K the simulated spectra are too wide and the low-energy shoulder on the main peak collapses into a broad tail. For T = 150–200 K, the photoelectron spectra I(E) obtained from the model (shown in red in Fig. 3) are in quantitative agreement with the experimental result.
Our classical treatment of the nuclear motion omits nuclear zero-point energy, and one might reasonably question whether a statistical distribution of the available thermal energy puts too much energy into the intermolecular degrees of freedom. To test this, we calculate a second set of photoelectron spectra for isomer A, using an alternative trajectory sampling scheme in which initial nuclear velocities are obtained by Maxwell-Boltzmann sampling of rigid-monomer rotations and translations, putting no energy whatsoever into the intramolecular stretches and bends. This prevents intramolecular zero-point energy from artificially heating up the intermolecular degrees of freedom. These spectra, shown in blue in Fig. 3 (for isomer A only), illustrate that the peak photoelectron intensity gradually shifts to lower energy as temperature increases, coming into agreement with experiment in the range of 150–200 K, the same temperature range estimated from the total photoelectron intensity fits.
Experimentally, the thermal destruction of (H2O)n− clusters with 14 ≤ n ≤ 24 has been studied in flow tube experiments (32) and found to occur over the range from 120 to 145 K, with the smaller clusters decaying via electron autodetachment toward the lower end of this temperature range. These measurements establish an upper bound on the temperature of small water cluster anions under thermodynamic conditions; however, it is by no means clear that the experimentally prepared (H2O)4− clusters, formed by Ar-mediated condensation of smaller cluster anions, (5) exist under equilibrium conditions. The computational methodology introduced here provides a direct means to investigate the mechanism by which these nonequilibrium ensembles are formed.
Conclusions
We have introduced a hybrid ab initio molecular dynamics scheme for simulating supramolecular anions. This technique recovers quantitative spectroscopic details at relatively low cost, while uncovering phenomena that would be difficult to infer from static calculations alone, such as the persistence of a localized AA electron-binding motif under thermal fluctuations at T = 300 K. Other phenomena identified in these simulations, such as the thermal stability of the AA water configuration itself, could in principle have been inferred from static calculations, by carefully locating the appropriate transition states and then calculating the corresponding isomerization barriers. However, the same conclusions are immediately evident from comparatively straightforward ab initio molecular dynamics simulations, and this approach provides a powerful tool for understanding the structure, dynamics, and spectroscopy of closed-shell molecules and clusters that bind an extra electron.
Our technique is accurate because it is based on quantum chemistry rather than pseudopotentials. Importantly, we have shown that relatively low-level quantum chemistry is sufficient, therefore one can actually use such methods in conjunction with molecular dynamics. These efforts are backed by extensive benchmark calculations (27, 28) for both (H2O)n− and (HF)n−, indicating that electron correlation effects are weak in the case of an “excess” electron bound by one or more closed-shell molecules. As such, the simulation techniques described here are applicable to other solvated-electron systems of contemporary interest, including electrons solvated in ammonia (33), alcohols (34), and organic ionic liquids (35). In addition, simulations of weakly bound molecular anions may provide important information regarding the mechanisms underlying biological radiation damage, as recent calculations suggest that low-energy electron binding by π* orbitals of DNA bases is one such damage pathway (36).
Although applications of this technique will initially be limited to small clusters or medium-sized molecular anions, increased computer speed and improved algorithms (22, 23) will only expand the horizons of this methodology. Moreover, there remain important open questions even in the small-cluster size regime, including the mechanism by which the cluster anions form in the molecular beam, and the influence of the Ar atoms that are coexpanded with the water clusters, which are key to understanding the nonequilibrium nature of the experimentally probed cluster ensemble.
Methods
Simulated photoelectron spectra (Fig. 3) were obtained from ensembles of 20 500-fs microcanonical trajectories propagated with a time step of 0.36 fs at the B3LYP/6-31(1+,3+)G* level, by means of an accelerated ab initio molecular dynamics algorithm as described (23). Subsequently, VEBE(t) was calculated at the MP2/6-31(1+,3+)G* level at intervals of 2.2 fs. A 50% increase in the number of trajectories did not change the spectra, indicating convergence with respect to trajectory sampling. Initial nuclear coordinates for each trajectory corresponded to one of the isomeric local minima (A, B, or D). To avoid bias arising from identical starting coordinates we discarded the first 100 fs of each trajectory. Initial velocities were sampled from a Maxwell-Boltzmann distribution at the indicated temperature. Electronic structure calculations were performed with Q-Chem (37).
Acknowledgments
We thank Mark Johnson, Rob Roscioli, and Nathan Hammer for commenting on the manuscript and providing experimental spectra. This work was supported by National Science Foundation Grant CHE-0535710 (to M.H.-G.) and a postdoctoral fellowship from the National Science Foundation (to J.M.H.).
Abbreviations
- AA
double hydrogen-bond acceptor
- CCSD(T)
coupled-cluster singles and doubles with noniterative triples
- DFT
density functional theory
- HF
Hartree-Fock
- MP2
second-order Møller-Plesset perturbation theory
- VEBE
vertical electron binding energy.
Footnotes
The authors declare no conflict of interest.
This paper was submitted directly (Track II) to the PNAS office.
References
- 1.Hart EJ, Anbar M. The Hydrated Electron. New York: Wiley; 1970. [Google Scholar]
- 2.Posey LA, DeLuca MJ, Campagnola PJ, Johnson MA. J Phys Chem. 1989;93:1178–1181. [Google Scholar]
- 3.Coe JV, Lee GH, Eaton JG, Arnold ST, Sarkas HW, Bowen KH, Ludewigt C, Haberland H, Worsnop DR. J Chem Phys. 1990;92:3980–3982. [Google Scholar]
- 4.Kim J, Becker I, Cheshnovsky O, Johnson MA. Chem Phys Lett. 1998;297:90–96. [Google Scholar]
- 5.Shin JW, Hammer NI, Headrick JM, Johnson MA. Chem Phys Lett. 2004;399:349–353. [Google Scholar]
- 6.Verlet JRR, Bragg AE, Kammrath A, Cheshnovsky O, Neumark DM. Science. 2005;307:93–96. doi: 10.1126/science.1106719. [DOI] [PubMed] [Google Scholar]
- 7.Hammer NI, Shin JW, Headrick JM, Diken EG, Roscioli JR, Weddle GH, Johnson MA. Science. 2004;306:675–679. doi: 10.1126/science.1102792. [DOI] [PubMed] [Google Scholar]
- 8.Hammer NI, Roscioli JR, Johnson MA. J Phys Chem A. 2005;109:7896–7901. doi: 10.1021/jp052144b. [DOI] [PubMed] [Google Scholar]
- 9.Hammer NI, Roscioli JR, Johnson MA, Myshakin EM, Jordan KD. J Phys Chem A. 2006;109:11526–11530. doi: 10.1021/jp053769c. [DOI] [PubMed] [Google Scholar]
- 10.Ayotte P, Bailey CG, Kim J, Johnson MA. J Chem Phys. 1998;108:444–449. [Google Scholar]
- 11.Kevan L. Acc Chem Res. 1981;14:138–145. [Google Scholar]
- 12.Tauber MJ, Mathies RA. J Am Chem Soc. 2003;125:1394–1402. doi: 10.1021/ja021134a. [DOI] [PubMed] [Google Scholar]
- 13.Hammer NI, Roscioli JR, Bopp JC, Headrick JM, Johnson MA. J Chem Phys. 2005;123:244311–244317. doi: 10.1063/1.2134701. [DOI] [PubMed] [Google Scholar]
- 14.Roscioli JR, Hammer NI, Johnson MA. J Phys Chem A. 2006;110:7517–7520. doi: 10.1021/jp062029g. [DOI] [PubMed] [Google Scholar]
- 15.Ayotte P, Johnson MA. J Chem Phys. 1997;106:811–814. [Google Scholar]
- 16.Paik DH, Lee I-R, Yang D-S, Baskin JS, Zewail AH. Science. 2004;306:672–675. doi: 10.1126/science.1102827. [DOI] [PubMed] [Google Scholar]
- 17.Bragg AE, Verlet JRR, Kammrath A, Cheshnovsky O, Neumark DM. Science. 2004;306:669–671. doi: 10.1126/science.1103527. [DOI] [PubMed] [Google Scholar]
- 18.Bragg AE, Verlet JRR, Kammrath AE, Cheshnovsky O, Neumark DM. J Am Chem Soc. 2005;127:15283–15295. doi: 10.1021/ja052811e. [DOI] [PubMed] [Google Scholar]
- 19.Draves JA, Luthey-Schulten Z, Liu W-L, Lisy JM. J Chem Phys. 1990;93:4589–4602. [Google Scholar]
- 20.Cabarcos OM, Weinheimer CJ, Lisy JM. J Phys Chem A. 1999;103:8777–8791. [Google Scholar]
- 21.Turi L, Sheu W-S, Rossky PJ. Science. 2005;309:914–917. doi: 10.1126/science.1115808. [DOI] [PubMed] [Google Scholar]
- 22.Marx D, Hutter J. In: Modern Methods and Algorithms of Quantum Chemistry. 2nd Ed. Grotendorst J, editor. Vol 3. Jülich, Germany: John von Neumann Institute for Computing; 2000. pp. 329–477. [Google Scholar]
- 23.Herbert JM, Head-Gordon M. Phys Chem Chem Phys. 2005;7:3269–3275. doi: 10.1039/b509494a. [DOI] [PubMed] [Google Scholar]
- 24.Herbert JM, Head-Gordon M. J Am Chem Soc. 2006 doi: 10.1021/ja064949i. in press. [DOI] [PubMed] [Google Scholar]
- 25.Gutowski M, Skurski P, Boldyrev AI, Simons J, Jordan KD. Phys Rev A. 1996;54:1906–1909. doi: 10.1103/physreva.54.1906. [DOI] [PubMed] [Google Scholar]
- 26.Jordan KD, Wang F. Annu Rev Phys Chem. 2003;54:367–396. doi: 10.1146/annurev.physchem.54.011002.103851. [DOI] [PubMed] [Google Scholar]
- 27.Herbert JM, Head-Gordon M. Phys Chem Chem Phys. 2006;8:68–78. doi: 10.1039/b513098k. [DOI] [PubMed] [Google Scholar]
- 28.Herbert JM, Head-Gordon M. J Phys Chem A. 2005;109:5217–5229. doi: 10.1021/jp051096s. [DOI] [PubMed] [Google Scholar]
- 29.Gutowski M, Jordan KD, Skurski P. J Phys Chem A. 1998;102:2624–2633. [Google Scholar]
- 30.Tarakeshwar P, Lee HM, Kim KS. In: Reviews of Modern Quantum Chemistry. Sen KD, editor. Vol 2. River Edge, NJ: World Scientific; 2002. pp. 1642–1683. [Google Scholar]
- 31.Sommerfeld T, Jordan KD. J Phys Chem A. 2005;109:11531–11538. doi: 10.1021/jp053768k. [DOI] [PubMed] [Google Scholar]
- 32.Arnold ST, Morris RA, Viggiano AA. J Chem Phys. 1995;103:9242–9248. [Google Scholar]
- 33.Shkrob IA. J Phys Chem A. 2006;110:3967–3976. doi: 10.1021/jp055500z. [DOI] [PubMed] [Google Scholar]
- 34.Tauber MJ, Stuart CM, Mathies RA. J Am Chem Soc. 2004;126:3414–3415. doi: 10.1021/ja031816d. [DOI] [PubMed] [Google Scholar]
- 35.Wishart JF, Lall-Ramnarine SI, Raju R, Scumpia A, Bellevue S, Ragbir R, Engel R. Radiat Phys Chem. 2005;72:99–104. [Google Scholar]
- 36.Berdys J, Anusiewicz I, Skurski P, Simons J. J Am Chem Soc. 2004;126:6441–6447. doi: 10.1021/ja049876m. [DOI] [PubMed] [Google Scholar]
- 37.Shao Y, Molnar LF, Jung Y, Kussmann J, Ochsenfeld C, Brown ST, Gilbert ATB, Slipchenko LV, Levchenko SV, O'Neill DP, et al. Phys Chem Chem Phys. 2006;8:3172–3191. doi: 10.1039/b517914a. [DOI] [PubMed] [Google Scholar]


