Abstract
Two cationic phospholipid derivatives with asymmetric hydrocarbon chains were synthesized: ethyl esters of oleoyldecanoyl-ethylphosphatidylcholine (C18:1/C10-EPC) and stearoyldecanoyl-ethylphosphatidylcholine (C18:0/C10-EPC). The former was 50 times more effective as a DNA transfection agent (human umbilical artery endothelial cells) than the latter, despite their similar chemical structure and virtually identical lipoplex organization. A likely reason for the superior effectiveness of C18:1/C10-EPC relative to C18:0/C10-EPC (and to many other cationic lipoids) was suggested by the phases that evolved when these lipoids were mixed with negatively charged membrane lipid formulations. The saturated C18:0/C10-EPC remained lamellar in mixtures with biomembrane-mimicking lipid formulations [e.g., dioleoyl-phosphatidylcholine/dioleoyl-phosphatidylethanolamine/dioleoyl-phosphatidylserine/cholesterol at 45:20:20:15 (wt/wt)]; in contrast, the unsaturated C18:1/C10-EPC exhibited a lamellar–nonlamellar phase transition in such mixtures, which took place at physiological temperatures, ≈37°C. As is well known, lipid vehicles exhibit maximum leakiness and contents release in the vicinity of phase transitions, especially those involving nonlamellar phase formation. Moreover, nonlamellar phase-forming compositions are frequently highly fusogenic. Indeed, FRET experiments showed that C18:1/C10-EPC exhibits lipid mixing with negatively charged membranes that is several times more extensive than that of C18:0/C10-EPC. Thus, C18:1/C10-EPC lipoplexes are likely to easily fuse with membranes, and, as a result of lipid mixing, the resultant aggregates should exhibit extensive phase coexistence and heterogeneity, thereby facilitating DNA release and leading to superior transfection efficiency. These results highlight the phase properties of the carrier lipid/cellular lipid mixtures as a decisive factor for transfection success and suggest a strategy for the rational design of superior cationic lipid carriers.
Keywords: lipofection, lipoplex, mesophase
Important therapeutic procedures, such as gene transfection and gene silencing, require efficient delivery of genetic material to cells. Synthetic cationic lipoids, which form complexes (lipoplexes) with polyanionic DNA, are promising gene carriers (1). Understanding the mechanism of lipid-mediated DNA delivery (lipofection) is essential for the successful application and rational design and synthesis of novel cationic lipoid compounds for enhanced gene delivery. Although considerable improvement in the transfection properties of cationic lipoids has come from the synthesis of new kinds of cationic amphiphiles or from the inclusion of noncationic helper lipids, an effective alternative strategy was recently described: The combination of two cationic lipid derivatives having the same headgroup but different hydrocarbon chains can synergistically enhance transfection (2). For example, the optimal combination of the long chain/medium chain lipoids, dioleoyl- and dilauroyl-ethylphosphatidylcholines, delivered DNA into cells more than 30 times more efficiently than either compound separately (2). To rationalize this astonishing synergy, we determined whether the same efficiency enhancement could be attained if two different hydrocarbon chains, 18- and 10-carbon atoms long, were combined in a single, asymmetric-chain cationic lipid molecule.
The basic steps of lipofection include adsorption and endocytosis of lipoplexes inside the cell, followed by release of DNA and delivery to the nucleus. The second step (unbinding of DNA from cationic lipoid) is not understood, although unbinding is thought to result from charge neutralization by cellular anionic lipids. Indeed, addition of negatively charged liposomes to lipoplexes results in dissociation of DNA from the lipid (3–5, 7, †). A noteworthy suggestion is that the structure of cationic lipoid aggregates changes dramatically upon interaction with cellular lipids and that these changes are critical for efficient delivery (7–9).
Typically, lipoplexes are arranged as multilayer structures in which DNA is intercalated between the lipid bilayers (10–12). Some earlier studies suggested that the inverted hexagonal phase leads to more efficient transfection efficiency than does the lamellar phase (13, 14). Recent experiments dispute this suggestion, however, and there is considerable evidence against a direct general correlation between lipoplex structure and transfection efficiency (15–21). Furthermore, a viewpoint now emerging is that the critical factor in lipid-mediated transfection is the structural evolution of lipoplexes upon interacting and mixing with cellular lipids (7–9). Noteworthy is that such a concept can, in principle, also account for the considerable differences in the transfection potency of lipoplexes with different cells.
Here we provide an unambiguous example in support of that hypothesis. Two cationic phospholipids with asymmetric hydrocarbon chains, oleoyldecanoyl-ethylphosphatidylcholine (C18:1/C10-EPC) and stearoyldecanoyl-ethylphosphatidylcholine (C18:0/C10-EPC), were found to exhibit an ≈50-fold difference in their DNA transfection efficiency in human umbilical artery endothelial cells (HUAEC), despite their similar chemical structure and virtually identical lipoplex organization. A likely reason for this difference is the dramatic difference in the phase evolution of these lipoids when mixed with biomembrane-mimicking lipid formulations as well as with natural lipid extracts. The compound with superior transfection efficiency, C18:1/C10-EPC, undergoes a phase transition to nonlamellar phase at physiological temperature when mixed with membrane lipid preparations.
Results
Transfection Activity.
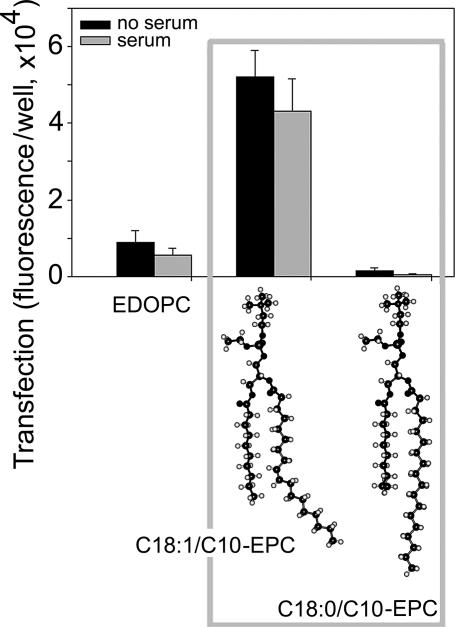
The two cationic phospholipids C18:1/C10-EPC and C18:0/C10-EPC were tested for transfection activity in vitro by using β-gal expression in HUAEC. The results are presented in Fig. 1. For comparison, Fig. 1 also includes the transfection efficiency of ethyldioleoylphosphatidylcholine, an effective cationic phospholipoid transfection agent that has already been extensively described (3, 16). The unsaturated C18:1/C10-EPC exhibited nearly 50 times higher activity than the saturated C18:0/C10-EPC compound, and more than five times higher activity than ethyldioleoylphosphatidylcholine. In the presence of serum, transfection decreased, as is common (22).
Fig. 1.
Transfection efficiency of C18:0/C10-EPC and C18:1/C10-EPC lipoplexes as quantified by expression of β-gal in HUAEC.
Structure and Phase Behavior of Cationic Lipid Aggregates and Lipoplexes.
In search of the origin of the dramatic difference in transfection between the two C18/C10-EPC lipoids, we determined their phase structure by x-ray diffraction.
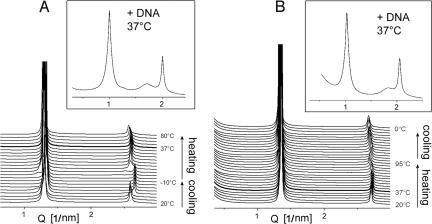
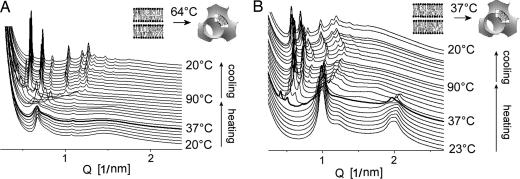
In aqueous dispersion, C18:0/C10-EPC arranges into lamellar phase at 20°C, with a repeat period d = 4.85 nm (Fig. 2A) slightly lower than that of the ethylphosphatidylcholine (EPC) with saturated symmetric chain ethyldistearoylphosphatidylcholine (diC18:0-EPC) (23). When C18:0/C10-EPC cools, it undergoes a phase transition to another lamellar phase with a smaller repeat distance (d = 4.73 nm). The transition, at ≈12°C, is reversible. Based on the precedent of the high similarity in the phase behavior of the parent phosphatidylcholines and their ethyl triester derivatives (3, 12), this is a gel-to-liquid crystalline transition. Indeed, the phosphatidylcholine with these same C18:0/C10 chains has the same transition temperature (24). The lamellar repeat distance of 4.73 nm is higher than that of the symmetric chain ethyldistearoylphosphatidylcholine in its gel phase (d = 4.3 nm) (23). Because it has been established that the saturated symmetric chain EPCs form a fully interdigitated gel phase (3, 23, 25), this difference indicates that the gel phase of the asymmetric chain C18:0/C10-EPC is of the partially interdigitated variety (24). The lamellar arrangement is preserved in the hydrated C18:0/C10-EPC when heating to 90°C.
Fig. 2.
SAXD patterns of C18:0/C10-EPC (A) and C18:1/C10-EPC (B) samples recorded from temperature scans at 1°C/min. The upper graphs show SAXD profiles of isoelectric cationic lipid/DNA lipoplexes recorded at 37°C.
The unsaturated lipoid C18:1/C10-EPC also forms the lamellar phase over the whole temperature interval between 0°C and 95°C (Fig. 2B), with no indication of a transition to gel phase. This observation accords with the fact that the introduction of a single double bond in the diacyl-phosphatidylcholines significantly reduces their gel-to-liquid crystalline phase transition temperature (26).
Addition of an isoelectric amount of DNA to the cationic lipoids does not disrupt their lamellar arrangement (Fig. 2 A Upper and B Upper). The increase of the lamellar spacing by 1.5–1.6 nm as a result of the inclusion of DNA is consistent with reports on lipoplexes of other EPCs (3, 12, 16, 23). The spacing of the diffuse diffraction peak, characteristic of DNA ordered in smectic arrays between the lipid bilayers (3.43 nm for C18:1/C10-EPC and 3.67 nm for C18:0/C10-EPC), also is similar to that of other EPC lipoplexes. Lamellar lipoplex structures are retained throughout the entire temperature range examined, namely, 20–80°C.
Lipoplex Size.
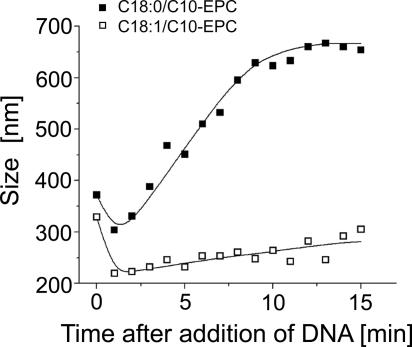
Lipoplex size has been suggested to modulate transfection activity, with larger (within limits) lipoplexes being generally more efficient (27, 28). Recent experiments showed, however, that lipoplex size by itself does not necessarily directly correlate to transfection efficiency (29, 30), and examples now exist in which smaller lipoplexes are more efficient than larger ones (21, 31). Therefore, we examined the aggregate sizes of the two C18/C10-EPC compounds and their lipoplexes. The sizes of the C18:1/C10-EPC and C18:0/C10-EPC liposomes were similar, ≈330 and 370 nm, respectively (Fig. 3). When DNA was added to them at a 4:1 lipid/DNA weight ratio, the lipoplexes of the saturated C18:0/C10-EPC grew to ≈650 nm within the 15-min incubation time applied throughout the transfection experiments. The lipoplexes of the unsaturated C18:1/C10-EPC were about half that size at 305 nm (Fig. 3). [The initial decrease of the particle size observed with the two lipids is possibly related to early steps of lipoplex formation kinetics, including vesicle rupture after DNA adhesion (32, 33).]
Fig. 3.
Kinetics of lipoplex growth after addition of DNA to C18:1/C10-EPC liposomes (□) and C18:0/C10-EPC liposomes (■) as followed by dynamic light scattering. Lines are drawn to guide the eye.
Phase Behavior of Cationic/Membrane Lipid Mixtures.
Because the structural organization of the two C18/C10-EPC compounds and their lipoplexes did not provide an explanation for their impressively different transfection activity, we next simulated the interactions of the carrier lipoids with the cellular membranes. We therefore examined the structure of mixtures of the cationic lipoids with negatively charged membranes, which included (i) the anionic membrane lipid dioleoyl-phosphatidylglycerol (DOPG); (ii) a membrane-mimicking lipid mixture [MM = dioleoyl-phosphatidylcholine/dioleoyl-phosphatidylethanolamine/dioleoyl-phosphatidylserine/cholesterol at 45:20:20:15 (wt/wt)]; and (iii) natural lipid extract from bovine liver.
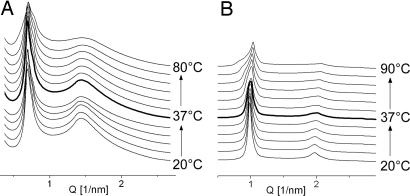
Small-angle x-ray diffraction (SAXD) patterns of 1:1 mixtures of the saturated C18:0/C10-EPC with DOPG and MM, recorded during heating scans, are shown in Fig. 4A and B, respectively. The two mixtures retained their lamellar arrangement over a broad temperature interval (20–80°C); the same was valid for the mixture with liver lipid extract (data not shown).
Fig. 4.
SAXD patterns of mixtures of C18:0/C10-EPC with DOPG 1:1 (A) and MM 1:1 (B) recorded from heating scans at 1°C/min.
Remarkably different from the thermal behavior of the saturated EPC in 1:1 mixtures with the negatively charged membranes was that of unsaturated C18:1/C10-EPC (Fig. 5). With the anionic DOPG, C18:1/C10-EPC formed a highly swollen (d ≈ 9.4 nm), disordered lamellar phase at room temperature (Fig. 5A), and, when heated, that phase underwent a lamellar-to-nonlamellar transition to a cubic phase. The initial traces of the latter phase, which appeared at 60–65°C, exhibited rather high spacings; the two diffraction rings first observable were at 15.86 and 12.95 nm. These spacings are not sufficient for precise phase identification, but, being at a 1/: 1/ ratio, they appear to originate from a cubic lattice of ≈22- to 23-nm unit cell size. At a slightly higher temperature, ≈70–75°C, this cubic phase converted to another with diffraction peaks at lower spacings. At 80°C, up to 14 maxima were visible on the diffraction pattern, indexing as the initial 14 reflections characteristic of the cubic Pn3m phase (cubic aspect 4) (34), with an ≈15-nm unit cell size. This highly ordered structure is retained on subsequent cooling down to room temperature, and it remained unchanged when stored during the time course of the experiment (up to 24 h).
Fig. 5.
SAXD patterns of mixtures of C18:1/C10-EPC with DOPG 1:1 (A) and MM 1:1 (B) recorded from temperature scans at 1°C/min.
The thermal phase behavior of the mixture of C18:1/C10-EPC with MM (Fig. 5B) was similar to that of the mixture with DOPG, namely because it was dominated by lamellar phase at room temperature that became irreversibly converted into a cubic phase when heated. A significant feature in this case is that the lamellar-to-nonlamellar phase conversion occurred at physiological temperature, ≈37°C. The cubic phase that formed initially was highly swollen, having only two distinguishable reflections, with spacings at a 1/:1/ ratio. This phase further converted transiently into another cubic phase, Ia3d, at ≈50°C, which finally transformed at ≈60°C into highly ordered Pn3m cubic phase. The latter persisted upon cooling as well as during subsequent incubation at room temperature for at least 24 h.
A similar feature, namely a phase transition at physiological temperature, also is characteristic of C18:1/C10-EPC mixed with liver lipid extract (data not shown). When heated, the mixture began a transition to the inverted hexagonal HII phase at ≈37°C. This transition was reversible by cooling. Thus, at physiological temperature, extended phase coexistence is characteristic for this mixture.
Lipid Mixing.
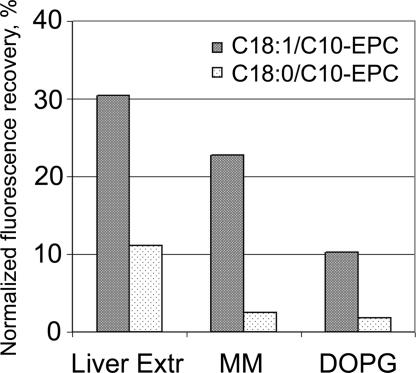
The mixing of lipids of positively and negatively charged liposomes was assessed by using a FRET assay. Two fluorescent lipids that were incorporated in the cationic liposomes, N-(7-nitrobenz-2-oxa-1, 3-diazol-4-yl)-phosphatidylethanolamine (NBD-PE) and rhodamine-phosphatidylethanolamine, exhibit energy transfer, so emission from the donor (NBD-PE) at 535 nm was strongly suppressed when the excitation wavelength was 470 nm, which corresponds to NBD-PE absorption (35). Fusion with unlabeled negatively charged liposomes is signaled by an increase in NBD-PE fluorescence because of probe dilution and increased fluorophore separation, which reduces energy transfer. Fluorescence was measured in the presence of 1% Triton X-100 after complete mixing of the lipids, and this intensity was used for normalization (to 100% fusion) of measurements. Fig. 6 shows the normalized increase of the NBD-PE fluorescence from C18:1/C10-EPC and C18:0/C10-EPC liposomes upon addition of negatively charged liposomes consisting of (i) the anionic membrane lipid DOPG; (ii) MM; and (iii) lipid extract from bovine liver. The fluorescence increase in the C18:1/C10-EPC liposomes was highest for the liver extract (31%), and lowest for DOPG (11%). Much less fluorescence (3–10 times) was recorded from C18:0/C10-EPC liposomes on addition of the negatively charged dispersions.
Fig. 6.
Lipid mixing of the cationic C18:0/C10-EPC and C18:1/C10-EPC with the membrane lipid preparations: DOPG, MM, and total liver extract, as assessed by FRET (normalized fluorescence recovery 3 min after addition of the unlabeled membrane lipid dispersions to the cationic lipoid dispersion labeled with 1% NBD-PE and 1% rhodamine-phosphatidylethanolamine).
Morphology of the Cationic/Membrane Lipid Mixtures.
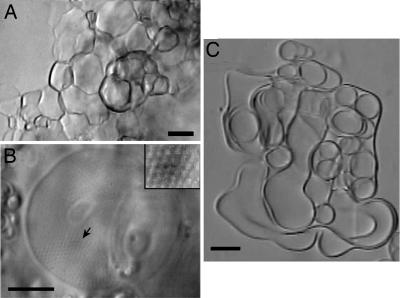
Light microscopy of a mixture of cationic C18:1/C10-EPC liposomes with MM revealed a peculiar foam-like morphology (Fig. 7A). Time-lapse recordings showed that the foam morphology developed upon mutual contact of spherical vesicles that formed at the beginning of the hydration process. With time, the foamy structure developed into highly ordered nonlamellar structure with regularly repeating motifs (Fig. 7B). Similar preparations with saturated C18:0/C10-EPC and MM developed into soft, flexible membranes (Fig. 7C).
Fig. 7.
Micrographs of mixtures of C18:1/C10-EPC (A and B) and C18:0/C10-EPC (C) with MM. (Scale bar: 10 μm.) The picture in B was taken 15 h after the one in A. (B Inset) An enlarged view of an ordered domain.
Discussion
Positively charged lipid-like compounds are currently considered the most promising nonviral carriers of genetic material into cells for transfection. Currently, many lipoplex preparations are available, and a host of cationic lipoids have been used in their formulation. The details of DNA delivery by cationic lipid vectors are still mostly unknown, however, so these efforts are largely empirical, and the transfection efficiency is still unsatisfactorily low for many cell types.
The transfection capacity of lipoplexes prepared by different cationic lipoids varies widely. Despite their structural similarities, C18:0/C10-EPC and C18:1/C10-EPC, exhibit a 50-fold difference in their transfection of HUAEC. These compounds were found to form lipoplexes with virtually identical supramolecular structures: multilamellar complexes in which DNA strands are intercalated between lipid bilayers. The sizes of the two kinds of cationic liposomes also were similar. The sizes of their lipoplexes differed; after the normal incubation time for lipoplex formation, the C18:0/C10-EPC lipoplexes were twice as large as those of C18:1/C10-EPC. Thus, our results disagree with the opinion that bigger (within limits) lipoplexes are generally more efficient (27, 28). Indeed, the smaller C18:1/C10-EPC lipoplexes exhibited 50-fold higher efficiency than the larger C18:0/C10-EPC lipoplexes.
The unbinding of DNA from lipoplexes has been identified as one of the critical steps along the transfection route. According to current understanding, it must involve the neutralization of the cationic lipoid by cellular anionic lipids. Therefore, we sought a rationale for the remarkable difference in the transfection potency of the two C18/C10-EPC compounds by exploring their interaction with membrane lipid preparations.
Mixtures of certain cationic lipoids with anionic lipids of the type found in cell membranes are unusually prone to form nonlamellar phases, even when the pure components form only lamellar phases (36, 37). In some cases, adding even small amounts of anionic lipid to certain cationic lipoids generates virtually the entire panoply of possible lipid arrays (38). Thus, a wide variety of nonlamellar arrays can potentially appear in treated cells as a result of cationic/membrane lipid mixing during the DNA delivery process. In a previous study on this topic (7), we demonstrated that the phase preferences of mixtures of the cationic phospholipid ethyldioleoylphosphatidylcholine with membrane (anionic) lipids unambiguously correlate with their potency to release DNA from the lipoplexes: anionic lipids that were more efficient in releasing DNA formed nonlamellar phases of high negative curvature. Conversely, the anionic lipids for which only inefficient release of DNA was observed formed mostly lamellar phases (7).
The question thus arises: Can an intracellular lamellar-to-nonlamellar phase transition in cationic/membrane lipid mixture explain the superior performance of some cationic lipid transfection agents, such as C18:1/C10-EPC? This assumption now seems very likely, because mixtures of this cationic lipoid with MM preparations and natural lipid extract exhibited a strong propensity to undergo a transition to nonlamellar phases, whereas those of the much less effective analog, C18:0/C10-EPC, did not.
Neutralization of cationic lipid carriers by anionic membrane lipids, which is required for DNA release, presupposes lipid exchange between cationic lipoplexes and negatively charged membranes of cytoplasm, most likely by fusion of cell membranes with lipoplexes. [Another possibility is monomer transfer via the aqueous phase; this process is usually slow, but, because charged lipids exhibit higher solubility in water, it still could be important. In fact, we recently showed that monomer exchange is considerably more facile for charged than for zwitterionic lipid vesicles (39).] Indeed, fusogenicity was previously found to correlate well with transfection efficiency (e.g., ref. 2 and our unpublished data). Our FRET experiments here showed that C18:1/C10-EPC mixes with negatively charged membranes several times more extensively than does C18:0/C10-EPC (Fig. 6). It is clear that extrapolating results from fusion experiments with model systems, including lipids only, to natural membranes that contain proteins and much more complex mixtures of lipids requires care. Hence, we emphasize that our fusion experiments involve oppositely charged lipid aggregates (as do the lipoplex–membrane interactions), in which fusion is activated by electrostatic attraction. Fusion of such aggregates has been clearly and repeatedly visualized (40–43). We therefore suggest that the higher lipid mixing activity of C18:1/C10-EPC with negatively charged membranes revealed in our FRET experiments also replicates its higher fusion activity with real membranes.
A relationship between membrane fusion and a lamellar–nonlamellar phase transition has long been a prominent feature in the literature and has been well elaborated with respect to both molecular mechanism and energetics (44, 45). Simple topological considerations also indicate that lamellar–nonlamellar phase transformations should include some form of a bilayer fusion step; correspondingly, membrane fusion should necessarily proceed with formation of nonlamellar motifs; in fact, a prospective nonlamellar membrane fusion intermediate structure has been experimentally observed (46). Therefore, the high fusogenicity recorded for C18:1/C10-EPC correlates well with its disposition to form highly curved nonlamellar arrays in mixtures with membrane lipids. Our micrographs also reveal vesicle aggregation and fusion, with a subsequent development of highly ordered repetitive curved morphologies, reminiscent of the bicontinuous cubic structures.
Especially remarkable is the fact that the transition to a nonlamellar phase in the mixtures of C18:1/C10-EPC with membrane lipids (MM and liver extract) takes place at physiological temperatures. It is now well known that lipid vehicles exhibit maximum leakiness and contents release in the vicinity of phase transitions (47–50), presumably because of the accumulation of defects and increased disorder along the phase boundaries within the transition region. Moreover, this presumption is true for transitions involving nonlamellar phase formation (51–54), which are associated with massive structural rearrangement. Thus, the remarkable effectiveness of C18:1/C10-EPC as a transfection agent appears to be due to the coincidence that it not only tends to form nonlamellar arrays when mixed with membrane lipids but also that it undergoes the phase reorganization at physiological temperature.
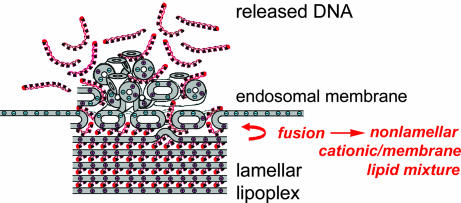
Hence, C18:1/C10-EPC lipoplexes are likely to easily fuse with membranes, and, as a result of lipid mixing, the resultant aggregates should exhibit extensive phase coexistence and heterogeneity, thereby facilitating DNA release and leading to superior transfection efficiency (Fig. 8). These results highlight the phase properties of carrier lipid/cellular lipid mixtures as decisive factors for transfection success. Indeed, the structural evolution of lipoplexes upon interaction with cellular lipids appears to be a controlling factor in lipid-mediated DNA delivery. These results also suggest that the rational design of superior cationic lipid carriers can be based on the proposition that lamellar lipoplex formulations, which are readily susceptible to undergoing lamellar–nonlamellar phase transitions upon mixing with cellular lipids, are especially promising lipoplex candidates.
Fig. 8.
Lamellar cationic lipid carriers that form nonlamellar structures upon contacting the membrane lipids easily release DNA and exhibit optimum transfection efficiency.
Materials and Methods
Lipids and DNA.
The triflate derivatives of C18:1/C10-EPC and C18:0/C10-EPC were synthesized as previously described (3, 55). Bovine liver extract, cholesterol, and dioleoyl derivatives of phosphatidylcholine, phosphatidylethanolamine, and phosphatidylglycerol (Avanti Polar Lipids, Birmingham, AL) were used without further purification. For x-ray diffraction sample preparation, aliquots were transferred to vials where the bulk of the solvent was removed under argon and the residual solvent was removed under high vacuum. Next, PBS (50 mM phosphate buffer/100 mM NaCl, pH 7.2) was added. The dispersions were hydrated overnight at room temperature and vortex-mixed for several minutes; several cycles of freezing–thawing were applied. Herring sperm DNA (Invitrogen, Carlsbad, CA) was used for preparation of lipoplexes for x-ray diffraction experiments. The amount of DNA in the lipoplexes was intended to match the positive charge of the cationic lipid, assuming an average nucleotide molecular weight of 330 (isoelectric samples). DNA/lipid dispersions were prepared by adding an aqueous DNA solution to the dry lipid film and immediately vortexing, as previously described (23).
Synchrotron SAXD.
Measurements were performed at Argonne National Laboratory, Advanced Photon Source, DND-CAT, and BioCAT, by using 12 keV x-rays, as previously described (38). The lipid concentration of the dispersions was 20 wt %. Samples were filled into glass capillaries and flame-sealed. A Linkam thermal stage (Linkam Scientific Instruments, Surrey, UK) provided temperature control. Linear heating and cooling scans were performed at rates of 0.8–5°C/min. Exposure times were typically ≈0.5–1 s. Data were collected by using a MAR-CCD detector. Diffraction intensity vs. Q plots were obtained by radial integration of the 2D patterns by using the interactive data-evaluating program FIT2D (6).
FRET.
The experiments have been described (2, 7). Briefly, cationic liposomes were prepared with 1% NBD-PE and 1% rhodamine-phosphatidylethanolamine (Molecular Probes, Eugene, OR). The labeled lipids were added to a chloroform solution of the cationic lipoids at the initial step of liposome preparation (see Lipids and DNA). The lipid concentration of the dispersions was 0.1 mM. Negatively charged liposomes were prepared at the same lipid concentration, without fluorescent labels. Labeled cationic liposomes were placed in an AlphaScan fluorometer (Photon Technology International, Princeton, NJ) and treated with an equimolar amount of unlabeled, negatively charged lipids at 37°C. Fluorescence intensity was recorded as a function of time with excitation at 470 nm and emission at 535 nm. Fluorescence was measured in the presence of 1% Triton X-100 after complete mixing of the lipids, and this intensity was used for the normalization of measurements.
Dynamic Light Scattering.
Measurements were performed with a BI-200SM goniometer and BI-9000 digital correlator (Brookhaven Instruments, Brookhaven, NY). Cationic lipid dispersions in PBS were prepared at 50 μg/ml. DNA was added to generate lipoplex samples at a 4:1 lipid/DNA weight ratio, and measurements were initiated immediately at 37°C. Delay times between 10 μs and 1 s were examined. The correlation data were fitted with quadratic cumulants. Correlation curves were recorded for 1 min to monitor the kinetics of the lipoplex size change.
Light Microscopy.
Micrographs of lipid samples were through a Nikon (Tokyo, Japan) Optiphot with differential interference optics. Images were recorded with a MINTRON-12V1E video camera connected to a personal computer by means of a Studio DC10 Plus (Pinnacle Systems, Mountain View, CA) video capturing system.
Transfection.
HUAEC were obtained from BioWhitakker (Walkersville, MD) and were seeded in 96-well plates. For the lipoplex preparation, liposomes and plasmid DNA [β-gal, which was purchased from Clontech Laboratories (Palo Alto, CA) and propagated and purified by Bayou Biolabs (Harahan, LA)] were diluted in OptiMEM, and liposomes were pipetted into the plasmid DNA solution at a 4:1 weight ratio. The resultant DNA–lipid complexes were incubated at room temperature for 15 min, and then 50 μl per well (1 μg of DNA per well) was added to the cells, either in medium alone or in medium containing 5% FBS. At 2 h after the addition of lipoplexes, the cells were washed with Hanks' balanced salt solution, and fresh complete medium was added. Cells were assayed for β-gal activity 24 h after transfection with a microplate fluorometric assay. The data presented are the mean ± SD of a representative experiment performed in quadruplicate.
Acknowledgments
We thank Harsh Parikh and Yaeko Hiyama (both from Northwestern University) for synthesis of the cationic lipids. BioCAT is supported by National Institutes of Health Grant RR08630. DND-CAT is supported by DuPont, The Dow Chemical Company, U.S. National Science Foundation Grant DMR-9304725, and the State of Illinois through Department of Commerce and Board of Higher Education Grant IBHE HECA NWU 96. Use of the Advanced Photon Source was supported by the U.S. Department of Energy, Basic Energy Sciences, Office of Energy Research, under Contract W-31-102-Eng-38. This work was supported by National Institutes of Health Grants GM52329, GM57305, and GM74429 and the Center for Cancer Nanotechnology Excellence initiative of the National Cancer Institute under Award U54CA119341.
Abbreviations
- C18:1/C10-EPC
oleoyldecanoyl-ethylphosphatidylcholine
- C18:0/C10-EPC
stearoyldecanoyl-ethylphosphatidylcholine
- DOPG
dioleoyl-phosphatidylglycerol
- MM
membrane-mimicking composition
- HUAEC
human umbilical artery endothelial cells.
Footnotes
The authors declare no conflict of interest.
This paper was submitted directly (Track II) to the PNAS office.
Ashley, G. W., Shidu, M. M., Qia, R., Lahiri, M. K., Levisay, A. C., Jones, R. D., Baker, K. A. & MacDonald, R. C. (1996) Biophys. J. 70,88 (abstr.).
References
- 1.Felgner PL, Ringold GM. Nature. 1989;337:387–388. doi: 10.1038/337387a0. [DOI] [PubMed] [Google Scholar]
- 2.Wang L, MacDonald RC. Gene Ther. 2004;11:1358–1362. doi: 10.1038/sj.gt.3302297. [DOI] [PubMed] [Google Scholar]
- 3.MacDonald RC, Ashley GW, Shida MM, Rakhmanova VA, Tarahovsky YS, Pantazatos DP, Kennedy MT, Pozharski EV, Baker KA, Jones RD, et al. Biophys J. 1999;77:2612–2629. doi: 10.1016/S0006-3495(99)77095-5. [DOI] [PMC free article] [PubMed] [Google Scholar]
- 4.Xu YH, Szoka FC. Biochemistry. 1996;35:5616–5623. doi: 10.1021/bi9602019. [DOI] [PubMed] [Google Scholar]
- 5.Zelphati O, Szoka FC. Proc Natl Acad Sci USA. 1996;93:11493–11498. doi: 10.1073/pnas.93.21.11493. [DOI] [PMC free article] [PubMed] [Google Scholar]
- 6.Hammersley AP, Svensson SO, Hanfland M, Fitch AN, Hausermann D. High Pressure Res. 1996;14:235–248. [Google Scholar]
- 7.Tarahovsky YS, Koynova R, MacDonald RC. Biophys J. 2004;87:1054–1064. doi: 10.1529/biophysj.104.042895. [DOI] [PMC free article] [PubMed] [Google Scholar]
- 8.Koynova R, Wang L, Tarahovsky Y, MacDonald RC. Bioconjug Chem. 2005;16:1335–1339. doi: 10.1021/bc050226x. [DOI] [PubMed] [Google Scholar]
- 9.Zuhorn IS, Bakowsky U, Polushkin E, Visser WH, Stuart MCA, Engberts JB, Hoekstra D. Mol Ther. 2005;11:801–810. doi: 10.1016/j.ymthe.2004.12.018. [DOI] [PubMed] [Google Scholar]
- 10.Radler JO, Koltover I, Salditt T, Safinya CR. Science. 1997;275:810–814. doi: 10.1126/science.275.5301.810. [DOI] [PubMed] [Google Scholar]
- 11.Lasic DD, Strey H, Stuart MCA, Podgornik R, Frederik PM. J Am Chem Soc. 1997;119:832–833. [Google Scholar]
- 12.Koynova R, MacDonald RC. Biochim Biophys Acta. 2003;1613:39–48. doi: 10.1016/s0005-2736(03)00135-4. [DOI] [PubMed] [Google Scholar]
- 13.Smisterova J, Wagenaar A, Stuart MCA, Polushkin E, ten Brinke G, Hulst R, Engberts JB, Hoekstra D. J Biol Chem. 2001;276:47615–47622. doi: 10.1074/jbc.M106199200. [DOI] [PubMed] [Google Scholar]
- 14.Koltover I, Salditt T, Radler JO, Safinya CR. Science. 1998;281:78–81. doi: 10.1126/science.281.5373.78. [DOI] [PubMed] [Google Scholar]
- 15.Simberg D, Danino D, Talmon Y, Minsky A, Ferrari ME, Wheeler CJ, Barenholz Y. J Liposome Res. 2003;13:86–87. [Google Scholar]
- 16.Rakhmanova VA, McIntosh TJ, MacDonald RC. Cell Mol Biol Lett. 2000;5:51–65. [Google Scholar]
- 17.Congiu A, Pozzi D, Esposito C, Castellano C, Mossa G. Colloids Surf B. 2004;36:43–48. doi: 10.1016/j.colsurfb.2004.04.006. [DOI] [PubMed] [Google Scholar]
- 18.Caracciolo G, Pozzi D, Caminiti R, Castellano AC. Eur Phys J E. 2003;10:331–336. doi: 10.1140/epje/i2002-10117-x. [DOI] [PubMed] [Google Scholar]
- 19.Caracciolo G, Caminiti R. Chem Phys Lett. 2005;411:327–332. [Google Scholar]
- 20.Ross PC, Hensen ML, Supabphol R, Hui SW. J Liposome Res. 1998;8:499–520. [Google Scholar]
- 21.Wang L, Koynova R, Parikh H, MacDonald RC. Biophys J. 2006;91 doi: 10.1529/biophysj.106.092700. in press. [DOI] [PMC free article] [PubMed] [Google Scholar]
- 22.Zuhorn IS, Hoekstra D. J Membr Biol. 2002;189:167–179. doi: 10.1007/s00232-002-1015-7. [DOI] [PubMed] [Google Scholar]
- 23.Koynova R, MacDonald RC. Nano Lett. 2004;4:1475–1479. [Google Scholar]
- 24.Lin HN, Wang ZQ, Huang CH. Biochim Biophys Acta. 1991;1067:17–28. doi: 10.1016/0005-2736(91)90021-y. [DOI] [PubMed] [Google Scholar]
- 25.Lewis RN, Winter I, Kriechbaum M, Lohner K, McElhaney RN. Biophys J. 2001;80:1329–1342. doi: 10.1016/S0006-3495(01)76106-1. [DOI] [PMC free article] [PubMed] [Google Scholar]
- 26.Koynova R, Caffrey M. Biochim Biophys Acta. 1998;1376:91–145. doi: 10.1016/s0304-4157(98)00006-9. [DOI] [PubMed] [Google Scholar]
- 27.Ross PC, Hui SW. Gene Ther. 1999;6:651–659. doi: 10.1038/sj.gt.3300863. [DOI] [PubMed] [Google Scholar]
- 28.Almofti MR, Harashima H, Shinohara Y, Almofti A, Li WH, Kiwada H. Mol Membr Biol. 2003;20:35–43. doi: 10.1080/09687680210035104. [DOI] [PubMed] [Google Scholar]
- 29.Karmali PP, Kumar VV, Chaudhuri A. J Med Chem. 2004;47:2123–2132. doi: 10.1021/jm030541+. [DOI] [PubMed] [Google Scholar]
- 30.Sen J, Chaudhuri A. J Med Chem. 2005;48:812–820. [Google Scholar]
- 31.Lleres D, Weibel JM, Heissler D, Zuber G, Duportail G, Mely Y. J Gene Med. 2004;6:415–428. doi: 10.1002/jgm.539. [DOI] [PubMed] [Google Scholar]
- 32.Kennedy MT, Pozharski EV, Rakhmanova VA, MacDonald RC. Biophys J. 2000;78:1620–1633. doi: 10.1016/S0006-3495(00)76714-2. [DOI] [PMC free article] [PubMed] [Google Scholar]
- 33.Pozharski E, MacDonald RC. Anal Biochem. 2005;341:230–240. doi: 10.1016/j.ab.2005.03.027. [DOI] [PubMed] [Google Scholar]
- 34.Kasper JS, Lonsdale K. International Tables for X-Ray Crystallography. Dordrecht, The Netherlands: Riedel; 1985. [Google Scholar]
- 35.Struck DK, Hoekstra D, Pagano RE. Biochemistry. 1981;20:4093–4099. doi: 10.1021/bi00517a023. [DOI] [PubMed] [Google Scholar]
- 36.Tarahovsky YS, Arsenault AL, MacDonald RC, McIntosh TJ, Epand RM. Biophys J. 2000;79:3193–3200. doi: 10.1016/S0006-3495(00)76552-0. [DOI] [PMC free article] [PubMed] [Google Scholar]
- 37.Lewis RN, McElhaney RN. Biophys J. 2000;79:1455–1464. doi: 10.1016/S0006-3495(00)76397-1. [DOI] [PMC free article] [PubMed] [Google Scholar]
- 38.Koynova R, MacDonald RC. Biophys J. 2003;85:2449–2465. doi: 10.1016/s0006-3495(03)74668-2. [DOI] [PMC free article] [PubMed] [Google Scholar]
- 39.Koynova R, MacDonald RC. Biochim Biophys Acta. 2005;1714:63–70. doi: 10.1016/j.bbamem.2005.05.009. [DOI] [PubMed] [Google Scholar]
- 40.Pantazatos DP, MacDonald RC. J Membr Biol. 1999;170:27–38. doi: 10.1007/s002329900535. [DOI] [PubMed] [Google Scholar]
- 41.Pantazatos DP, Pantazatos SP, MacDonald RC. J Membr Biol. 2003;194:129–139. doi: 10.1007/s00232-003-2031-y. [DOI] [PubMed] [Google Scholar]
- 42.Lei GH, MacDonald RC. Biophys J. 2003;85:1585–1599. doi: 10.1016/S0006-3495(03)74590-1. [DOI] [PMC free article] [PubMed] [Google Scholar]
- 43.Gordon SP, Berezhna S, Scherfeld D, Kahya N, Schwille P. Biophys J. 2005;88:305–316. doi: 10.1529/biophysj.104.043133. [DOI] [PMC free article] [PubMed] [Google Scholar]
- 44.Siegel DP, Epand RM. Biophys J. 1997;73:3089–3111. doi: 10.1016/S0006-3495(97)78336-X. [DOI] [PMC free article] [PubMed] [Google Scholar]
- 45.Siegel DP. In: Bicontinuous Liquid Crystals. Lynch ML, Spicer PT, editors. Boca Raton, FL: CRC; 2005. pp. 59–98. [Google Scholar]
- 46.Yang L, Huang HW. Science. 2002;297:1877–1879. doi: 10.1126/science.1074354. [DOI] [PubMed] [Google Scholar]
- 47.Mouritsen OG, Jorgensen K, Honger T. In: Permeability and Stability of Lipid Bilayers. Disalvo EA, Simon SA, editors. Boca Raton: CRC Press; 1995. pp. 137–160. [Google Scholar]
- 48.Papahadjopoulos D, Jacobson K, Nir S, Isac T. Biochim Biophys Acta. 1973;311:330–348. doi: 10.1016/0005-2736(73)90314-3. [DOI] [PubMed] [Google Scholar]
- 49.Blok MC, Vandeenen LLM, Degier J. Biochim Biophys Acta. 1976;433:1–12. doi: 10.1016/0005-2736(76)90172-3. [DOI] [PubMed] [Google Scholar]
- 50.Marsh D, Watts A, Knowles PF. Biochemistry. 1976;15:3570–3578. doi: 10.1021/bi00661a027. [DOI] [PubMed] [Google Scholar]
- 51.Langner M, Hui SW. Chem Phys Lipids. 1993;65:23–30. doi: 10.1016/0009-3084(93)90078-h. [DOI] [PubMed] [Google Scholar]
- 52.Lamson MJ, Herbette LG, Peters KR, Carson JH, Morgan F, Chester DC, Kramer PA. Int J Pharm. 1994;105:259–272. [Google Scholar]
- 53.Kronke M. Chem Phys Lipids. 1999;101:109–121. doi: 10.1016/s0009-3084(99)00059-6. [DOI] [PubMed] [Google Scholar]
- 54.Alonso A, Goni FM, Buckley JT. Biochemistry. 2000;39:14019–14024. doi: 10.1021/bi001739o. [DOI] [PubMed] [Google Scholar]
- 55.Rosenzweig HS, Rakhmanova VA, McIntosh TJ, MacDonald RC. Bioconjug Chem. 2000;11:306–313. doi: 10.1021/bc9901144. [DOI] [PubMed] [Google Scholar]


