Abstract
Kidney proximal tubule cells developed severe energy deficits during hypoxia/reoxygenation not attributable to cellular disruption, lack of purine precursors, the mitochondrial permeability transition, or loss of cytochrome c. Reoxygenated cells showed decreased respiration with complex I substrates, but minimal or no impairment with electron donors at complexes II and IV. This was accompanied by diminished mitochondrial membrane potential (ΔΨm). The energy deficit, respiratory inhibition, and loss of ΔΨm were strongly ameliorated by provision of α-ketoglutarate plus aspartate (αKG/ASP) supplements during either hypoxia or only during reoxygenation. Measurements of 13C-labeled metabolites in [3-13C]aspartate-treated cells indicated the operation of anaerobic pathways of αKG/ASP metabolism to generate ATP, yielding succinate as end product. Anaerobic metabolism of αKG/ASP also mitigated the loss of ΔΨm that occurred during hypoxia before reoxygenation. Rotenone, but not antimycin or oligomycin, prevented this effect, indicating that electron transport in complex I, rather than F1F0-ATPase activity, had been responsible for maintenance of ΔΨm by the substrates. Thus, tubule cells subjected to hypoxia/reoxygenation can have persistent energy deficits associated with complex I dysfunction for substantial periods of time before onset of the mitochondrial permeability transition and/or loss of cytochrome c. The lesion can be prevented or reversed by citric acid cycle metabolites that anaerobically generate ATP by intramitochondrial substrate-level phosphorylation and maintain ΔΨm via electron transport in complex I. Utilization of these anaerobic pathways of mitochondrial energy metabolism known to be present in other mammalian tissues may provide strategies to limit mitochondrial dysfunction and allow cellular repair before the onset of irreversible injury by ischemia or hypoxia.
Structural, biochemical, and functional abnormalities of mitochondria are widely believed to be important pathogenetic factors that underlie ischemic or hypoxic cell injury (1). Two defects recently have gained credence and captured attention. One is characterized by pore formation in the inner mitochondrial membrane, deenergization, and high-amplitude swelling (mitochondrial permeability transition or MPT) (1–4). The second involves leakage of cytochrome c from the intermembrane space into the cytosol (5). Cytochrome c leakage may follow the MPT or occur independently. There is general agreement that these dramatic alterations result in cell death by necrosis and apoptosis in diverse types of cell injury, including those caused by hypoxia and ischemia (1, 3–5). However, the proximate events that lead to the MPT and loss of cytochrome c are unclear and are subjects of ongoing investigation.
We have reported that cells in freshly isolated kidney proximal tubules exhibit profound functional deficits of their mitochondria when they are reoxygenated after hypoxic incubation (6). The defect is characterized by failure of oxidative phosphorylation in cells that are otherwise intact as indicated by structural, biochemical, and functional criteria and is partially ameliorated by prior treatment with chemical inhibitors of the MPT (6), but not by antioxidants or redox state modification (J.M.W., unpublished data). We have now more completely defined this mitochondrial lesion that develops during hypoxia/reoxygenation (H/R) and show that it involves an abnormality of the respiratory chain and energization that precedes the MPT and can be prevented or reversed by anaerobic metabolism of specific citric acid cycle metabolites.
Methods
Isolation of Tubules.
Rabbit kidney proximal tubules were isolated as described (6–8).
Experimental Procedure.
Incubation conditions generally followed our published protocols (6–8). Tubules were suspended at 3.0–5.0 mg of protein/ml in a 95% O2/5% CO2-gassed medium containing 110 mM NaCl, 2.6 mM KCl, 25 mM NaHCO3, 2.4 mM KH2PO4, 1.25 mM CaCl2, 1.2 mM MgCl2, 1.2 mM MgSO4, 5 mM glucose, 4 mM sodium lactate, 0.3 mM alanine, 5.0 mM sodium butyrate, 3% dialyzed dextran (T-40; Amersham Pharmacia), 0.5 mg/ml bovine gelatin (75 bloom), and 2 mM glycine. After 15 min of preincubation at 37°C, tubules were resuspended in fresh medium with experimental agents and regassed with either 95% O2/5% CO2 (controls) or 95% N2/5% CO2 (hypoxia). Hypoxic tubules were kept at pH 6.9 to simulate tissue acidosis during ischemia in vivo (6). After 60 min, samples were removed for analysis. The remaining tubules were pelleted and resuspended in fresh 95% O2/5% CO2-gassed, pH 7.4 medium with experimental agents as needed. Sodium butyrate was replaced with 2.0 mM sodium heptanoate, and, to ensure availability of purine precursors for ATP resynthesis, 250 μM AMP was added (6). After 60 min of reoxygenation, samples were removed again for analysis. Cell ATP and lactate dehydrogenase release was measured and ultrastructural studies were done as described previously (8).
Assessment of Changes in Mitochondrial Membrane Potential (ΔΨm).
JC-1 [5,5′,6,6′-tetrachloro-1,1′,3,3′-tetraethylbenzimidazocarbocyanine iodide (Molecular Probes)] (9) was added to the tubule suspension at 5 μg/ml, and incubation was continued in the dark for 15 min. Tubules then were pelleted and washed three times in ice-cold isotonic saline-Hepes. Intracellular distribution of the dye was assessed by confocal microscopy. Fluorescence in suspension was measured at 488-nm excitation/510- to 625-nm emission (9).
Tubule Respiration.
Respiration was measured with a Clark oxygen electrode (7). For intact tubules, a basal rate was obtained, followed by stimulation with 15 μM carbonyl cyanide m-chlorophenylhydrazone. For permeabilized cells, rates were measured on tubules resuspended in an intracellular buffer consisting of 110 mM KCl, 30 mM Tris-Hepes (pH 7.4), 5 mM potassium phosphate, 2 mM EGTA, 1 mM ADP, 0.25 mg/ml digitonin, and either 4 mM of the potassium salts of glutamate + malate, 4 mM potassium succinate, or 4 mM potassium ascorbate plus 0.3 mM N,N,N′N′-tetramethyl-p-phenylenediamine.
Determination of 13C-Labeled Metabolites.
13C-labeled citric acid cycle metabolites of [3-13C]aspartate (MSD Isotopes) were analyzed by GC-MS (10). Organic acids in neutralized trichloroacetic acid extracts were converted to t-butyldimethylsilyl derivatives for measurement of 13C isotopic enrichment. The mole percent excess of 13C in the M+1 and M+2 isotopomers labeled at one or two carbons respectively was monitored (10, 11). Concentrations of citric acid cycle intermediates were determined by an isotope dilution approach (10). After measuring 13C enrichment in M+1 and M+2 isotopomers, a 300-μl aliquot of the sample was spiked with 20 μl of a mixture of unlabeled succinate (0.5 pmol/ml) and citrate (0.7 pmol/ml). Then, measurements of 13C isotopic abundance in M+1 and M+2 isotopomers in each sample were repeated. Concentrations of succinate and citrate in the sample were calculated as described (10). A comparative determination of succinate was performed by using a standard concentration curve of succinate and GC-MS analysis as above. The sum of the area under m/z 289, 290, 291, and 292 ions (t-butyldimethylsilyl derivatives of succinate) was recorded and plotted against the corresponding concentration by using linear regression analysis. The production of 13C-labeled metabolite was calculated as 13C nmol/mg protein = C × MPE/100, where C is concentration (nmol/mg protein) and MPE is mole percent excess. Values obtained for total succinate production by this approach were verified by enzymatic assay of succinate with excellent agreement.
Reagents.
Reagents were from Sigma unless otherwise indicated. 5-n-Nonyl-6-hydroxy-4,7-dioxobenzothiazol was kindly provided by Bernard Trumpower (Department of Biochemistry, Dartmouth Medical School). Agents in ethanol or DMSO were delivered from ≥1,000× stock solutions.
Statistics.
Values are given as mean ± SE. The N values indicate the numbers of separate tubule preparations studied. ANOVA for repeated measure or independent group designs was used as appropriate. Individual group comparisons for multigroup studies were made with the Neuman–Keuls test for multiple comparisons (SigmaStat; SPSS, Chicago). P < 0.05 was considered to be statistically significant.
Results and Discussion
Mitochondrial Dysfunction in Reoxygenated Tubules.
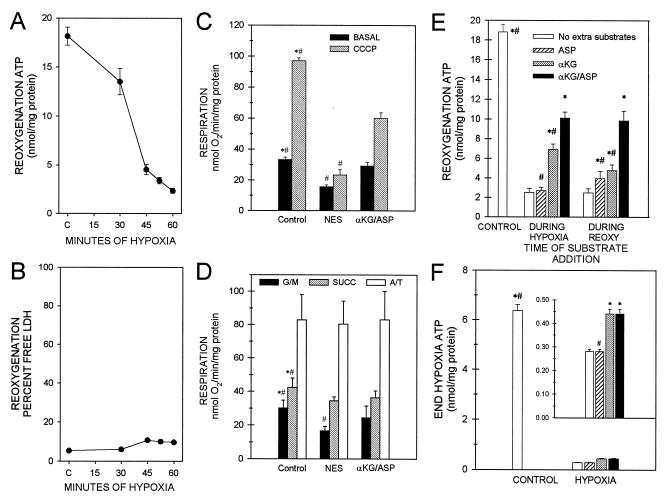
Proximal tubules showed energy deficits during reoxygenation after hypoxia (Fig. 1A). After 45 min of hypoxia, levels of ATP during 60 min of reoxygenation recovered to only 20% of control values, and recovery after 52.5 and 60 min of hypoxia was impaired further. These defects of ATP synthesis occurred despite the presence of adequate amounts of substrates and purine precursors that are considered to be optimal for proximal tubule energy metabolism (6–8). Moreover, inclusion of glycine in the incubation medium preserved plasma membrane integrity (Fig. 1B) and overall cellular structure (6–8), ensuring that hypoxia-induced mitochondrial dysfunction was not a “postmortem” secondary alteration caused by cell death.
Figure 1.
Energy deficit after H/R and its amelioration by αKG/ASP. (A) Cell ATP after 30, 45, 52.5, or 60 min of hypoxia followed by 60-min reoxygenation. C, control incubated under oxygenated conditions for 135 min. N ≥ 5 for each group. All H/R ATP values are significantly different from C and the preceding duration of hypoxia. (B) Minimal LDH release to the medium by cells depicted in A. (C) Basal and carbonyl cyanide-n-chlorophenylhydrazone (CCCP)-uncoupled respiration of intact tubules after 60-min hypoxia plus 60-min reoxygenation with either no extra substrate addition (NES) or 4 mM αKG/ASP during reoxygenation. N = 4; *, P < 0.05 vs. corresponding NES group; #, P < 0.05 vs. corresponding αKG/ASP group. (D) Respiration of digitonin-permeabilized tubules supported by 5 mM glutamate plus 5 mM malate (G/M), 5 mM succinate (SUCC), or 10 mM ascorbate plus 0.3 mM tetramethyl-p-phenylenediamine (A/T). Conditions and labeling are otherwise the same as for C. (E) Tubule cell ATP after 60-min hypoxia followed by 60-min reoxygenation with no extra substrate additions or αKG/ASP (4 mM each), αKG alone, or ASP alone during 60 min of hypoxia before reoxygenation or during only 60 min of reoxygenation (REOXY). N ≥ 8; *, P < 0.05 vs. corresponding no extra substrate group; #, P < 0.05 vs. corresponding αKG/ASP group. (F) ATP at the end of hypoxia before reoxygenation under the same conditions as E. Groups are labeled exactly as for E. Controls have lower ATP levels than controls in E because exogenous AMP supplements, which increase cell ATP (6), were provided only during reoxygenation.
Basal and uncoupled respiratory rates of intact tubules were both inhibited at the end of 60 min of hypoxia plus 60 min of reoxygenation (Fig. 1C). Measured in digitonin-permeabilized tubules in the presence of electron donors to respiratory chain complex I (glutamate/malate), complex II (succinate), or complex IV (ascorbate/tetramethyl-p-phenylenediamine) (12–14), respiration was most severely suppressed with glutamate/malate and only minimally affected or unchanged with succinate or ascorbate/tetramethyl-p-phenylenediamine (Fig. 1D). These observations are consistent with the predominant impairment of complex I-dependent respiration reported for mitochondria isolated from ischemic tissues (1, 15). They also show that cytochrome c-dependent respiration by complex IV was intact (“A/T” values, Fig. 1D). Consistent with this, release of cytochrome c from mitochondria into the cytosol was minimal during H/R (not shown).
Prevention and Reversal of Hypoxia-Induced Mitochondrial Dysfunction by Anaerobic Metabolism of α-Ketoglutarate and Aspartate.
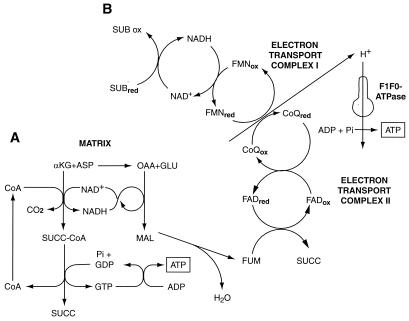
During ischemia and other insults, ATP production by anaerobic glycolysis can prevent generalized cell injury (16) and, via reverse operation of the inner membrane ATP synthase (F1F0-ATPase), maintain mitochondrial energization and prevent the MPT (17). However, anaerobic glycolysis eventually is suppressed during myocardial ischemia (18) and is inherently limited or absent in other cells such as neurons (19) and kidney proximal tubules (20). Anaerobic pathways of mitochondrial metabolism as summarized in Fig. 2 contribute to hypoxia resistance in lower species and diving mammals and have the potential to support ATP production during hypoxia in mammalian heart and kidney and to modify injury (21–26). By virtue of its local generation, ATP formed in the mitochondrial matrix, even in very small amounts, could protect against or repair damage to respiratory components during hypoxia and/or reoxygenation. We tested this possibility by providing α-ketoglutarate + aspartate (αKG/ASP) (Fig. 1 C– F). Supplementation with αKG/ASP during either 60 min of hypoxia or during the subsequent 60-min reoxygenation strikingly increased the recovery of cell ATP (Fig. 1E). Respiratory rates of both intact (Fig. 1C) and digitonin-permeabilized tubules (Fig. 1D) were improved by αKG/ASP. αKG or aspartate alone was of less benefit (Fig. 1 E and F).
Figure 2.
Metabolic pathways for anaerobic generation of ATP promoted by αKG/ASP. (A) During hypoxia, αKG is metabolized to succinate (SUCC), forming GTP by substrate-level phosphorylation. GTP is transphosphorylated to ATP. Transamination of αKG to glutamate by aspartate provides oxalacetate (OAA). Conversion of OAA to malate (MAL) and fumarate (FUM) is linked to decarboxylation of αKG by the NAD-NADH redox couple (22). (B) Reduction of fumarate to succinate is coupled to oxidation of reduced ubiquinone (CoQred) generated via NADH by reducing equivalents from substrate (SUB) oxidation in the citric acid cycle (e.g., A) (21). This process anaerobically maintains electron flux and proton extrusion in complex I with ATP production by the mitochondrial inner membrane F1F0-ATPase. (Figure modified from ref. 25 with permission.)
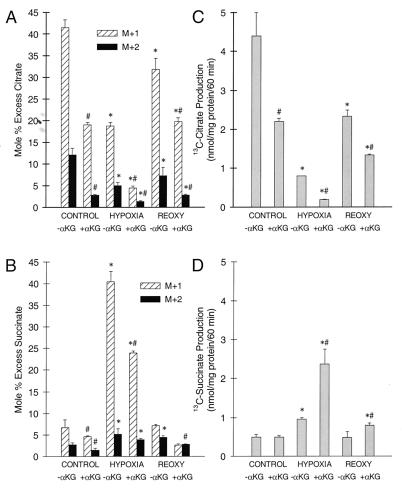
Tubules provided with αKG/ASP or αKG alone showed small, but consistently reproducible increments of cell ATP at the end of hypoxia (Fig. 1F); aspartate alone was ineffective. To directly assess activity of the potential pathways (Fig. 2) for anaerobic generation of ATP, tubules were incubated with either [3-13C]aspartate alone or [3-13C]aspartate plus unlabeled αKG followed by GC-MS measurement of metabolic products. Data were obtained for isotopic enrichment and total production of 13C metabolites of citrate, succinate, fumarate, and malate. Because fumarate and malate underwent substantial cytosolic metabolism, only citrate and succinate are shown for the purposes of the present analysis (Fig. 3). Succinate is particularly informative because it is an obligate product of both pathways for anaerobic ATP production (Fig. 2).
Figure 3.
Isotopic enrichment studies with [3-13C]aspartate. Tubules were incubated for 60 min with 4 mM [3-13C]aspartate without or with 4 mM unlabeled αKG (−αKG, +αKG) during control incubation, hypoxia, or reoxygenation after 60-min hypoxia. A and B show 13C isotopic enrichments (Mole % Excess) into citrate and succinate, respectively. M+1 and M+2 are the proportions enriched at one and two carbons. C and D are mass measurements of total 13C citrate and succinate formed. N ≥ 3; *, P < 0.05 vs. corresponding control; #, P < 0.05 vs. corresponding −αKG group.
With [3-13C]aspartate alone, 13C enrichments in both the M+1 and M+2 isotopomers of citrate during hypoxia were lower than in control tubules or in tubules supplemented only during reoxygenation (Fig. 3A). This indicates that hypoxia, as expected, curtailed the flux of [3-13C]oxalacetate derived from [3-13C]aspartate in the direction: oxalacetate → citrate → αKG. In contrast, enrichments of 13C in succinate were higher during hypoxia and returned to control levels during reoxygenation (Fig. 3B). These observations suggest that hypoxia augmented the metabolism of oxalacetate in the reverse direction, oxalacetate → malate → fumarate → succinate, and that the newly formed succinate accumulated. Further evidence for reverse operation of the citric acid cycle is provided by the observation that addition of unlabeled αKG during hypoxia lowered 13C enrichment in the M+1 and M+2 isotopomers of citrate by >75%, but by only 41% in M+1 and M+2 of succinate.
Mass measurements of 13C-labeled metabolites showed that formation of [13C]citrate during hypoxia was decreased substantially (Fig. 3C), whereas formation of [13C]succinate was increased ≈2-fold relative to control and was increased further ≈6-fold relative to control by addition of αKG (Fig. 3D). That αKG addition tripled the absolute amount of [13C]succinate formed relative to the amount seen with supplemental [13C]aspartate alone can be explained only by reverse operation of the citric acid cycle.
Mitochondrial Ultrastructural Alterations.
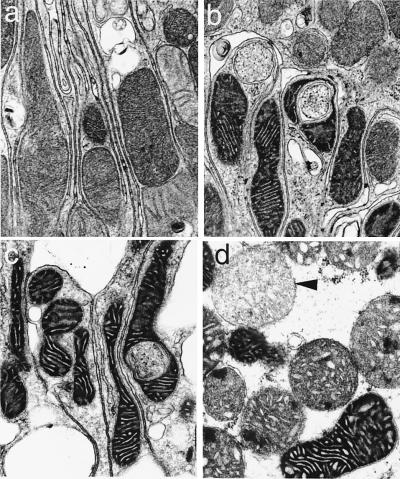
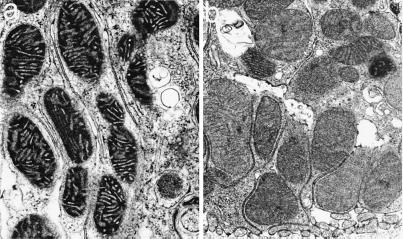
Mitochondria of control tubules had “orthodox” configurations (Fig. 4a) seen in normal tissues (27, 28). Early during hypoxia all mitochondria showed shrinkage, matrix condensation, and wide cristae as seen typically during electron transport blockade caused by chemical inhibitors or lack of O2 (27, 28). By 60 min, most mitochondria were still condensed, but a variable number had begun to swell (Fig. 4b). With reoxygenation in the absence of αKG/ASP, the majority maintained or resumed a condensed configuration and continued in that state for 60 min (Fig. 4c). Only a small minority of cells had mitochondria with “high-amplitude” swelling (Fig. 4d) as expected during a complete MPT (2). Addition of αKG/ASP caused mitochondria to remain condensed throughout hypoxia (Fig. 5a). With reoxygenation in the continued presence of αKG/ASP, mitochondria reverted to orthodox states (Fig. 5b). Importantly, addition of αKG/ASP only during reoxygenation also induced the majority of mitochondria to assume normal orthodox configurations (not illustrated). If reoxygenation after 60 min of hypoxia was extended to 120 min without αKG/ASP, a larger proportion of cells showed high-amplitude swelling of mitochondria and also displayed features of necrotic cell death. These changes were prevented by αKG/ASP (not shown).
Figure 4.
Mitochondrial ultrastructural changes. (a) Control. (b) Sixty-minute hypoxia. (c and d) Sixty-minute hypoxia followed by 60-min reoxygenation. Arrowhead, mitochondrion with high-amplitude swelling. (×24,100.)
Figure 5.
Effect of αKG/ASP on mitochondrial ultrastructure. (a) Sixty-minute hypoxia with 4 mM αKG/ASP. (b) Sixty-minute hypoxia followed by 60-min reoxygenation with 4 mM αKG/ASP during hypoxia and reoxygenation. (×24,100.)
ΔΨm Changes During Reoxygenation.
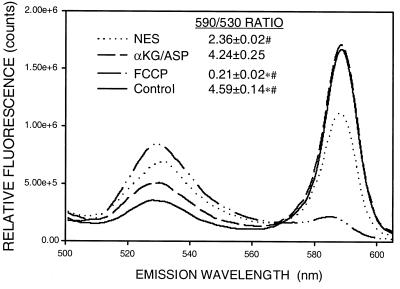
The large increase of permeability to ions resulting from formation of nonselective pores with size-exclusion limits of ≈1,500 Da in the inner membrane during a complete MPT precludes maintenance of ΔΨm (1–4). Mitochondrial condensation during hypoxia and reoxygenation (Fig. 4c) and its reversal to the orthodox state by αKG/ASP (Fig. 5b) strongly suggested that the MPT did not develop in these tubules. However, reversible and solute selective forms of the transition and, possibly, even complete MPT may occur without high-amplitude swelling (29, 30). To further assess the nature of the energy deficit and involvement of the MPT, we monitored changes in ΔΨm by using the potentiometric, fluorescent dye JC-1 (9, 31). At high-membrane potentials characteristic of energized mitochondria, JC-1 accumulates sufficiently to aggregate, resulting in large, red (590-nm) shifts in the emission maximum. At lower potentials, the dye exists as a green fluorescent (530-nm) monomer (9).
Both green and red JC-1 fluorescence in control tubules was punctate and basolateral, consistent with mitochondrial localization (Fig. 6a). During reoxygenation without αKG/ASP (Fig. 6b), green fluorescence was stronger and red fluorescence was much weaker than in controls. Both signals retained a mitochondrial distribution. With αKG/ASP during reoxygenation, fluorescence was restored to the control pattern (Fig. 6c). This behavior is shown quantitatively in Fig. 7, which illustrates typical emission scans of JC-1-loaded tubules in suspension for the same experimental conditions as shown in Fig. 6 as well as after complete deenergization with the uncoupler, carbonyl cyanide p-trifluoromethoxyphenylhydrazone (FCCP). Although not suitable for precise ratiometric quantitation (31), ratios of JC-1 fluorescence at the two wavelengths (590 nm/530 nm) enhance the dynamic range of the ΔΨm-dependent changes and decrease variability from differences in loading and numbers of cells between samples (9). Calculated ratios for each group are given in Fig. 7. The data show that ΔΨm was decreased during reoxygenation without αKG/ASP, but was distinctly higher than in tubules deenergized with FCCP. αKG/ASP restored ΔΨm to nearly normal.
Figure 6.
Mitochondrial uptake of JC-1. (a) Control. (b) Sixty-minute hypoxia plus 60-min reoxygenation. (c) Sixty-minute hypoxia plus 60-min reoxygenation with 4 mM αKG/ASP during reoxygenation. a– c show JC-1-loaded tubules viewed simultaneously by confocal microscopy for green fluorescence (488-nm excitation, 522-nm emission, Left) and red fluorescence (568-nm excitation, 585-nm emission, Right). (Bar = 10 μm.)
Figure 7.
Quantitative changes of JC-1 fluorescence. Typical scans (488-nm excitation and 510- to 625-nm emission) of JC-1-loaded tubules under control conditions, in the presence of 5 μM FCCP plus 5 mM glycine for 15 min, or for 60-min hypoxia plus 60-min reoxygenation with either no extra substrates (NES) or 4 mM αKG/ASP during reoxygenation. Values next to the legends (Inset) are the ratios of the signal intensities at 590 and 530 nm for groups studied under each condition, N ≥ 8. *, P < 0.05 vs. corresponding NES group; #, P < 0.05 vs. corresponding αKG/ASP group.
Enhancement of ΔΨm During Hypoxia by αKG/ASP.
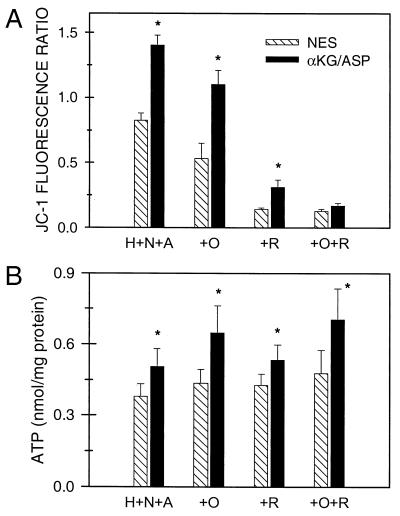
To determine whether αKG/ASP was maintaining ΔΨm during hypoxia without artifactual reenergization during the measurements, we studied hypoxia in combination with two inhibitors of electron transport in complex III, antimycin and 5-n-nonyl-6-hydroxy-4,7-dioxobenzothiazol.¶ This approach also allowed us to test the extent to which anaerobic electron transport in complexes I and II (Pathway B in Fig. 2) was necessary to maintain ΔΨm. Tubules rapidly lost ΔΨm during the first 15 min of hypoxia followed by stabilization between 15 and 60 min (not shown). The JC-1 590 nm/530 nm fluorescence ratio at 60 min of 0.83 (Fig. 8A) was well below that of reoxygenated tubules, but distinctly higher than that of tubules deenergized with FCCP (compare values with those in Fig. 7). αKG/ASP-treated tubules had significantly higher fluorescence ratios (Fig. 8A) and maintained significantly higher cell ATP levels (Fig. 8B). The effects of αKG/ASP on JC-1 fluorescence were nearly maximal when the substrates were at 0.5-mM concentrations; corresponding effects on ATP were maximal at 1 mM (not shown).
Figure 8.
Effect of αKG/ASP on ΔΨm during hypoxia. (A) JC-1 fluorescence ratios (590/530 nm) after hypoxia for 60 min at pH 6.9 in the presence of 20 μM antimycin A and 2 μM 5-n-nonyl-6-hydroxy-4,7-dioxobenzothiazol (H+N+A) with no extra substrate (NES) or 4 mM αKG/ASP. In separate groups, the medium additionally contained 15 μM oligomycin (+O), 10 μM rotenone (+R), or rotenone plus oligomycin (+R+O). N ≥ 4; *, P < 0.05 vs. corresponding NES group. (B) ATP levels for the experiments depicted in A.
Pathway A shown in Fig. 2 for anaerobic production of ATP by substrate-level phosphorylation does not require ATP-synthase activity of the inner mitochondrial membrane F1F0-ATPase. Generation of ATP by pathway B in Fig. 2, which is mediated by anaerobic electron transport in complexes I and II, does require the ATP synthase. The F1F0-ATPase also can consume ATP during oxygen deprivation or metabolic inhibition to support ΔΨm (1, 16, 17). Addition during hypoxia of the ATP synthase/F1F0-ATPase inhibitor, oligomycin (12), slightly lowered ΔΨm and increased ATP (Fig. 8). More importantly, however, oligomycin did not eliminate the ability of αKG/ASP to increase either ΔΨm or ATP (Fig. 8), indicating that reverse activity of the F1F0-ATPase was not primarily responsible for maintenance of ΔΨm and that ATP synthase activity was not required for the αKG/ASP-induced ATP production.
To assess the role of anaerobic respiration in complexes I and II in the maintenance of ΔΨm (pathway B in Fig. 2), we tested the complex I inhibitor, rotenone (Fig. 8). Addition of rotenone decreased the JC-1 fluorescence ratio to a degree comparable to that seen with the complete deenergization produced by uncouplers (compare with FCCP values in Fig. 7) and strongly blunted the incremental effect of αKG/ASP (Fig. 8A). The effect of αKG/ASP was blocked entirely by the combination of rotenone plus oligomycin. Neither rotenone nor rotenone plus oligomycin affected the increments of ATP produced by αKG/ASP (Fig. 8B). These observations indicate that anaerobic electron transport through complex I can account largely for maintenance of residual ΔΨm during hypoxia and for the increases of ΔΨm produced by αKG/ASP, but does not contribute significantly to the αKG/ASP-induced ATP production.
Conclusions
Our studies demonstrate a persistent respiratory defect for complex I-dependent substrates during reoxygenation after hypoxia. The defect is associated with incomplete recovery of ΔΨm and reflected ultrastructurally by a condensed mitochondrial configuration without progression to a complete MPT or cytochrome c release. Together, these abnormalities are the basis for profound energy deficits that occur in otherwise viable kidney proximal tubule cells subjected to H/R. This mitochondrial lesion is prevented and reversed powerfully by supplementation with αKG/ASP via separate but complementary effects. One effect, anaerobic ATP production, is due to substrate-level phosphorylation (pathway A in Fig. 2) and does not require electron transport. On the other hand, increases of ΔΨm result mostly from anaerobic respiration in complexes I and II (pathway B in Fig. 2). Mitochondrial abnormalities associated with ischemia/reperfusion include defects in the adenine nucleotide translocase and the F1F0-ATPase (1). Whether these changes are also affected by αKG/ASP and the mechanisms for the component of injury that occurs despite the presence of αKG/ASP remains to be assessed. However, our data show that amelioration of impaired substrate flux through complex I and ATP generation by αKG/ASP is sufficient to initiate events that greatly improve mitochondrial function with a major impact on overall cellular recovery. Mitochondrial condensation, the structural hallmark of the lesion in the present studies, is seen during ischemia/reperfusion of the kidney in vivo (28). Circulating (10–30 μM) and kidney tissue (50–300 μM) levels of αKG are low (ref. 33 and unpublished data). Strong effects of αKG/ASP were seen at concentrations down to 0.5–1 mM in the present studies. Although these αKG concentrations are above the endogenous tissue and serum levels, they are attainable in vivo with infusion of αKG. The anaerobic metabolic pathways depicted in Fig. 2 are known to function in at least two mammalian tissues that are highly susceptible to ischemic damage, heart and kidney, and benefits from them during injury has been suggested (21–26, 34). The present studies indicate a central, upstream role for these pathways of anaerobic metabolism in modifying mitochondrial susceptibility to damage. Because mitochondrial pathology can determine the progression of cell injury to a state of irreversibility, these metabolic manipulations merit reconsideration for rescuing tissues injured by ischemia and related insults.
Acknowledgments
We appreciate the assistance of Julie Davis with the confocal microscopy and oximeter measurements. These studies were supported by National Institutes of Health Grants DK34275 and DK39255 and Office of Naval Research Grant N00014–95-1–584 to J.M.W., National Institutes of Health Grant DK-37139 to M.A.V., and National Institutes of Health Grant DK-53761 to I.N.
Abbreviations
- αKG/ASP
α-ketoglutarate + aspartate
- FCCP
carbonyl cyanide p-trifluoromethoxyphenylhydrazone
- H/R
hypoxia/reoxygenation
- ΔΨm
mitochondrial membrane potential
- MPT
mitochondrial permeability transition
Footnotes
5-n-Nonyl-6-hydroxy-4,7-dioxobenzothiazol, a synthetic analogue of ubiquinone, inhibits the cytochrome bc1 complex in the same manner, but with a slightly higher ki than the more extensively studied undecyl form (32) of the compound (Bernard Trumpower, personal communication).
References
- 1.Di Lisa F, Bernardi P. Mol Cell Biochem. 1998;184:379–391. [PubMed] [Google Scholar]
- 2.Gunter T E, Pfeiffer D R. Am J Physiol Cell Physiol. 1990;258:C755–C786. doi: 10.1152/ajpcell.1990.258.5.C755. [DOI] [PubMed] [Google Scholar]
- 3.Zoratti M, Szabo I. Biochim Biophys Acta. 1995;1241:139–176. doi: 10.1016/0304-4157(95)00003-a. [DOI] [PubMed] [Google Scholar]
- 4.Lemasters J J, Nieminen A L, Qian T, Trost L C, Elmore S P, Nishimura Y, Crowe R A, Cascio W E, Bradham C A, Brenner D A, et al. Biochim Biophys Acta Bio-Energetics. 1998;1366:177–196. doi: 10.1016/s0005-2728(98)00112-1. [DOI] [PubMed] [Google Scholar]
- 5.Kroemer G, Dallaporta B, Resche-Rigon M. Annu Rev Physiol. 1998;60:619–642. doi: 10.1146/annurev.physiol.60.1.619. [DOI] [PubMed] [Google Scholar]
- 6.Weinberg J M, Roeser N F, Davis J A, Venkatachalam M A. Kidney Int. 1997;52:140–151. doi: 10.1038/ki.1997.313. [DOI] [PubMed] [Google Scholar]
- 7.Weinberg J M, Davis J A, Abarzua M, Rajan T. J Clin Invest. 1987;80:1446–1454. doi: 10.1172/JCI113224. [DOI] [PMC free article] [PubMed] [Google Scholar]
- 8.Sogabe K, Roeser N F, Davis J A, Nurko S, Venkatachalam M A, Weinberg J M. Am J Physiol. 1996;271:F292–F303. doi: 10.1152/ajprenal.1996.271.2.F292. [DOI] [PubMed] [Google Scholar]
- 9.Chen L B, Smiley S T. In: Probing Mitochondrial Membrane Potential in Living Cells by a J-Aggregate-Forming Dye. Mason W T, editor. New York: Academic; 1994. pp. 124–132. [Google Scholar]
- 10.Nissim I, Yudkoff M, Brosnan J T. J Biol Chem. 1996;271:31234–31242. doi: 10.1074/jbc.271.49.31234. [DOI] [PubMed] [Google Scholar]
- 11.Brosnan J T, Brosnan M E, Charron R, Nissim I. J Biol Chem. 1996;271:16199–16207. doi: 10.1074/jbc.271.27.16199. [DOI] [PubMed] [Google Scholar]
- 12.Nicholls D G. Bioenergetics: An Introduction to the Chemiosmotic Theory. London: Academic; 1982. [Google Scholar]
- 13.Packer L, Jacobs E E. Biochem Biophys Acta. 1962;57:371–373. doi: 10.1016/0006-3002(62)91132-0. [DOI] [PubMed] [Google Scholar]
- 14.Weinberg J M, Harding P G, Humes H D. J Biol Chem. 1982;257:60–67. [PubMed] [Google Scholar]
- 15.Rouslin W. Am J Physiol. 1983;244:H743–H748. doi: 10.1152/ajpheart.1983.244.6.H743. [DOI] [PubMed] [Google Scholar]
- 16.Nieminen A-L, Saylor A K, Tesfai S A, Herman B, Lemasters J J. Biochem J. 1995;307:99–106. doi: 10.1042/bj3070099. [DOI] [PMC free article] [PubMed] [Google Scholar]
- 17.Simbula G, Glascott P A, Jr, Akita S, Hoek J B, Farber J L. Am J Physiol. 1997;273:C479–C488. doi: 10.1152/ajpcell.1997.273.2.C479. [DOI] [PubMed] [Google Scholar]
- 18.Neely J R, Grotyohann L W. Circ Res. 1984;55:816–824. doi: 10.1161/01.res.55.6.816. [DOI] [PubMed] [Google Scholar]
- 19.Schurr A, Payne R S, Miller J J, Rigor B M. Methods. 1999;18:117–126. doi: 10.1006/meth.1999.0765. [DOI] [PubMed] [Google Scholar]
- 20.Ruegg C E, Mandel L J. Am J Physiol. 1990;259:F164–F175. doi: 10.1152/ajprenal.1990.259.1.F164. [DOI] [PubMed] [Google Scholar]
- 21.Sanadi D R, Fluharty A L. Biochemistry. 1963;2:523–528. doi: 10.1021/bi00903a023. [DOI] [PubMed] [Google Scholar]
- 22.Hunter E F., Jr J Biol Chem. 1949;177:361–371. [PubMed] [Google Scholar]
- 23.Penney D G, Cascarno J. Biochem J. 1970;118:221–227. doi: 10.1042/bj1180221. [DOI] [PMC free article] [PubMed] [Google Scholar]
- 24.Hochachka P W, Owen T G, Allen J F, Whittow G C. Comp Biochem Physiol B. 1975;50:17–22. doi: 10.1016/0305-0491(75)90292-8. [DOI] [PubMed] [Google Scholar]
- 25.Gronow G H J, Cohen J J. Am J Physiol. 1984;247:F618–F631. doi: 10.1152/ajprenal.1984.247.4.F618. [DOI] [PubMed] [Google Scholar]
- 26.Pisarenko O I. Clin Exp Pharmacol Physiol. 1996;23:627–633. doi: 10.1111/j.1440-1681.1996.tb01748.x. [DOI] [PubMed] [Google Scholar]
- 27.Hackenbrock C R, Rehn T G, Weinbach E C, Lemasters J J. J Cell Biol. 1971;51:123–137. doi: 10.1083/jcb.51.1.123. [DOI] [PMC free article] [PubMed] [Google Scholar]
- 28.Glaumann B, Glaumann H, Berezesky I K, Trump B F. Virchows Arch. 1977;24:1–18. [PubMed] [Google Scholar]
- 29.Reed D J, Savage M K. Biochim Biophys Acta Mol Basis Dis. 1995;1271:43–50. doi: 10.1016/0925-4439(95)00008-r. [DOI] [PubMed] [Google Scholar]
- 30.Ichas F, Mazat J P. Biochim Biophys Acta Bio-Energetics. 1998;1366:33–50. doi: 10.1016/s0005-2728(98)00119-4. [DOI] [PubMed] [Google Scholar]
- 31.Di Lisa F, Blank P S, Colonna R, Gambassi G, Silverman H S, Stern M D, Hansford R G. J Physiol (London) 1995;486:1–13. doi: 10.1113/jphysiol.1995.sp020786. [DOI] [PMC free article] [PubMed] [Google Scholar]
- 32.Trumpower B L, Haggerty J G. J Bioenerg Biomembr. 1980;12:151–164. doi: 10.1007/BF00744680. [DOI] [PubMed] [Google Scholar]
- 33.Burlina A. In: Methods of Enzymatic Analysis. 3rd Ed. Bergmeyer H U, Bergmeyer J, Grabl M, editors. Weinheim, Germany: VCH; 1985. [Google Scholar]
- 34.Wiesner R H, Rosen P, Grieshaber M K. Biochem Med Met Biol. 1988;40:19–34. doi: 10.1016/0885-4505(88)90100-4. [DOI] [PubMed] [Google Scholar]


