Abstract
Clear cell sarcoma of soft tissue (CCSST) represents a highly malignant tumor of the musculoskeletal system that is characterized by the chromosomal translocation t(12;22)(q13;q12) of the Ewing sarcoma gene (EWSR1) and activating transcription factor 1 (ATF1). In a former microarray expression study, we identified ERBB3, a member of the epidermal growth factor receptor (EGFR) family, as a promising new diagnostic marker in the differential diagnosis of CCSST. Here we show that, besides ErbB3, all CCSST cell lines (n = 8) also express the ErbB2 receptor or the ErbB4 receptor, representing an adequate coreceptor of ErbB3. The phosphorylation status of ErbB3 revealed these receptor pairs to be either constitutively activated in CCSST cells with high neuregulin-1 (NRG1) expression (n = 4) or activatable by exogenic NRG1 in cells showing low amounts of NRG1 mRNA (n = 4). Exogenous NRG1 stimulated the growth of a subset of CCSST cells but did not affect the kinetics of another subset. This difference was not strictly dependent on endogenous NRG1 expression; however, the growth-inhibiting effect of the pan-ErbB tyrosine kinase inhibitor CI-1033 or PD158780 clearly correlated with NRG1 expression indicating an autocrine growth stimulation loop, which may constitute an interesting target of new therapeutic strategies in this tumor entity.
Keywords: Clear cell sarcoma of soft tissue, CGH, ERBB, neuregulin, tyrosine kinase
Introduction
Clear cell sarcoma of soft tissue (CCSST) is a rare malignancy of the musculoskeletal system that mainly affects adolescents and young adults [1]. Because this entity usually shows a characteristic melanocytic differentiation and is commonly associated with tendons and aponeuroses, the tumor is also termed malignant melanoma of soft parts [2]. Tumor cells are characterized by the presence of a balanced t(12;22)(q13;q12) translocation: the result is a fusion between the Ewing sarcoma gene (EWSR1) and the activating transcription factor 1 (ATF1) gene, which permits the expression of an EWS-ATF1 oncoprotein [3].
The resistance of this tumor entity to chemotherapeutic drugs that are effective in other soft tissue tumors constitutes the major problem in the treatment of CCSST [4,5]. To characterize this tumor at the molecular level and to screen for new therapeutic options, Schaefer et al. [6] and Segal et al. [7] examined CCSST by expression profile analysis. Both primary tumor tissues from CCSST patients and cell lines derived from these tumors could be shown to constitutively overexpress ERBB3 (v-erb-B2 erythroblastic leukemia viral oncogene homolog 3), which belongs to the epidermal growth factor receptor (EGFR) tyrosine kinase family.
The human EGFR family of receptor tyrosine kinases controls critical pathways involved in the differentiation, growth, division, and motility of normal epithelial cells (reviewed in Casalini et al. [8]). Moreover, in many types of cancer, the process of malignant transformation and progression involves an uncontrolled activation of these receptors and their corresponding ligands [9].
Among this family of membrane-bound tyrosine kinase receptors, which, in general, can act either as homodimers or as heterodimers, ErbB2 and ErbB3 each plays an outstanding role because no natural ligand has yet been identified for ErbB2 and because ErbB3 has lost its tyrosine kinase activity (reviewed in Citri et al. [10]). Hence, in nontransformed tissue, both receptors are active only in the context of ErbB heterodimers.
The most prominent ligand of ErbB3, neuregulin-1, shows a high diversity of different isoforms resulting from three different promoters/start exons (NRG1 types I, II, and III), in combination with different C-terminal ends of the coding sequence and, in addition, a broad spectrum of alternative splicing. In the past, this diversity has led to some inconsistency in the literature that is related to the use of synonyms (type I: neu differentiation factor, NDF; heregulin, HRG; acetylcholine receptor-inducing activity, ARIA; type II: glial growth factor, GGF; type III: sensory- and motor neuron-derived factor, SMDF) [11].
The NRG1/ERBB signaling axis has earned increased attention in cancer research because of the development of antibodies and small-molecule tyrosine kinase inhibitors that specifically target components of the HER-kinase axis for cancer therapy [12].
Therefore, the aim of this study is to systematically evaluate the impact of the neuregulin/ERBB signaling pathway on the growth behavior of CCSST and to obtain hints for the underlying mechanism of ERBB3 activation.
Materials and Methods
Tumor Cell Lines/Clinical Samples
Our experiments included 20 cell lines derived from typical solid (pediatric) tumors and three breast carcinomas listed in Table 1. All cell lines were maintained using standard procedures, as previously described [13]. The absence of Mycoplasma contamination was determined by the polymerase chain reaction (PCR)-based VenorGeM Mycoplasma PCR Detection Kit (Minerva Biolabs GmbH, Berlin, Germany), according to the manufacturer's protocols.
Table 1.
Characterization of Tumor Cell Lines.
| Name | Diagnosis | Source |
| STA-ET-1 | ET | P. F. Ambros (Vienna, Austria) |
| RM-82 | ET | F. van Valen (Muenster, Germany) |
| TC-71 | ET | T. J. Triche (Los Angeles, CA) |
| SK-N-Mc | ET | ATCC-LGC (Promochem, London, UK) |
| WE-68 | ET | F. van Valen |
| DTC1 | CCSST | K. A. Lee (Hong Kong, China) |
| GG-62 | CCSST | F. van Valen |
| KAO | CCSST | K. A. Lee |
| MA-OH1 | CCSST | S. Stegmaier (Stuttgart, Germany) |
| MST-1 | CCSST | S. K. Liao (Taoyuan, Taiwan) |
| MST-2 | CCSST | S. K. Liao |
| MST-3 | CCSST | S. K. Liao |
| Su-CCS1 | CCSST | K. A. Lee |
| IMR-5 | NB | A. Voigt (Jena, Germany) |
| KCN | NB | C. P. Reynolds (Los Angeles, CA) |
| SHEP-SF | NB | A. Eggert (Essen, Germany) |
| SK-N-SH | NB | ATCC |
| OST | OS | F. van Valen |
| SAOS-2 | OS | ATCC |
| SJSA-1 | OS | ATCC |
| BT-474 | BrCa | G. V. Minckwitz (Frankfurt, Germany) |
| MCF-7 | BrCa | F. van Valen |
| SK-BR-3 | BrCa | B. Brandt (Muenster, Germany) |
In addition to three cryopreserved tumor biopsies from CCSST patients, which we received for diagnostic purposes, three Ewing tumors (ET) [kindly provided by A. Kulozik (Heidelberg, Germany); M. Weiss (Cologne, Germany); and S. Burdach (Halle-Wittenberg, Germany)], two neuroblastomas (NB; U. Goebel, Düsseldorf, Germany), and one osteosarcoma (OS; R. Krauspe, Düsseldorf, Germany) were available for protein analysis.
Comparative Genomic Hybridization (CGH) of Tumor Cell Lines
To determine whether ERBB3 gene activation is related to DNA amplification, we performed chromosomal high-resolution (HR) CGH. In HR-CGH, CGH profiles obtained with standard experimental procedures [14] are evaluated with a specific algorithm that employs dynamic standard reference intervals instead of fixed thresholds [15]. This approach results in a three-fold increase in sensitivity compared to standard chromosomal CGH [16].
CGH was performed as described previously [17]. Briefly, sample DNA and normal male reference DNA (2 µg each) were directly labeled with Spectrum Green and Spectrum Red dUTP (Vysis, Downers Grove, IL), using nick translation. The amounts of DNase and DNA Polymerase (Invitrogen, Karlsruhe, Germany) and the reaction time were carefully adjusted to obtain labeled DNA fragment lengths of 500 to 2000 bp on a 1% agarose gel. Approximately 800 ng of labeled DNA and 20 µg of Cot1 DNA (Invitrogen) were hybridized to normal metaphase chromosomes (Vysis). Slides were hybridized for 3 to 4 days, washed, and counterstained with 4,6-diamidino-2-phenylindole (Sigma, München, Germany). CGH image capture was performed with a charge-coupled device camera on a Zeiss Axioscope epifluorescence microscope (Zeiss, Jena, Germany) using dedicated Cyto-vision software and hardware for HR-CGH (Applied Imaging Corporation, Santa Clara, CA). In each case, 15 metaphases were analyzed. After background fluorescence subtraction, the green/red ratio of each entire metaphase was normalized to 1.0. Average fluorescence ratios and 95% confidence intervals were calculated from at least 12 representative chromosomes and compared to dynamic standard reference intervals. Chromosomal regions were considered unbalanced if the 95% confidence intervals of tumor DNA hybridization did not overlap with dynamic standard reference intervals, thus being comparable to a statistical significance of P < .05.
Quantitative Reverse Transcription PCR (qRT-PCR) for NRG1
Total RNA was isolated with TRI reagent (Sigma, Taufkirchen, Germany), according to the manufacturer's protocol. To avoid contamination from genomic DNA, RNA was digested with RNase-free DNase (Promega, Mannheim, Germany).
One microgram of total RNA was used for synthesizing cDNA with First Strand synthesis kit (Amersham, Freiburg, Germany).
Levels of mRNA were determined by qRT-PCR using the LightCycler system (Roche Diagnostics, Mannheim, Germany) together with 2x SYBR Green Master Mix (Qiagen, Hilden, Germany). Oligonucleotide primers used in this study are listed in Table 2. For all primer pairs, an initial denaturation/activation at 95°C for 15 minutes was followed by 45 cycles of denaturation at 95°C for 15 seconds, annealing at 55°C for 25 seconds, and extension at 72°C for 20 seconds.
Table 2.
Oligonucleotide Primers Used for qRT-PCR.
Quantitative analysis was performed using the LightCycler Software (version 3.5). The specificity of PCR products was determined by the LightCycler Software's melting curve analysis. All quantitative measurements were performed as two independent replica.
Detection of Neuregulin-1 Variants
The sequences of the oligonucleotide primers used in RT-PCR are specified in Table 3. For the distinction of the different variants of neuregulin-1, a set of six primer combinations was employed, as listed in Table 4. This table also includes the expected RT-PCR product sizes.
Table 3.
Oligonucleotide Primers Used for RT-PCR.
| Gene | RefSeq/5′ Position | DNA Sequence (5′ -3′) |
| Type II-fw | NM_013962/964 | AACCTCAAGAAGGAGGTCAGC |
| Type I-fw | NM_004495/459 | CAAAGAAGGCAGAGGCAAAG |
| Type IIIF-fw | NM_013959/1113 | TCAGCAACTCAGCCACAAAC |
| γ-rv | NM_ 004495/1184 | TGATGCAACAAAATTGGAAAA |
| β3-rv | NM_013962/1562 | CAACAAGAAAGCAGCACCAA |
| α-rv | NM_013960/1579 | GCTTGGCGTGTGGAAATCTA |
Table 4.
Combination of Oligonucleotide Primers for the Determination of Neuregulin-1 Variants and Characterization of Products.
| Variant | Sense Primer | Antisense Primer | Product Size (bp) |
| Type II β3 | Type II-fw | β3-rv | 599 |
| Type I (α, β1, β2) | Type I-fw | α-rv | 1318–1460 |
| Type I β3 | Type I-fw | β3-rv | 748 |
| Type I γ | Type I-fw | γ-rv | 727 |
| Type III (α, β1) | Type III-fw | α-rv | 766, 781 |
| Type III β3 | Type III-fw | β3-rv | 311 |
After an initial denaturation step, PCR amplification was performed with 35 cycles under the following conditions: denaturation at 94°C for 30 seconds, annealing at 55°C for 45 seconds, and extension at 72°C for 90 seconds. PCR products were analyzed on 12% polyacrylamide gel by silver stain detection.
Determination of Allele-Specific Gene Expression
For polymorphism analysis of the SILV gene on chromosome 12q13, genomic DNA and the corresponding RNA transcripts were amplified by PCR and RT-PCR, respectively, using the primers 5′-GAGGGAACAAGCACTTCCTG-3′ (sense) and 5′-GGCACCTTCTCAGGTGTCAT-3′ (anti-sense). Cycle sequencing was performed with the BigDye Terminator system (PE Biosystems, Weiterstadt, Germany) using SILV-re primer, and reaction products were analyzed on an ABI PRISM 3700 sequencer (PE Biosystems). The RT-PCR of SILV RNA using heat-inactivated reverse transcriptase was included as negative control to prove the absence of genomic DNA.
Western Blot Analysis
For the isolation of proteins from cells or tissues, standard RIPA buffer was applied [50 mM Tris/HCl pH 7.4, 150 mM NaCl, 1% Nonidet P-40, 0.5% Na-deoxycholate, and 0.1% sodium dodecyl sulfate (SDS)] supplemented with NaF, NaVO4, and Complete mini (Roche Diagnostics). Proteins were separated on 7% SDS polyacrylamide gel electrophoresis (PAGE) or 4% to 20% PAGEr Duramide Precast Gels (Cambrex, Rockland, ME) and transferred onto prewetted Protran 0.2-µm nitrocellulose membranes (Schleicher and Schuell, Dassel, Germany). Benchmark prestained protein ladder (Invitrogen) was used for size estimation.
ErbB3 protein was detected by the ErbB3 (C-17) antibody (rabbit polyclonal IgG; Santa Cruz Biotechnology, Heidelberg, Germany), ErbB4 protein was detected by the HER4/ErbB4 (111B2) rabbit monoclonal antibody (New England Biolabs GmbH, Frankfurt, Germany), and ErbB2 oncoprotein was detected by the c-erb-B2 antibody (rabbit polyclonal IgG; DAKO, Glostrup, Denmark). Detection of protein tyrosine phosphorylation was performed with anti-phosphotyrosine clone 4G10 (mouse monoclonal IgG; upstate/Biomol, Hamburg, Germany). To ensure that equal amounts of proteins were loaded, detection of α-tubulin with anti-α-tubulin was included in each experiment (mouse monoclonal IgG; Sigma). Goat anti-rabbit IgG (Pierce, Rockford, IL) and goat anti-mouse IgG (Pierce) peroxidase-conjugated secondary antibodies were applied.
Whole cell lysate from the breast cancer cell line SK-BR-3 (Santa Cruz Biotechnology) was used as a positive control for ErbB2 detection. The RIPA lysate from the EGF-treated A431 human epithelial carcinoma cell line (upstate/Biomol) was applied as a control for the analysis of anti-phosphotyrosine.
Neuregulin Stimulation
For growth factor stimulation, 5 x 10⁵ cells/well were seeded in six-well plates and incubated at 37°C until 70% to 80% confluence had been achieved. For serum starvation, cells were kept without or with 0.5% fetal calf serum (FCS) for an additional 24 hours. Treatment with rhHRGβ1 (R&D Systems, Minneapolis, MN) was performed for 10 minutes at room temperature.
Inhibition of ErbB Signaling Pathway by Tyrosine Kinase Inhibitors
To analyze the effects of ErbB signaling inhibition, 5 x 10⁵ cells/well were seeded in six-well plates and incubated at 37°C until 70% to 80% confluence had been achieved. Added were 5 and 20 µM CI-1033 [Pfizer, New York, NY; stock solution in dimethyl sulfoxide (DMSO)] or 0.6 and 3 µM PD 158780 (Calbiochem, Schwalbach, Germany; stock solution in DMSO). The controls contained DMSO only. After 6 hours of incubation with inhibitors/DMSO at 37°C, 5 nM rhHRGβ1 (see above) was applied for 10 minutes at room temperature in a subset of experiments for the determination of the effect of blocked exogenous stimulation.
Growth Kinetics
For the determination of growth kinetics, cells were inoculated into 96-well plates in 100 µl of medium containing 10% FCS at cell densities ranging from 5000 to 20,000 cells/well, depending on the cell doubling time. The plates were incubated for 24 hours to allow cells to attach. By medium exchange, FCS concentration was lowered to 0.5%, and rhHRGβ1 was added once as a single-spike dose to obtain final concentrations from 0.05 to 50 nM. The plates were incubated for an additional 8 to 96 hours at 37°C without any change of medium. Four hours before the end of incubation, 20 µl of 3-(4,5-Dimethylthiazol-2-yl)-2,5diphenyltetrazoliumbromid (MTT) solution (5 mg/ml MTT in phosphate-buffered saline) was added to each well. The medium was removed, and 200 µl of DMSO was added to each well to redissolve the dye. Absorbance at 570 nm was measured. All values for growth stimulation or inhibition (see below) were calculated as the mean of six replica.
Cytotoxicity Assay
The growth-inhibiting activity of tyrosine kinase inhibitors was tested by standard MTT assay, as described above. Inhibitor concentrations were applied within a range from 0.002 to 20 µM for CI-1033 (stock concentration of 8.0 mM in DMSO) and from 0.003 to 3.0 µM for PD 158780 (stock concentration of 1.2 mM in DMSO).
IC50 values were calculated as the concentration of tyrosine kinase inhibitor that reduces cell viability by 50% after 48 hours.
Statistical Analysis
Significance analysis by chi-square test was performed using Microsoft EXCEL (Microsoft, Redmond, WA).
Results
ErbB Expression in CCSST
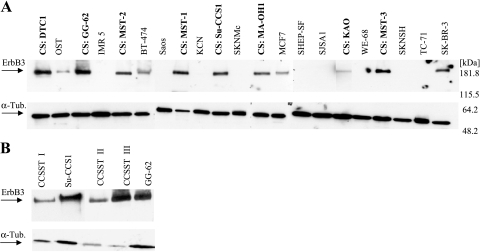
Eight CCSST cell lines were analyzed for ERBB3 protein abundance in comparison to OS, NB, ET, and breast carcinoma (BrCa) cell lines. All CCSST samples displayed a high expression of the ErbB3 receptor (Figure 1A). A lower expression of this receptor is also detectable in the three BrCa cell lines (BT-474, MCF7, and SK-BR-3), whereas moderate ErbB3 expression was detectable in only 1 (OST) of 10 other pediatric tumor cell lines. In addition, we detected the accumulation of ErbB3 in three translocation-positive CCSST tumor biopsies (Figure 1B), indicating that the overexpression of the ErbB3 receptor is a characteristic feature of this entity and is not related to cell culture conditions. No expression of ErbB3 protein could be detected in one OS, two NB, and three ET primary tumor specimens (data not shown).
Figure 1.
Western blot analysis for ErbB3 receptor expression in (A) CCSST cell lines (CS) compared with BrCa, OS, NB, and ET. (B) Cryopreserved CCSST biopsies with CCSST cell lines Su-CCS1 and GG-62 as positive controls.
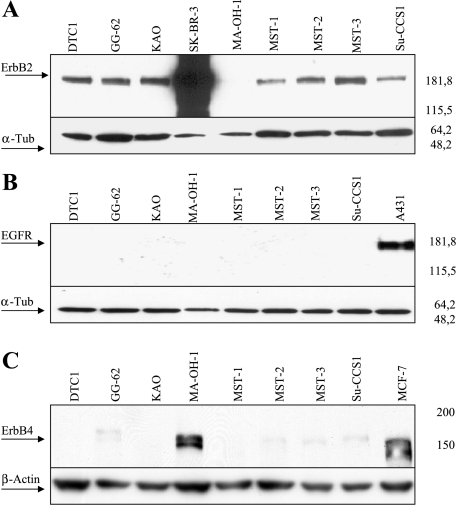
Because the tyrosine kinase-deficient ErbB3 receptor requires a heterodimerization partner for active signaling, we also tested our panel of CCSST cell lines for the expression of ErbB2. By Western blot analysis, all but one (MA-OH1) samples showed expression of ErbB2—the favored dimerization partner in this receptor family (Figure 2A). In comparison to SK-BR-3, which is characterized by massive ErbB2 gene amplification, the expression in CCSST was only moderate. Although none of the CCSST cell lines showed EGFR expression (Figure 2B), we found a strong signal for ErbB4 in the cell lines, which was negative for ErbB2 (Figure 2C), indicating that in all eight cell lines, a possible dimerization partner for ErbB3 is present.
Figure 2.
Western blot analysis for (A) ErbB2, (B) EGFR, and (C) ErbB4 expression in CCSST. Positive controls for ErbB2: SK-BR-3 BrCa cells with ERBB2 gene amplification; positive controls for EGFR: the A431 human epithelial carcinoma cell line; positive controls for ErbB4: the BrCa cell line MCF7. Loading controls were performed by staining for α-tubulin or β-actin.
Neuregulin Expression in CCSST
To analyze whether autocrine stimulation through the ErbB signaling pathway is possible in CCSST, we investigated whether neuregulin-1, the most prominent ligand of ErbB3, was also produced by these tumor cells.
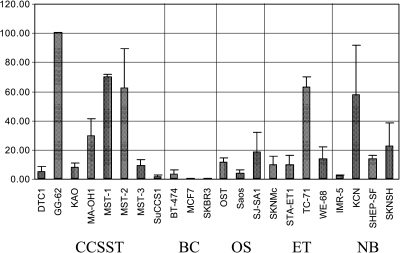
qRT-PCR neuregulin-1 By real-time PCR, we observed a broad spectrum of NRG1 gene activity in the eight analyzed CCSST cell lines. GG-62, MST-1, MST-2, and MA-OH1 showed high expression of NRG1 compared to the mean of all cell lines (Figure 3). The other four CCSST cell lines display only marginal expression of ligand mRNA.
Figure 3.
Real-time qRT-PCR to determine the relative expression of neuregulin-1 in CCSST, BrCa, OS, ET, and NB. For statistical calculation, expression values were categorized as higher or lower than the average. Error bars indicate the SD of independent replica (n = 2). The cell line showing the highest expression (GG-62) was assigned to 100%.
In summary, 4 of 8 CCSST but only 2 of 14 of the control panel of tumor cell lines expressed NRG1 above the average of our cell line panel. Even if this does not reach the significance level (P = .0704, chi-square test), it underlines the increased impact of the NRG1/ErbB signaling pathway in CCSST. Interestingly, in breast cancer cell lines, which are also characterized by ErbB receptor expression such as in CCSST samples, no amount or only minimal amounts of NRG1 mRNA could be detected.
Determination of neuregulin-1 isoforms To identify at least the most common transcript variants of NRG1, we developed a combination of RT-PCR assays to distinguish between types I, II, and III (HRG, GGF, and SMDF, respectively).
RT-PCR data are summarized in Table 5. All CCSST cell lines, except Su-CCS1, expressed α and/or β type I variants and, to some extent, type II variants. In agreement with qRT-PCR data (Figure 3), those cell lines with high overall expression of NRG1 also exhibited a strong PCR product intensity of NRG1 variants. The expression pattern of NRG1 variants in CCSST appears most similar to OS samples, keeping in mind that the overall expression level in CCSST was notably higher. ET cell lines differed from CCSST mainly by the additional expression of the γ type I variant. Expression of type III (SMDF) was found exclusively in NB (four of four NB; only weak signal in TC-71), making this entity fundamentally different from sarcoma samples.
Table 5.
Expression Pattern of NRG1 mRNA Variants.
| Cell Line | Entity | qRT-NRG1 | Type II β3 | Type I α, β1, β2 | Type I β3 | Type I γ | Type III α, β1, β2 | Type III β3 |
| DTC1 | CCSST | (+) | - | - | + | - | - | - |
| GG-62 | CCSST | +++ | + | ++ | ++ | - | - | - |
| KAO | CCSST | + | - | (+) | + | - | - | - |
| MA-OH1 | CCSST | + | - | + | + | - | - | - |
| MST-1 | CCSST | ++ | - | ++ | ++ | - | - | - |
| MST-2 | CCSST | +++ | (+) | ++ | ++ | - | - | - |
| MST-3 | CCSST | + | (+) | ++ | + | - | - | - |
| Su-CCS1 | CCSST | + | - | - | - | - | - | - |
| BT-474 | BrCa | (+) | - | - | - | - | - | - |
| MCF7 | BrCa | - | - | - | - | - | - | - |
| SK-BR3 | BrCa | - | - | - | - | - | - | - |
| OST | OS | + | - | (+) | + | - | - | - |
| Saos | OS | (+) | - | ++ | - | - | - | - |
| SJSA1 | OS | (+) | - | ++ | + | (+) | - | - |
| SKNMc | ET | + | - | ++ | + | (+) | - | - |
| STA-ET1 | ET | ++ | - | (+) | + | (+) | - | - |
| TC-71 | ET | ++ | + | ++ | ++ | (+) | - | (+) |
| WE-68 | ET | ++ | - | ++ | + | + | - | - |
| IMR 5 | NB | (+) | - | - | (+) | - | - | + |
| KCN | NB | ++ | + | - | + | - | - | + |
| SHEP-SF | NB | + | - | + | + | + | + | + |
| SKNSH | NB | + | + | - | (+) | (+) | ++ | + |
RT-PCR products found for the respective NRG1 variants were classified [as +++, very strong; ++, strong; +, moderate; (+), weak; -, not detectable] according to the staining intensity of silver-stained acrylamide gels.
The BrCa cell lines did not express any NRG1 variants, as expected, from the low level of NRG1 expression in qRT-PCR (Figure 3).
Mechanism of Elevated ERBB3/NRG1 Expression
To determine whether gross genetic alterations may be responsible for the recurrently elevated expression of ERBB3 at chromosome 12q13, CGH was used to detect genomic imbalances in CCSST cell lines. In total, 59 partial chromosomal gains (mean = 7.4; range = 2–11) and 46 losses (mean = 5.8; range = 1–8) were detected in the eight cell lines. The most frequent gains were found at chromosomes 8q (8 of 8), 17q (6 of 8), 7q (6 of 8), 7p (5 of 8), and 8p (4 of 8). Gains of chromosome 12q (ERBB3) were only detected in GG-62 and MST1.
For NRG1, we found that three of four cell lines showing elevated NRG1 mRNA levels were also characterized by 8p gains even if this did not achieve statistical significance (P = .15, chi-square test). The most obvious losses were found at chromosomes 9p (7 of 8) and 11 q (7 of 8). All CGH data are summarized in Table 6.
Table 6.
Chromosomal Alterations Detected by CGH.
| Cell Line | Gains | Losses |
| DTC1 | 3q, 7p q, 8p q, 17q | 1p, 6q, 9p, 11 p q, 14q, 15q, 19q |
| GG-62 | 5p q, 7p q, 8p q, 11 p, 12p q, 17q 20q | 1q, 6q, 9p q, 11q, 17p, 19p, 20p |
| KAO | 1p q, 2p q, 5p, 6p, 7p q, 8q, 17q, 20q, 22q | 11 q |
| MA-OH1 | 6p, 7p q, 8q | 1p, 3p, 9p, 11p q |
| MST-1 | 1q, 6p, 7pq, 8p q, 12q, 14q, 17q | 6q, 9p q, 11p q, 15q, 16q |
| MST-2 | 1q, 4q, 5p, 7q, 8p q, 17q | 9p, 17p, 19q, 20q |
| MST-3 | 8q, 16p | 8p, 9p, 10p q, 11q |
| Su-CCS1 | 1p, 4q, 5q, 6q, 8q, 13q, 16p, 17q | 1p, 9p, 10p, 11q, 16q, 17p, 19 p q |
The gains of the loci of interest (8p/NRG1 and 12q ERBB3) are highlighted in boldface.
Because gains of chromosome 12q13 can obviously not be the (sole) cause for the elevated ERBB3 expression in CCSST, we sought for other possible genetic mechanisms for gene activation. In a former study, we observed the chromosome 12q13 region 5 Mb telomeric to the ATF1 breakpoint to be a specific hotspot of gene activity in CCSST [6]. The genes ERBB3, CDK2, and SILV are all located in close proximity to the activated 3′ end of ATF1 and belong to the group of the 54 most significantly upregulated genes in CCSST, according to gene expression profiling analysis.
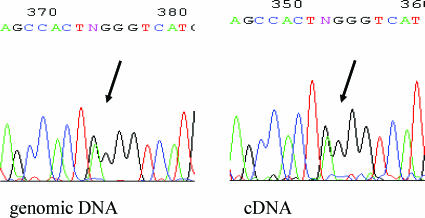
Because the SILV gene harbors a single-nucleotide polymorphism (dbSNP 1052165) within its exonic sequence, we were able to discriminate between transcripts of this gene from the normal and the rearranged chromosome 12. In none of the three heterozygous CCSST cell lines (DTC1, GG-62, and MST-2) could a difference in allele activity of the SILV gene be observed (Figure 4), indicating that genes located on the rearranged chromosomal 12q arm are not generally preferred to be transcribed at elevated levels.
Figure 4.
Example of cycle sequence analysis of SILV genomic DNA and RNA transcripts across a single-nucleotide polymorphism (arrow) to detect imbalances in allelic expression. Heterozygous SILV alleles in the cell line DTC1 were equally expressed.
ERBB3 Is Functionally Active in CCSST
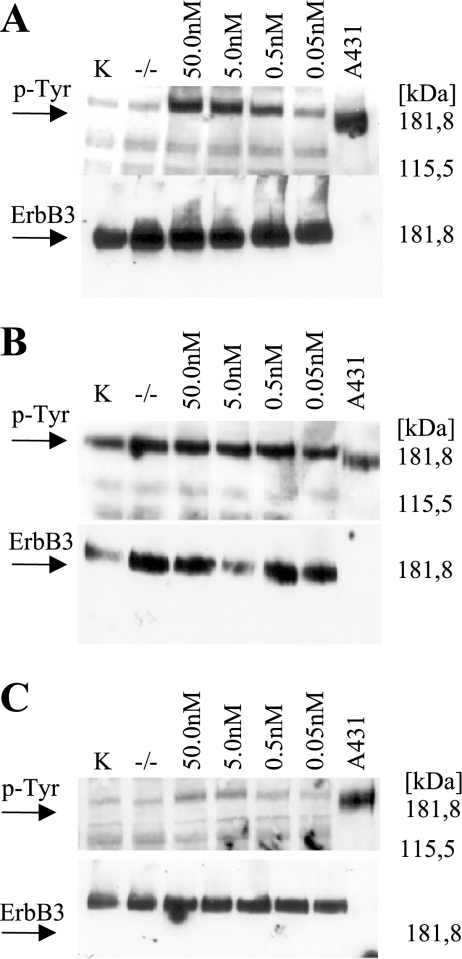
Neuregulin stimulation (Western blot ERBB3/P-Tyr) To further characterize the ErbB signaling pathway in CCSST, we analyzed the phosphorylation status of the ErbB3 receptor before and after NRG1 ligand stimulation. The six cell lines analyzed in the following series could clearly be divided into two groups: those with high tyrosine phosphorylation even in the absence of external neuregulin (GG-62 and MST-1; example given in Figure 5B, data summarized in Table 7) and those showing only marginal basal phosphorylation (MA-OH1, KAO, and Su-CCS1 DTC1; example given in Figure 5, A + C). Interestingly, the cell lines with high basal tyrosine phosphorylation also harbored the most elevated levels of NRG1 mRNA expression (Figure 3 and Table 7).
Figure 5.
Western blot analysis to detect ERBB3 activation in (A) Su-CCS1 cells and (B) GG-62 cells stimulated with 0.05 to 50.0 nM rhHRGβ1 over 10 minutes. K: Control (10% FCS, no rhHRGβ1); -/-: low-serum Control (0.5% FCS, no rhHRGβ1). (C) Only moderate receptor phosphorylation can be induced in the ErbB3/ErbB4 positive cell line MA-OH-1.
Table 7.
NRG1 mRNA Expression, ErbB Phosphorylation, and LD50 Values of the CCSST Cell Line Treated with CI-1033 and PD158780.
| Cell Line | qRT-PCR NRG1 | ErbB Phosphorylation | LD50(48 hours) (M) | ||
| Basal | Neuregulin-Induced | CI-1033 | PD158780 | ||
| GG-62 | 100.0 | +++ | +++ | 0.12 | 0.9 |
| DTC1 | 4.47 | + | +++ | 3.5 | > 3.0 |
| KAO | 7.57 | + | +++ | 5.5 | > 3.0 |
| Su-CCS1 | 1.18 | + | +++ | 10.0 | > 3.0 |
| MA-OH1 | 29.41 | + | ++ | 3.5 | > 3.0 |
| MST-1 | 69.55 | ++ | +++ | 0.03 | 0.5 |
ErbB phosphorylation was analyzed by Western blot analysis, and signal intensity was scored as (+) weak, (++) moderate, and (+++) strong.
After neuregulin-1 stimulation, we observed a pronounced increase of receptor phosphorylation in a dose-dependent manner (50 pM-50 nM) in cell lines without high basal ErbB3 phosphorylation (representative example in Figure 5A), whereas cells with high basal phosphorylation showed only a moderate increase (MST-1) or even no increase in phosphorylation level (Figure 5B). In the cell line MA-OH1, which was characterized by elevated ErbB4 expression instead of ErbB2, only moderate receptor phosphorylation could be induced. These data are summarized in Table 7.
The phosphorylation signal was already detectable 30 seconds after neuregulin application and persisted for at least 10 minutes in all stimulable cell lines (data not shown).
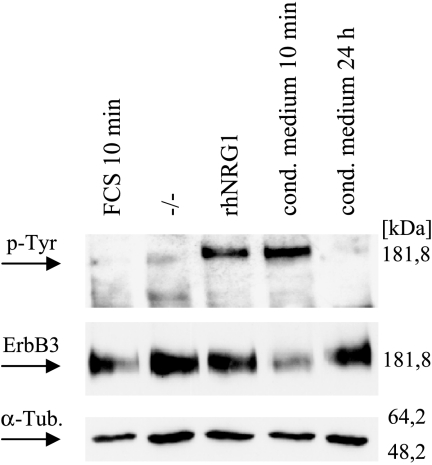
Activity of secreted heregulin To support the hypothesis that the high basal tyrosine phosphorylation of ErbB3 is a consequence of the expression and the release of the corresponding ligand NRG1, we tested the conditioned medium of GG-62 (high level of NRG1 mRNA and high basal phosphorylation) for ErbB stimulation activity. As expected, the supernatant of GG-62 induced ErbB3 phosphorylation in Su-CCS1 (low level of NRG1 mRNA and low basal phosphorylation) comparable to 5 nM recombinant hHRGβ1 (Figure 6).
Figure 6.
Western blot analysis to detect ERBB3 activation in Su-CCS1 cells incubated with conditioned medium from GG-62 cells. Su-CCS1 cells were treated with 10% FCS (lane 1), 5 nM rhHRGβ1 (lane 3), or conditioned medium from GG-62 cells (lane 4) for 10 minutes. ERBB3 activation by conditioned medium was comparable to induction achieved by applying 5 nM rhHRGβ1 for 10 minutes (lane 3). After 24 hours (lane 5), ErbB3 phosphorylation decayed to background levels.
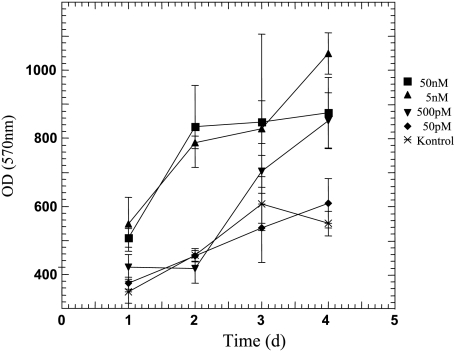
Neuregulin stimulation (growth kinetics) To monitor the impact of exogenous NRG1 stimulation on the growth behavior of CCSST, tumor cells were incubated in the presence of 50 pM to 50 nM rhHRGβ1, and growth kinetics was determined by MTT assay. In a subset of tumor cell lines, rhHRGβ1 could be shown to promote cell growth in a time-dependent and dose-dependent manner (see Figure 7 for representative examples).
Figure 7.
Growth kinetics to determine the impact of exogenous NRG1 on the growth of the CCSST cell line, KAO. Tumor cells were incubated in the presence of 50 pM to 50 nM rhHRGβ1 up to 96 hours, and cell viability was measured by MTT assay. Error bars, ± SD.
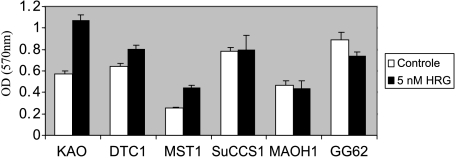
We observed the tendency that CCSST cells expressing higher levels of endogenous NRG1 could not further be stimulated to promote cell growth (GG-62 and MA-OH1, except MST1), whereas cells without elevated NRG1 levels responded to exogenous heregulin by growth acceleration (DTC1 and KAO, except Su-CCS1) (Figure 8).
Figure 8.
Growth stimulation by 5 nM recombinant hHRGβ1 in a panel of six CCSST cell lines. Cells were treated with 5 nM rhHRGβ1 (black columns; noheregulin control, white columns) for 4 days, and cell viability was measured by MTT assay. Error bar, SD.
No morphologic changes could be detected in any of the cell lines during the 96-hour incubation with heregulin (data not shown).
Inhibition of ErbB signaling pathway by tyrosine kinase inhibitor The impact of neuregulin/ErbB signaling on CCSST tumor cells was further investigated by suppressing receptor phosphorylation with pan-ErbB tyrosine kinase inhibitors CI-1033 and PD158780, which both interact with the ATP-binding site of the EGFR family members.
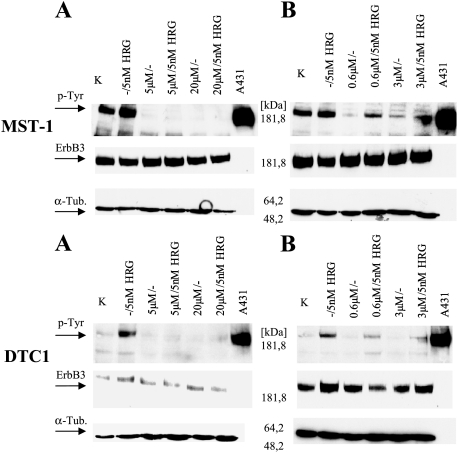
ErbB3 phosphorylation was completely or almost completely lost after a 6-hour incubation with CI-1033 or PD158780 in CCSST cells with high basal levels of ErbB3 phosphorylation due to autocrine stimulation [representative example (MST1) given in Figure 9]. Moreover, after pre-incubation with the inhibitors, activation of ErbB3 receptor by exogenous neuregulin was substantially reduced if not completely abolished.
Figure 9.
Western blot analysis to detect ErbB2/ErbB3 inhibition in MST-1 cells with autocrine ErbB2/ErbB3 stimulation and in DTC1 cells with rhHRGβ1-induced ErbB2/ErbB3 stimulation. ErbB2/ErbB3 inhibition was achieved by treating the cells with (A) 5 and 20 µM CI-1033, or (B) 0.6 and 3 µM PD158780. Endogenous ErbB3 activity is demonstrated in control lanes (K), which indicate cells without either tyrosine kinase inhibitors (TKI) or rhHRGβ1. Exogenous ErbB2/ErbB3 activation in the absence of TKI is shown in lanes labeled -/5 nM HRG.
To get first hints if suppression of ErbB signaling in CCSST represents a new therapeutic option, the influence of pan-ErbB tyrosine kinase inhibitors on the growth kinetics of tumor cells was tested in vitro.
We observed a broad spectrum of LD50(48 hours) values among the six analyzed CCSST cell lines, ranging from 25 nM (MST-1) to 10 µM (Su-CCS1) (Table 7). Interestingly, CCSST cells were characterized by an inverse correlation between endogenous NRG1 expression and resistance to the inhibitor CI-1033 (measured by LD50 values, Pearson correlation, r = -0.82). The same tendency was observed using the inhibitor PD158780; however, due to an overall higher tolerance of CCSST cells to PD158780, no correlation was calculated.
Discussion
CCSST is an aggressive and rare soft tissue tumor that appears to be histogenetically related to melanoma, but its clinical behavior resembles soft tissue sarcoma. Patients presenting with unresectable tumors have a very poor prognosis because aggressive multiagent chemotherapy appeared to have no impact on outcome [4,5,18].
The analyses presented here aim to discover signaling pathways, which are critical for the malignant growth of CCSST and might therefore constitute potential targets for new therapeutic strategies. Our studies are based on the previous mRNA expression profiling analyses indicating that the ErbB3 growth factor receptor is highly expressed in CCSST [6,7,19].
Based on Western blot analysis, in this study, we also found the receptor protein to be present in 100% of CCSST samples (three frozen tumor tissues and eight tumor cell lines), whereas almost all other sarcoma or neuroectodermal tumors from the control panel were negative.
Because ErbB3 has lost its kinase activity during evolution, it requires a coreceptor with kinase activity, preferentially ErbB2, to transmit ligand-binding signals [10,20]. As an important functional prerequisite, we show that the CCSST cell lines also express moderate levels of ErbB2 (or ErbB4 in one cell line), which enables these tumors to act through this powerful signaling pathway. Because a subset of CCSST also expresses neuregulin-1, the data presented here suggest that NRG/ErbB receptor signaling plays a significant role in this tumor entity. Indeed, we could demonstrate that cell lines synthesizing high levels of neuregulin-1 also show elevated ErbB3 phosphorylation levels and that, for all CCSST cell lines, ErbB receptors are phosphorylated after the addition of exogenous neuregulin-1. In our proliferation assays, the one-time addition of exogenous neuregulin stimulated three of six analyzed cell lines toward enhanced growth kinetics. Even if we did not test whether continuous stimulation would lead to a more heightened growth spurt of cells, we can conclude from these data that neuregulin/ErbB signaling is functionally relevant in CCSST.
Because the tissue of origin of CCSST is still a matter of debate, it remains to be determined whether the expression of ERBB3 in these tumor cells represents a residual differentiation of the transformed cell of origin or an acquired feature that is related to malignant transformation or progression.
The first hypothesis of residual expression of the progenitor tissue is supported by our observation that obligatory t(12;22)(q13;12) translocation is not directly related to the characteristic activation of the gene cluster at 12q13 (including ERBB3, SILV, and CDK2 [6]) and that the gene locus on 12q13 is not recurrently amplified in CCSST.
Although the coexpression of ERB2 and ERB3 is a rarely reported event in other sarcoma entities [21], recent investigations on primary tumor tissues of neuronal supportive origin, such as astrocytic glioma or malignant peripheral nerve sheath tumors [22,23], have identified an autocrine stimulation loop involving ErbB2, ErbB3, and the ligand neuregulin-1 as characteristic features. However, because NRG/ErbB signaling is well known to play a critical role in neuromuscular development and functional maintenance, ErbB and neuregulin expression is more likely a residual differentiation of the tumor tissues in these entities.
The understanding of the multiple processes that modulate EGFR-related receptor signal transduction, such as heterodimerization, tyrosine kinase activity, and endocytosis, in special cancer types has revealed new opportunities in the development of modern anticancer therapeutics (reviewed in Yarden [24]). Therefore, considering the poor sensitivity of CCSST to standard sarcoma combination chemotherapy, we regard the impact of the ErbB/neuregulin signaling pathway on clinical management to be of high interest.
One of the first anticancer agents to specifically target members of the ErbB receptor family is trastuzumab, a humanized monoclonal antibody against ErbB2. Clinical studies have demonstrated the effectiveness of this antibody in the treatment of advanced breast cancer showing ErbB2 overexpression. Stimulated by these experiences, the arsenal of anti-ErbB agents, such as specific antibodies or small-molecule kinase inhibitors, is continuously growing and being evaluated in clinical trials. However, it remains difficult to predict the response to adjuvant anti-ErbB therapy in individual patients because, by far, not every tumor expressing ErbB receptors may be affected by the corresponding inhibitor [25,26]. This phenomenon may be related to different mechanisms leading to uncontrolled ErbB activation, including gene amplification, gene mutation, or epigenetic factors. In addition, it should be considered whether the activation is ligand-dependent or not [27,28]. In CCSST, we were able to show those tumors characterized by a high degree of autocrine/paracrine stimulation through the ErbB/neuregulin pathway to be the most promising candidates for anti-ErbB therapy.
In other sarcomas, the clinical impact of ErbB receptor gene activation and even the prevalence of overexpression and gene amplification are still a matter of debate. In Ewing's tumors for example, which are also characterized by an EWS gene rearrangement (as in CCSST), in none of 16 primary tumors (regardless of 17q gain) were we able to detect any ErbB2 expression by immunohistochemistry and fluorescence in situ hybridization analysis [29]. These findings were also confirmed by other studies [30,31]. Furthermore, in a more recent study on 113 Ewing's tumor samples, 16% was found to express ErbB2, but only focal to diffuse cytoplasmic staining, without concomitant membranous staining, was observed. In addition, in vitro treatment using the anti-HER-2 antibody trastuzumab failed to reduce cell growth in Ewing's tumor cells [31].
In summary, we demonstrate a high biologic impact of ErbB/neuregulin signaling at least in the subset of CCSST, which is characterized by significant autocrine or paracrine stimulation. Thus, our molecular genetic analysis constitutes the basis of the further evaluation of anti-ErbB-based therapeutic concepts in these otherwise chemotherapy-resistant tumors.
Footnotes
This work is dedicated to Professor Ulrich Goebel on the occasion of his 65th birthday.
This work was supported by grants from the “Elterninitiative Kinderkrebsklinik eV Duesseldorf,” the “Forschungskommission der Medizinischen Fakultät Düsseldorf,” and EuroBoNet (6th Framework Network of Excellence of the European Union).
References
- 1.Sciot R, Speleman F. Clear cell sarcoma of soft tissue. In: Fletchers CD, Unni KK, Mertens F, editors. World Health Organisation Classification of Tumours. Pathology and Genetics of Tumours of Soft Tissue and Bone. Lyon: IARC Press; 2002. pp. 211–212. [Google Scholar]
- 2.Chung EB, Enzinger FM. Malignant melanoma of soft parts. A reassessment of clear cell sarcoma. Am J Surg Pathol. 1983;7:405–413. doi: 10.1097/00000478-198307000-00003. [DOI] [PubMed] [Google Scholar]
- 3.Zucman J, Delattre O, Desmaze C, Epstein AL, Stenman G, Speleman F, Fletchers CD, Aurias A, Thomas G. EWS and ATF-1 gene fusion induced by t(12;22) translocation in malignant melanoma of soft parts. Nat Genet. 1993;4:341–345. doi: 10.1038/ng0893-341. [DOI] [PubMed] [Google Scholar]
- 4.Ferrari A, Casanova M, Bisogno G, Mattke A, Meazza C, Gandola L, Sotti G, Cecchetto G, Harms D, Koscielniak E, et al. Clear cell sarcoma of tendons and aponeuroses in pediatric patients: a report from the Italian and German Soft Tissue Sarcoma Cooperative Group. Cancer. 2002;94:3269–3276. doi: 10.1002/cncr.10597. [DOI] [PubMed] [Google Scholar]
- 5.Finley JW, Hanypsiak B, McGrath B, Kraybill W, Gibbs JF. Clear cell sarcoma: the Roswell Park experience. J Surg Oncol. 2001;77:16–20. doi: 10.1002/jso.1057. [DOI] [PubMed] [Google Scholar]
- 6.Schaefer KL, Brachwitz K, Wai DH, Braun Y, Diallo R, Korsching E, Eisenacher M, Voss R, Van Valen F, Baer C, et al. Expression profiling of t(12;22) positive clear cell sarcoma of soft tissue cell lines reveals characteristic up-regulation of potential new marker genes including ERBB3. Cancer Res. 2004;64:3395–3405. doi: 10.1158/0008-5472.CAN-03-0809. [DOI] [PubMed] [Google Scholar]
- 7.Segal NH, Pavlidis P, Noble WS, Antonescu CR, Viale A, Wesley UV, Busam K, Gallardo H, DeSantis D, Brennan MF, et al. Classification of clear-cell sarcoma as a subtype of melanoma by genomic profiling. J Clin Oncol. 2003;21:1775–1781. doi: 10.1200/JCO.2003.10.108. [DOI] [PubMed] [Google Scholar]
- 8.Casalini P, Iorio MV, Galmozzi E, Menard S. Role of HER receptors family in development and differentiation. J Cell Physiol. 2004;200:343–350. doi: 10.1002/jcp.20007. [DOI] [PubMed] [Google Scholar]
- 9.Hynes NE, Lane HA. ERBB receptors and cancer: the complexity of targeted inhibitors. Nat Rev Cancer. 2005;5:341–354. doi: 10.1038/nrc1609. [DOI] [PubMed] [Google Scholar]
- 10.Citri A, Skaria KB, Yarden Y. The deaf and the dumb: the biology of ErbB-2 and ErbB-3. Exp Cell Res. 2003;284:54–65. doi: 10.1016/s0014-4827(02)00101-5. [DOI] [PubMed] [Google Scholar]
- 11.Falls DL. Neuregulins and the neuromuscular system: 10 years of answers and questions. J Neurocytol. 2003;32:619–647. doi: 10.1023/B:NEUR.0000020614.83883.be. [DOI] [PubMed] [Google Scholar]
- 12.Gross ME, Shazer RL, Agus DB. Targeting the HER-kinase axis in cancer. Semin Oncol. 2004;31:9–20. doi: 10.1053/j.seminoncol.2004.01.005. [DOI] [PubMed] [Google Scholar]
- 13.Wai DH, Schaefer KL, Schramm A, Korsching E, Van Valen F, Ozaki T, Boecker W, Schweigerer L, Dockhorn-Dworniczak B, Poremba C. Expression analysis of pediatric solid tumor cell lines using oligonucleotide microarrays. Int J Oncol. 2002;20:441–451. [PubMed] [Google Scholar]
- 14.Kallioniemi A, Kallioniemi OP, Sudar D, Rutovitz D, Gray JW, Waldman F, Pinkel D. Comparative genomic hybridization for molecular cytogenetic analysis of solid tumors. Science. 1992;258:818–821. doi: 10.1126/science.1359641. [DOI] [PubMed] [Google Scholar]
- 15.Kirchhoff M, Gerdes T, Rose H, Maahr J, Ottesen AM, Lundsteen C. Detection of chromosomal gains and losses in comparative genomic hybridization analysis based on standard reference intervals. Cytometry. 1998;31:163–173. [PubMed] [Google Scholar]
- 16.Kirchhoff M, Gerdes T, Maahr J, Rose H, Bentz M, Dohner H, Lundsteen C. Deletions below 10 megabasepairs are detected in comparative genomic hybridization by standard reference intervals. Genes Chromosomes Cancer. 1999;25:410–413. doi: 10.1002/(sici)1098-2264(199908)25:4<410::aid-gcc17>3.0.co;2-j. [DOI] [PubMed] [Google Scholar]
- 17.Schneider DT, Schuster AE, Fritsch MK, Calaminus G, Gobel U, Harms D, Lauer S, Olson T, Perlman EJ. Genetic analysis of mediastinal nonseminomatous germ cell tumors in children and adolescents. Genes Chromosomes Cancer. 2002;34:115–125. doi: 10.1002/gcc.10053. [DOI] [PubMed] [Google Scholar]
- 18.Jacobs IA, Chang CK, Guzman G, Salti GI. Clear cell sarcoma: an institutional review. Am Surg. 2004;70:300–303. [PubMed] [Google Scholar]
- 19.Schaefer KL, Wai DH, Poremba C, Korsching E, Van Valen F, Ozaki T, Boecker W, Dockhorn-Dworniczak B. Characterization of the malignant melanoma of soft-parts cell line GG-62 by expression analysis using DNA microarrays. Virchows Arch. 2002;440:476–484. doi: 10.1007/s00428-001-0558-9. [DOI] [PubMed] [Google Scholar]
- 20.Holbro T, Civenni G, Hynes NE. The ErbB receptors and their role in cancer progression. Exp Cell Res. 2003;284:99–110. doi: 10.1016/s0014-4827(02)00099-x. [DOI] [PubMed] [Google Scholar]
- 21.Ricci C, Landuzzi L, Rossi I, De Giovanni C, Nicoletti G, Astolfi A, Pupa S, Menard S, Scotlandi K, Nanni P, et al. Expression of HER/erbB family of receptor tyrosine kinases and induction of differentiation byglial growth factor 2 in human rhabdomyosarcoma cells. Int J Cancer. 2000;87:29–36. [PubMed] [Google Scholar]
- 22.Ritch PS, Carroll SL, Sontheimer H. Neuregulin-1 enhances survival of human astrocytic glioma cells. Glia. 2005;51:217–228. doi: 10.1002/glia.20197. [DOI] [PMC free article] [PubMed] [Google Scholar]
- 23.Stonecypher MS, Byer SJ, Grizzle WE, Carroll SL. Activation of the neuregulin-1/ErbB signaling pathway promotes the proliferation of neoplastic Schwann cells in human malignant peripheral nerve sheath tumors. Oncogene. 2005;24:5589–5605. doi: 10.1038/sj.onc.1208730. [DOI] [PubMed] [Google Scholar]
- 24.Yarden Y. The EGFR family and its ligands in human cancer. Signalling mechanisms and therapeutic opportunities. Eur J Cancer. 2001;37(4):S3–S8. doi: 10.1016/s0959-8049(01)00230-1. [DOI] [PubMed] [Google Scholar]
- 25.Campos S, Hamid O, Seiden MV, Oza A, Plante M, Potkul RK, Lenehan PF, Kaldjian EP, Varterasian ML, Jordan C, et al. Multicenter, randomized phase II trial of oral CI-1033 for previously treated advanced ovarian cancer. J Clin Oncol. 2005;23:5597–5604. doi: 10.1200/JCO.2005.08.091. [DOI] [PubMed] [Google Scholar]
- 26.Pegram MD, Konecny G, Slamon DJ. The molecular and cellular biology of HER2/neu gene amplification/overexpression and the clinical development of herceptin (trastuzumab) therapy for breast cancer. Cancer Treat Res. 2000;103:57–75. doi: 10.1007/978-1-4757-3147-7_4. [DOI] [PubMed] [Google Scholar]
- 27.Shelton JG, Steelman LS, Abrams SL, Bertrand FE, Franklin RA, McMahon M, McCubrey JA. The epidermal growth factor receptor gene family as a target for therapeutic intervention in numerous cancers: what's genetics got to do with it? Expert Opin Ther Targets. 2005;9:1009–1030. doi: 10.1517/14728222.9.5.1009. [DOI] [PubMed] [Google Scholar]
- 28.Ozaki T, Schaefer KL, Wai D, Yokoyama R, Ahrens S, Diallo R, Hasegawa T, Shimoda T, Hirohashi S, Kawai A, et al. Population-based genetic alterations in Ewing's tumors from Japanese and European Caucasian patients. Ann Oncol. 2002;13:1656–1664. doi: 10.1093/annonc/mdf218. [DOI] [PubMed] [Google Scholar]
- 29.George E, Niehans GA, Swanson PE, Strickler JG, Singleton TP. Overexpression of the c-erb-B2 oncogene in sarcomas and small round-cell tumors of childhood. An immunohistochemical investigation. Arch Pathol Lab Med. 1992;116:1033–1035. [PubMed] [Google Scholar]
- 30.Thomas DG, Giordano TJ, Sanders D, Biermann JS, Baker L. Absence of HER2/neu gene expression in osteosarcoma and skeletal Ewing's sarcoma. Clin Cancer Res. 2002;8:788–793. [PubMed] [Google Scholar]
- 31.Scotlandi K, Manara MC, Hattinger CM, Benini S, Perdichizzi S, Pasello M, Bacci G, Zanella L, Bertoni F, Picci P, et al. Prognostic and therapeutic relevance of HER2 expression in osteosarcoma and Ewing's sarcoma. Eur J Cancer. 2005;41:1349–1361. doi: 10.1016/j.ejca.2005.03.015. [DOI] [PubMed] [Google Scholar]


