

Abstract
Antigenic variation in Plasmodium falciparum erythrocyte membrane protein 1, caused by a switch in transcription of the encoding var gene, is an important feature of malaria. In this study, we quantified the relative abundance of var gene transcripts present in P. falciparum parasite clones using real-time reverse transcription-polymerase chain reaction (RT-PCR) and conventional RT-PCR combined with cloning and sequencing, with the aim of directly comparing the results obtained. When there was sufficient abundance of RNA for the real-time RT-PCR assay to be operating within the region of good reproducibility, RT-PCR and real-time RT-PCR tended to identify the same dominant transcript, although some transcript-specific issues were identified. When there were differences in the estimated relative amounts of minor transcripts, the RT-PCR assay tended to produce higher estimates than real-time RT-PCR. These results provide valuable information comparing RT-PCR and real-time RT-PCR analysis of samples with small quantities of RNA as might be expected in the analysis of field or clinical samples.
INTRODUCTION
Improving our understanding of the biology of the Plasmodium falciparum parasite is of extreme importance if we are to combat human malaria. This parasite uses the process of antigenic variation to expose the human immune system to continually changing antigens on the surface of infected red blood cells. While the parasite’s ability to change expressed antigens such as P. falciparum erythrocyte membrane protein 1 (PfEMP1) is thought to be a key survival strategy of the parasite,1 it has also been hypothesized that antigenic variation plays a role in slowing the selection of de novo drug resistance parasites,2 and the development of clinical immunity.3–5 Furthermore, some of the severe complications of falciparum malaria such as cerebral and placental malaria have been linked to parasite sequestration mediated by PfEMP1.6
While studying the process of antigenic variation in P. falciparum is of key interest, it is fraught with technical issues, not the least of which is the changing parasite transcriptome and small quantities of PfEMP1 expressed on the infected red blood cells (RBCs).7 For the last decade, the composition of mRNA has been primarily assessed by cloning the products of an reverse transcription-polymerase chain reaction (RT-PCR) reaction into a bacterial plasmid vector and transforming the ligated plasmid into bacteria to provide a small library representing the repertoire of transcripts present.8–11 This technique measures the transcript composition of the PCR reaction end products, as opposed to the composition of the starting material. The advent of real-time PCR has overcome this problem by allowing the transcript composition of samples to be assessed during amplification. Although this is a technically superior method for quantitating specific mRNA, there are several practical problems that may limit its widespread use in assessing var gene (the gene encoding PfEMP1) transcription.
First, knowledge of the var gene repertoire of the specific parasite genome is required to develop specific primers. The studies that have used real-time PCR to analyze various aspects of var gene transcription generally used the 3D7 parasite line (or its parent NF54), for which the complete genome is known.12–14 Other laboratory lines such as ItG have also been used after the sequences of the var genes were determined.15 Analysis of field samples using this method is not possible without prior knowledge of the var gene repertoire, and with each parasite isolate likely to have a different set of var genes,16 this approach will require a major sequencing effort before the analysis can start. Second, the amount of material required to conduct a real-time RT-PCR experiment using a full set of primers representing the whole var gene repertoire exceeds that required for conventional RT-PCR followed by cloning and sequencing. Previous studies have overcome this problem by culturing ex vivo samples in the laboratory for ~30 days to increase the amount of parasite material.14 However, this approach does not take into account the switching parasite population; it is well documented that ~1–2% of parasites change their gene expression in each replication cycle.7,17
Because antigenic variation is thought to play a role in immunity, pathology, and drug resistance, it is going to become increasing important to be able to study the process using field samples. Currently this is not feasible using real-time RT-PCR, although this method is theoretically technically superior to other PCR techniques. Hence it has become necessary to assess and compare the results obtained using different techniques for quantitating mRNA to add perspective to the results of future laboratory and field studies.
The primary aim of this study was to compare the results of RT-PCR combined with cloning and sequencing and real-time RT-PCR conducted on the same sample materials. The results indicate that the number of amplification cycles required for the number of fluorescence labeled amplicons to exceed background levels (CT value) in real-time RT-PCR experiments can be used as an indicator of the likelihood of observing specific amplicons in a sample and that RT-PCR tended to overestimate the quantity of minor types compared with real-time RT-PCR.
MATERIALS AND METHODS
Sample material and clonal cultures
P. falciparum parasites (3D7 strain) from stored patient samples9 were thawed and immediately plated onto 96-well plates at theoretical concentrations of 0.3 and 1 infected erythrocytes per well to generate clonal populations. Culture media (100 μL) containing 10% human serum and fresh uninfected erythrocytes at 5% hematocrit was added to each well. The culture media was changed on days 4 and 8. On Day 12 (six parasite replication cycles), the clonal cultures containing parasites, as identified by standard PCR using 5 μL of the culture,18 were resus-pended, and 50% of the original contents were transferred to RNase-free tubes and frozen at −80°C. The remaining material was cultured to Day 16 (eight parasite replication cycles), at which time 50% was removed and stored as above. Parasites harvested on days 12 and 16 were predominantly ring-stage. A random selection of the stored clones was used in this study. The estimated number of parasites in each of the Day 12 and 16 samples were 7,800 and 97,000, respectively. Informed consent was obtained from the volunteers and ethics approval for the use of patient samples was granted by the Queensland Institute of Medical Research (QIMR) Human Research Ethics Committee.
RNA and DNA extraction
Total RNA was extracted from each of the selected clones using the NucleoSpin RNAII Kit (Macherey-Nagel, Duren, Germany) following the manufacturer’s instructions. A second elution step was included to maximize yield. All samples were treated with DNase and tested as previously described to ensure no DNA was present.9 DNA from cultured 3D7 was extracted using standard methods and used as a control template to assess primer bias in the real-time PCR assay.
RT-PCR, vector cloning, and sequencing of AFBR fragments
The universal primers, αAF [GCACG(A/C)AG-TTTGC] and αBR [GCCCATTC(G/C)TCGAACCA]8 were used to amplify a segment of the highly conserved DBL1α region of the var gene using the SuperScript One Step RT-PCR System with Platinum Taq DNA Polymerase (Invitrogen, Carlsbad, CA) under the following conditions: 42°C for 30 minutes, 94°C for 2 minutes, followed by 40 cycles of 93°C for 30 seconds, 42°C for 50 seconds, and 72°C for 1 minute. The products amplified using the above-described primers were termed AFBR fragments and were inserted into PCR-Script (Stratagene, La Jolla, CA) according to the manufacturer’s instructions. Typically between 40 and 50 insert-containing bacterial colonies were selected, grown, amplified, purified, and sequenced from each parasite clone. AFBR fragment sequences were identified and named by alignment with previously described fragments of the DBLα region of P. falciparum 3D7 var genes,8,9 and the frequency of each transcript within the clone sample was noted.
Real-time RT-PCR and PCR
Purified RNA was reverse transcribed using SuperScript III Reverse Transcriptase (Invitrogen) and primed with random hexamer primers according to the manufacturer’s instructions. Serial dilutions covering a 100-fold range of 3D7 genomic DNA were prepared and used as references. In each experiment, all primers tested on the clone’s cDNA were also tested on the 3D7 DNA dilution series. For real-time analysis, previously published12 and newly designed var gene specific primers were used (Tables 1 and 2). The housekeeping gene seryl-tRNA synthetase (PF07–0073), shown to be transcribed stably throughout different erythrocytic stages,19 was used as an endogenous control (normalizer). A previously reported primer set (forward: AAGTAGCAGGTCATCGTGGTT; reverse: TTCGGCAC-ATTCTTCCATAA) was used to amplify the seryl-tRNA synthetase (s-tRNA syn) gene.12 Real-time RT-PCR and PCR was performed using a MX4000 (Stratagene), and all samples and controls were run in triplicate. The amount of cDNA added to each real time reaction for clones harvested on Day 12 was calculated to be equivalent to that from ~40 parasites. The Absolute QPCR SYBR Green Mix (Abgene, Surrey, UK) was used according to manufacturer’s instructions under the following cycling conditions: 95°C, 15 minutes followed by 40 cycles of 94°C, 30 seconds; 53°C, 40 seconds; and 68°C, 50 seconds. For real-time RT-PCR, var gene-specific primers tested on each of the parasite clones were selected based on the AFBR transcripts observed in the RT-PCR results. A dissociation curve thermal profile (from 53°C with 1°C increments for 41 cycles) was included after the amplification cycles. All samples showing primer dimer formation or spurious, non-specific peaks, as indicated by the dissociation curve, were excluded from the analysis.
Table 1.
Comparison between AFBR nomenclature8,9 and PlasmoDB (Release 4.4) 3D7 P. falciparum gene name22,27 or accession no. with details of newly designed primer sets used to amplify transcripts
| AFBR code | PlasmoDB gene name/accession no. | Specific primer set |
|---|---|---|
| AFBR3 | MAL7P1.212 | Forward AAATGGTGGTAACAAATGGG
Reverse TTTGTGCTTGGCAAAATGCG |
| AFBR7 | PFD1005c | Forward CTTCGGTGATAAAGGCGAAG
Reverse ATTCCAGGTCATTCTCAACG |
| AFBR19 | PFC1120c | Forward AGAGGAAACAATAAGTCGTG
Reverse CTTTGTATTATCCAAGGGTG |
| AFBR23 | PFL1970w | Forward TACAGAAATGGTGGAAGAGG
Reverse TACAAGATTTGGGACAACTG |
| AFBR26 | PFL0940c | Forward CAACATATGGTAATTTTCCC
Reverse TAGCGGAGACGACTCCTCC |
| AFBR46 | PFL266c | Forward GCGGAAAAGGATATTACTGG
Reverse TGACTGTTTCTTATCAGCGG |
| ABFR48 | PFL0005w | Forward GCATGTGAATCTAACCTTATG
Reverse GGTGGCATAATTCCTCTGGG |
| AFBRNT6 | NP_704468.1 | Forward CGGAAATGGAAGTGCAAGTG
Reverse CCTTGATTTTCGTTGTTCCC |
Table 2.
Comparison between AFBR nomenclature8,9 and PlasmoDB (Release 4.4) 3D7 P. falciparum gene name22,27 or accession no. for transcripts amplified using previously reported primers12
| AFBR code | PlasmoDB gene name/accession no. |
|---|---|
| AFBR1 | PF08_0106 |
| AFBR4 | PFE1640w |
| AFBR5 | PFF0010w (MAL6P1.316) |
| AFBR8 | PFD1235w & MAL8P1.207 (MAL7P1.1) |
| AFBR11 | FPD0020c |
| AFBR12 | PFA0765c |
| AFBR13 | PFC0005w |
| AFBR16 | PF11_0007 |
| AFBR18 | MAL7P1.55 |
| AFBR20 | PFD0005w |
| AFBR21 | PF07_0049 |
| AFBR22b | PFD0995c |
| AFBR24 | PF08_0103 |
| AFBR25 | PFL1960w |
| AFBR27 | PF08_0142 |
| AFBR28 | PFF1595c (MAL6P1.1) |
| AFBR29 | PFL0020w |
| AFBR30 | PFB1055c |
| AFBR31 | PF10_0001 |
| AFBR34 | PFI1830c |
| AFBR36 | MAL7P1.50 |
| AFBR39a | PFE0005w |
| AFBR39b | MAL13P1.1 (PF13_0001) |
| AFBR40 | MAL13P1.356 (PF13_0364) |
| AFBR41 | PF10_0406 |
| AFBRNT1 | PF13_0003 |
| AFBRNT2 | PFA0005w |
| AFBRNTA | PFD1015c |
| AFBRNTH | PFL0030c |
| AFBRNTJ | PFL1955w |
Gene names in parentheses refer to previously assigned name.
Analysis of RT-PCR data
RNA transcripts identified in each of the clones were analyzed, and the relative quantity of each var variant was estimated as the number of sequences for the specified variant divided by the total number of sequences. These proportions were expressed relative to the dominant variant in the sample (proportion of var variant x/proportion of dominant var variant).
Because the relative proportion of each variant in a clone is not independent of other variant proportions in the same clone, standard statistical methods to estimate confidence intervals (CIs) of the relative proportion could not be used. Instead, Markov chain Monte Carlo (MCMC) simulation was performed using the WinBUGS package (Version 1.4; Imperial College and MRC, London, UK). The ratio of each variant to the dominant variant in a sample was simulated assuming a multinomial distribution for the number of sequences of each variant, and non-informative prior distributions for the probability of selecting a bacterial colony corresponding to the variant. The model was fit to the RT-PCR sequence frequency data and the 2.5 and 97.5 percentiles for the ratio of variants was determined from 5,000 simulations after a run-in in period of 1,000 simulations. These 2.5 and 97.5 percentiles are referred to as the 95% CIs for the relative proportion of a variant.
Data analysis of real-time RT-PCR and PCR output
The average CT value of each triplicate from the RNA experiments was calculated, and the number of positive wells per triplicate was noted. These data were sorted by CT value and grouped into one-cycle intervals. Results from the DNA control experiments were treated in an identical manner. The SD of CT values and the detection frequency was calculated for each CT group. Detection frequency was given by (∑positive wells)/(3 × number of samples in the CT group).
To account for potential differences in the performance of individual primer pairs, the specific var primers and the primer set for the endogenous control gene, s-tRNA syn, were tested using serial dilutions of 3D7 DNA as a template. All var primer pairs except for two were specific for one var gene within the 3D7 genome. Hence, the “primer bias” for a specific primer set could be assessed by comparing the CT value for a specific var variant to that of s-tRNA syn:
where pi is the primer bias for primer set i, cti is the CT value for primer i on a DNA template, and cts-tRNA syn is the CT value for the s-tRNA syn primer on the same DNA template. To overcome any inter-experimental variation, amplification of each specific primer pair on 3D7 DNA was repeated at least three times and always run in triplicate. The average “primer bias” was calculated from these replicates. Two primer sets were able to bind two var genes each (PFL1970w/PFL1955w and PFD0995c/PFD1000c), so their primer bias was adjusted to -(ln[2-pi/2])/ln(2).
The amplification efficiencies of the s-tRNA syn and specific var primer sets were compared by calculating pi for sev- eral DNA concentrations and plotting log(pi) against DNA concentration. A simple linear regression model was fitted. The amplification efficiencies for the specific primer set and the s-tRNA syn primer set were considered to be similar if the slope of the regression line was not significantly different from zero at P = 0.05.20
The amount of each variant in the sample was expressed relative to the amount of the endogenous reference gene, s-tRNA syn (equations 1 and 2). The total quantity of var transcript detected in the sample was estimated by summing fi,c across all transcripts tested for in a sample.
| (1) |
| (2) |
where cT,i is the mean CT value for the triplicates of var variant i on an RNA template, cT,s-tRNAsyn is the mean CT value for the triplicates of the s-tRNA syn on an RNA template, pi is the primer bias for variant i, and fi,c is the amount of transcript i relative to the control gene.
The amount of each variant in the sample relative to the dominant variant was also calculated (equation 3), along with corresponding CIs (equations 4 and 5). CIs were calculated using standard statistical methods for the difference between means.
| (3) |
where i is the variant of interest, j is the dominant variant, and fi,d is the amount of transcript i relative to the dominant transcript.
| (4) |
| (5) |
where sei,d is the SE for the relative amount of variant i compared with the dominant variant j, sdc,i and sdc,j are the SDs of the triplicates for variant i and dominant variant j, respectively, sdp,i and sdp,j are the SDs for the primer bias of variant i and dominant variant j, nc,i and nc,j are the number of positive wells for variant i and j (nc,i, nc,j = 2 or 3), and np,i and np,j are the number of samples used to estimate the primer bias of transcripts i and j. Where only one well in a triplicate returned a positive result, the value was used as an estimate of (sdc,i2/nc,i) in equation 4.
Using RT-PCR results to predict real-time RT-PCR outcomes
The samples used in this study, although derived from clonal parasite cultures, continue to undergo antigenic variation. As a consequence, a sample is likely to contain sub-populations, the largest of which is the dominant var transcript, with numerous minor populations transcribing different variants. To estimate if the real-time PCR was likely to detect these minor populations, the expected CT value for each variant within a parasite sample was calculated based on the CT value of the dominant transcript, the primer bias of the specific primers, and the expected difference in transcript frequencies (from conventional RT-PCR results; equation 6).
| (6) |
where yi is the expected CT value for transcript i in the real-time RT-PCR assay and ri is the relative frequency of transcript i compared with the dominant transcript in the RT-PCR results.
RESULTS
A total of 12 clonal parasite populations were analyzed in this study. Seven of these clones had RNA extracted from parasites harvested on Days 12 and 16, whereas the remaining five clones only had extracted RNA from the Day 12 harvest. This provided a total of 19 samples. Samples are identified by an arbitrarily assigned clone number and the day of parasite harvest (i.e., 2_12 indicates RNA from clone 2 on Day 12).
Primer bias and amplification efficiencies for real-time PCR
This study involved the use of 39 different primer sets: 1 for s-tRNA syn and 38 specific ones for individual members of the var multigene family. For the 38 specific primers, the mean primer bias compared with the s-tRNA syn was 0.08 cycles with interquartile range of −1.27 to −0.17 cycles. Twenty-three primers (61%) had an absolute primer bias of less than one cycle, whereas six (16%) had a bias of greater than two cycles. All primers with a bias of greater than two cycles had a positive primer bias (i.e., performed less well than s-tRNA syn).
The amplification efficiencies of 17 randomly selected specific var primer sets were compared with that of the s-tRNA syn primer. The remaining specific primers were not tested because limited results were available across the different DNA concentrations. Sixteen primers showed approximately equal amplification efficiencies with s-tRNA syn (P > 0.05; data not shown). One set of primers did not show equal efficiencies over the entire DNA range having reduced efficiency at the lowest DNA concentration, a concentration typically lower than that of the RNA samples.
Detection frequency and reproducibility of real-time RT-PCR and PCR
During this study, 414 and 123 CT values were obtained from DNA and RNA samples, respectively. The observed CT values ranged from 26.3 to 40.0 cycles for DNA samples and 28.5 to 40.0 cycles for RNA samples (Figure 1). The patterns in detection frequency and reproducibility were similar for the DNA and RNA samples. The detection frequency (number of wells yielding a product/number of test wells) was consistently high for CT values < 32.5, but decreased rapidly for CT values > 37.5 cycles. Based on the average detection frequency, samples with CT values > 37.5 would be expected to return at least one negative result per triplicate.
Figure 1.
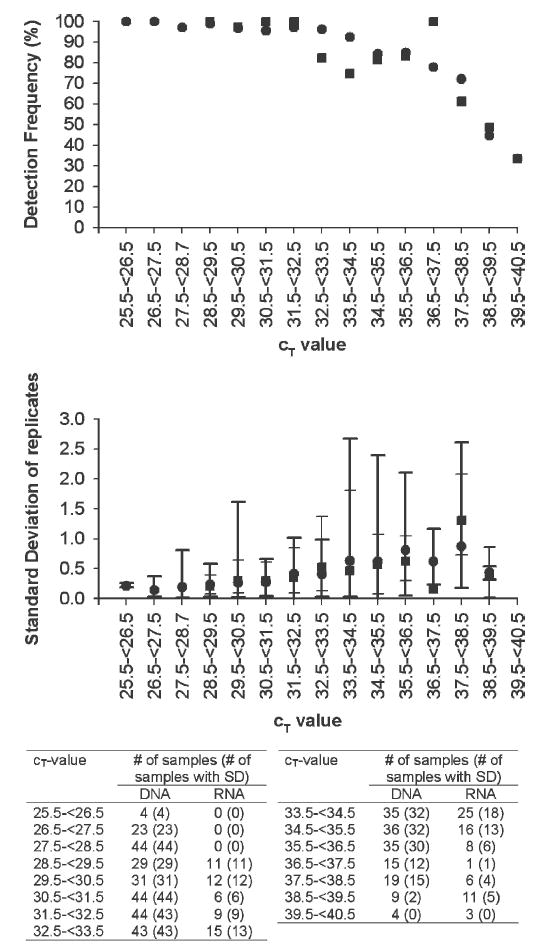
Detection frequency and sensitivity of real-time PCR for DNA (•) and RNA (▪) samples. Error bars represent the range of SDs obtained from DNA (heavy line) and RNA (light line) samples.
The mean SD of each triplicate (Figure 1) was used to assess the reproducibility of the real-time RT-PCR. Only samples having at least two positive wells per triplicate were included in this analysis. A gradual increase in the SD of triplicates was observed with increasing CT value; however, the range of values dramatically increased for CT values > 33.5, indicating decreased reproducibility.
Predicting real-time RT-PCR outcomes
By calculating the expected CT value for minor transcripts in the real-time RT- PCR assay, 17 variants in 12 samples (including multiple testing of some samples) were identified as having expected CT values within the region of decreased real-time RT-PCR detection sensitivity (Table 3). The majority (83%) of these samples were from parasites harvested at Day 12 of culturing. Of these 17 variants, 14 were not seen in the corresponding real-time experiment (Table 3).
Table 3.
Parasite samples predicted to contain minor transcripts at levels within the region of decreased real-time RT-PCR detection frequency
| Clone | No. variants observed in RT-PCR | No. variants predicted to be undetectable using real-time RT-PCR | Expected CT value of predicted undetectable transcripts | No. (+)ve wells observed in real-time RT-PCR triplicate (mean CT value) |
|---|---|---|---|---|
| 2_12 (exp 1) | 3 | 1 | 39.8–42.1 | 0 |
| 2_12 (exp 2) | 3 | 1 | 40.0–42.4* | 1 (38.0) |
| 2_12 (exp 3) | 3 | 2 | 43.9–46.22 | 0 |
| 38.36–40.68 | 0 | |||
| 3_12 | 4 | 1 | 38.12–40.44 | 0 |
| 3_16 | 6 | 1 | 40.9–42.8 | 0 |
| 4_16 | 4 | 1 | 38.4–39.4 | 0 |
| 5_12 | 6 | 1 | 36.8–39.1 | 0 |
| 9_12 (exp 1) | 3 | 1 | 36.6–39.0 | 0 |
| 9_12 (exp 2) | 3 | 3 | 39.1–41.5 | 3 (33.3) |
| 39.4–41.7 | 0 | |||
| 37.8–40.1 | 0 | |||
| 10_12 (exp 1) | 4 | 2 | 44.5–46.8* | 0 |
| 38.6–40.9 | 0 | |||
| 10_12 (exp 2) | 4 | 2 | 45.2–47.6* | 0 |
| 39.3–41.6 | 0 | |||
| 12_12 | 6 | 1 | 38.0–40.4 | 1 (39.9) |
Clones 2_12, 9_12 and 10_12 were analysed multiple times, with the results of each analysis presented individually.
Transcript is unlikely to be detected even if it was present at the same level as the dominant var transcript.
Comparison of RT-PCR and real-time RT-PCR results
The relative amounts of transcripts within samples were estimated separately using the RT-PCR results and real-time RT-PCR results. A total of 861 insert containing bacterial colonies from the 19 samples were sequenced to give the results for the RT-PCR.
The total quantity of var transcripts detected in each sample, relative to s-tRNA syn transcription, ranged from 0.2 to 14.8, with a mean of 4.1 ± 3.4 (SD) (Figure 2). Two clones (10_12 and 12_12) appeared to have a small relative quantity of var transcript compared with the other clones used in this study (Figure 2) and other studies conducted in the laboratory (data not shown). In 11 of the 19 (58%) samples tested, the number of transcripts detected using the real-time assay was less than that obtained from the RT-PCR (Figure 2); a total of 18 transcripts were not detected in these 11 samples.
Figure 2.
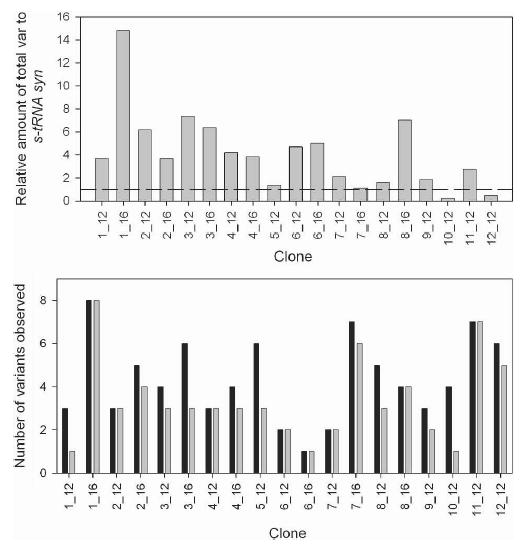
Comparison of (A) the total quantity of var transcripts measured in the real-time RT-PCR relative to the endogenous control and (B) the number of transcripts detected using RT-PCR (black) and real-time RT-PCR (gray) in each clone. In A, the dashed line represents the transcription level of the endogenous control s-tRNA syn. For all clones except 5_12, the number of specific var primers tested in the real-time RT-PCR equaled the number of variants observed in the RT-PCR. For clone 5_12 only, five specific var primers were used.
In 79% (15/19) of samples tested, the variant identified as being dominant in the RT-PCR was also dominant in the real-time assay. Details of the samples where differences in the dominant transcript were detected are contained in Table 4 These samples are excluded from the following analysis. For those transcripts detected using both techniques, the relative amount of each variant within a sample compared with the dominant variant (as identified in the conventional RT-PCR experiment) was calculated for each sample, and the values obtained using the real-time RT-PCR and conventional RT-PCR were compared (supplemental data). Forty-six percent (17/37) of comparisons indicated that the real-time RT-PCR and conventional RT-PCR produced similar estimates. Of the comparisons where differences were identified, all except one (95%) had lower estimates of relative quantity from the real-time RT-PCR compared with the RT-PCR results.
Table 4.
Details of clones that had different dominant transcripts detected using RT-PCR and real-time RT-PCR
| Dominant transcript
|
95% CI for relative proportion of variant B compared with variant A
|
|||
|---|---|---|---|---|
| Clone | RT-PCR (variant A) | Real-time RT-PCR (variant B) | RT-PCR | Real-time RT-PCR |
| 4_12 | AFBR28 | AFBRNTA | 0.01–0.21 | 2.80–5.13 |
| 4_16 | AFBR28 | AFBRNTA | 0–0.10* | 3.37–7.40 |
| 5_12 | AFBR28 | AFBR40 | 0.04–0.28 | 2.31–6.25 |
| 9_12 | AFBR28 | AFBR40 | 2.3 × 10⁻³–0.10 | 1.83–6.37 |
AFBRNTA not detected in RT-PCR.
DISCUSSION
This study used two PCR methods to detect and measure the relative quantities of var gene transcripts present in a set of samples from freshly cloned P. falciparum parasite cultures. The study provided an ideal opportunity to assess the reproducibility and detection frequency of real-time RT-PCR, an important issue for quantification of samples with low DNA or RNA levels. Although our harvested clone on Day 12 contained ~7,000 parasites per sample, only 0.56% of the extracted RNA was added to each real-time RT-PCR well, resulting in high CT values. A decrease in the detection frequency of samples was observed for CT values > 37.5 cycles, whereas CT values > 33.5 cycles were identified as having decreased reproducibility. These values were independent of whether DNA or RNA was being tested and are in good agreement with those previously reported using the LightCycler assay system.21
The use of real-time RT-PCR to assess the relative quantities of different var transcripts within samples necessitated developing a way to compare transcripts amplified using different specific primers. To address any potential differences in primer performance, repeated real-time amplification of a 3D7 DNA dilution series was performed. The majority of var genes in the 3D7 genome are present as single copies, as is the housekeeping gene seryl-tRNA synthetase,22 meaning each gene will be present in equal quantities in the prepared DNA standards. Differences in the CT values obtained on amplification of the DNA were assumed to be related to primer performance (efficiency in annealing to templates and extension, etc.) and were termed “primer bias.” The majority of primers showed little primer bias; however, several primers showed dramatically decreased CT values compared with the internal control. Ideally these primers should be redesigned.
The small quantity of RNA able to be extracted from the parasites and used in this study meant that only a sub-set of var transcripts could be tested for in the real-time assay. This presents a limitation of the study. Selection of the var primers used in the real-time assay was based on the assumption that the major transcripts would be correctly identified by the RT-PCR assay. This was not always the case, with a change in dominant transcript noted in four samples (21%). In each of these four samples, AFBR28 (MAL6P1.1) was the dominant transcript in the RT-PCR system, but either AFBR40 or AFBRNTA was dominant in the real-time assay. One possible explanation for the discrepancy is that the universal primers used in the RT-PCR assay have a reduced affinity for AFBR40 and AFBRNTA when AFBR28 is present above a certain level in the population. In a previous study of primer bias,8 the AFBRNTA transcript was not observed in 140 individual αAF/αBR inserts obtained from 3D7 P. falciparum genomic DNA, suggesting a possible bias against PCR amplification of this transcript.
The total quantity of var transcript measured in the real-time assay, relative to the endogenous control, was used as an indicator of whether the primers used in the assay represented the majority of transcripts in the sample. There was considerable variability in the estimated total var production between clones. This may be caused by differences in the overall production of var transcripts by the parasite or by our limited testing for different transcripts. Two clones (10_12 and 12_12) had noticeably lower estimates of total var than the other clones. Interestingly, these two clones were both identified as having AFBR28 dominant in the RT-PCR results. Of our 19 samples, 6 were identified as having AFBR28 dominant in the RT-PCR system. The results of the real-time analysis revealed that four of the six AFBR28 dominant samples had a change in dominant type, whereas the remaining two had the lowest estimate of total var transcription, indicating that one or more major transcripts may not have been detected in these samples. Notably, the two transcripts identified as dominant by the real-time assay (AFBR40 and AFBRNTA) in another clone were not detected by RT-PCR in clones 10_12 and 12_12 and were consequently not tested for in the real-time analysis.
Before this study, we hypothesized that quantifying transcript frequency using conventional RT-PCR amplification followed by cloning and sequencing may over-estimate the frequency of minor transcripts. This was primarily based on the assumption that dominant transcripts become abundant and would plateau earlier in the PCR process, whereas the minor transcripts, although not abundant early in the amplification process, could, after 40 cycles, also peak and plateau. Our comparison of transcript quantification by RT-PCR and real-time RT-PCR indicated that, while there was little difference in the estimates obtained in 46% of cases, where differences were apparent, there was a propensity for estimates obtained from the real-time system to be lower than those of the corresponding RT-PCR, supporting the hypothesis. The real-time RT-PCR assay was better able to rank the prevalence of transcripts compared with the RT-PCR assay caused by the CT values being continuous variables compared with the discrete count data on which the RT-PCR results are based. The failure of the real-time PCR assay to detect transcripts in some samples was most probably caused by the CT value being below the limits of detection for the real-time PCR assay caused by the relatively low abundance of the transcript.
The results of this study have shown that when there is sufficient abundance of RNA transcripts for the real-time RT-PCR assay to be operating within the region of good reproducibility, RT-PCR and real-time RT-PCR tended to produce similar results in relation to determining major transcripts. Discrepancies in identifying the major transcript are most probably caused by primer issues that can now, with hindsight, be resolved. Estimates of the prevalence of minor transcripts were either similar or over-predicted by the conventional RT-PCR system. This is an important consideration when research into antigenic variation spans both laboratory and field studies, particularly when real-time RT-PCR is not currently a practical option for the analysis of field samples.
Although this study focuses on the var gene family in P. falciparum, other organisms also use antigenic variation. In some organisms such as trypanosomes, the process is well characterized and understood; however, in others, such as Anaplasma phagoctophilum,23 Giardia lamblia,24 G. muris,25 and Campylobacter fetus,26 the process is still under study. As time passes, it is likely that more organisms will be identified as pathogens using antigenic variation as a survival strategy. This being the case, the results of this study will provide valuable baseline information on methodological issues associated with low abundance samples.
Supplementary Material
Acknowledgments
We thank the Australian Red Cross Blood Service for supply of human blood and serum for the in vitro cultivation of the parasites used in this study, and Dr. Dennis Kyle for support of the real-time PCR component of this project. The opinions expressed herein are those of the authors and do not necessarily reflect those of the Defence Health Service or any extant policy of Department of Defence, Australia.
Footnotes
Note: Supplemental data for this manuscript can be found online at www.ajtmh.org.
Authors’ addresses: Michelle L. Gatton, Jennifer M. Peters, Karryn Gresty, and Elizabeth V. Fowler, Malaria Drug Resistance and Chemotherapy Laboratory, Queensland Institute of Medical Research, PO Royal Brisbane Hospital, Herston, Queensland, Australia 4029, Emails: michelle.gatton@qimr.edu.au, jennifer.peters@defence. gov.au, and beth.fowler@qimr.edu.au. Nanhua Chen and Qin Cheng, Australian Army Malaria Institute, Weary Dunlop Drive, Gallipoli Barracks, Enoggera, Queensland, Australia, 4051, Emails: nanhua.chen@defence.gov.au and qin.cheng@defence.gov.au.
Financial support: This work was supported by NIH grants 2RO1 AI-47500-04, -05. Michelle Gatton was supported in part by a University of Queensland Postdoctoral Research Fellowship.
References
- 1.Saul A. The role of variant surface antigens on malaria-infected red blood cells. Parasitol Today. 1999;15:455–457. doi: 10.1016/s0169-4758(99)01534-3. [DOI] [PubMed] [Google Scholar]
- 2.Gatton ML, Martin LB, Cheng Q. The evolution of resistance to sulfadoxine-pyrimethamine in Plasmodium falciparum parasites. Antimicrob Agents Chemother. 2004;48:2116–2123. doi: 10.1128/AAC.48.6.2116-2123.2004. [DOI] [PMC free article] [PubMed] [Google Scholar]
- 3.Bull PC, Lowe BS, Kortok M, Molyneux CS, Newbold CI, Marsh K. Parasite antigens on the infected red cell surface are targets for naturally acquired immunity to malaria. Nat Med. 1998;4:358–360. doi: 10.1038/nm0398-358. [DOI] [PMC free article] [PubMed] [Google Scholar]
- 4.Ofori MF, Dodoo D, Staalsoe T, Kurtzhals JA, Koram K, The-ander TG, Akanmori BD, Hviid L. Malaria-induced acquisition of antibodies to Plasmodium falciparum variant surface antigens. Infect Immun. 2002;70:2982–2988. doi: 10.1128/IAI.70.6.2982-2988.2002. [DOI] [PMC free article] [PubMed] [Google Scholar]
- 5.Gatton ML, Cheng Q. Modelling the development of acquired clinical immunity to falciparum malaria. Infect Immun. 2004;72:6538–6545. doi: 10.1128/IAI.72.11.6538-6545.2004. [DOI] [PMC free article] [PubMed] [Google Scholar]
- 6.Kyes S, Horrocks P, Newbold C. Antigenic variation at the infected red cell surface in malaria. Annu Rev Microbiol. 2001;55:673–707. doi: 10.1146/annurev.micro.55.1.673. [DOI] [PubMed] [Google Scholar]
- 7.Horrocks P, Pinches R, Christodoulou Z, Kyes SA, Newbold CI. Variable var transition ratse underlie antigenic variation in malaria. Proc Natl Acad Sci USA. 2004;101:11129–11134. doi: 10.1073/pnas.0402347101. [DOI] [PMC free article] [PubMed] [Google Scholar]
- 8.Taylor HM, Kyes SA, Harris D, Kriek N, Newbold CI. A study of var gene transcription in vitro using universal var gene primers. Mol Biochem Parasitol. 2000;105:13–23. doi: 10.1016/s0166-6851(99)00159-0. [DOI] [PubMed] [Google Scholar]
- 9.Peters J, Fowler E, Gatton M, Chen N, Saul A, Cheng Q. High diversity and rapid changeover of expressed var genes during acute phase of Plasmodium falciparum infections in human volunteers. Proc Natl Acad Sci USA. 2002;99:10689–10694. doi: 10.1073/pnas.162349899. [DOI] [PMC free article] [PubMed] [Google Scholar]
- 10.Wunderlich G, Alves P, Gölnitz U, Tada MS, de-Camargo EFP, Pereira-da-Silva LH. Rapid turnover of Plasmodium falciparum var gene transcripts and genotypes during natural non-symptomatic infections. Rev Inst Med Trop Sao Paulo. 2005;47:195–201. doi: 10.1590/s0036-46652005000400004. [DOI] [PubMed] [Google Scholar]
- 11.Kaestli M, Cortes A, Lagog M, Ott M, Beck HP. Longitudinal assessment of Plasmodium falciparum var gene transcription in naturally infected asymptomatic children in Papua New Guinea. J Infect Dis. 2004;189:1942–1951. doi: 10.1086/383250. [DOI] [PubMed] [Google Scholar]
- 12.Salanti A, Staalsoe T, Lavstsen T, Jensen AT, Sowa MP, Arnot DE, Hviid L, Theander TG. Selective upregulation of a single distinctly structured var gene in chondroitin sulphate A-adhering Plasmodium falciparum involved in pregnancy-associated malaria. Mol Microbiol. 2003;49:179–191. doi: 10.1046/j.1365-2958.2003.03570.x. [DOI] [PubMed] [Google Scholar]
- 13.Jensen AT, Magistrado P, Sharp S, Joergensen L, Lavstsen T, Chiucchiuini A, Salanti A, Vestergaard LS, Lusingu JP, Herm-sen R, Sauerwein R, Christensen J, Nielsen MA, Hviid L, Sutherland C, Staalsoe T, Theander TG. Plasmodium falciparum associated with severe childhood malaria preferentially expresses PfEMP1 encoded by Group A var genes. J Exp Med. 2004;199:1179–1190. doi: 10.1084/jem.20040274. [DOI] [PMC free article] [PubMed] [Google Scholar]
- 14.Lavstsen T, Magistrado P, Hermsen CC, Salanti A, Jensen AT, Sauerwein R, Hviid L, Theander TG, Staalsoe T. Expression of Plasmodium falciparum erythrocyte membrane protein 1 in experimentally infected humans. Malar J. 2005;4:21. doi: 10.1186/1475-2875-4-21. [DOI] [PMC free article] [PubMed] [Google Scholar]
- 15.Duffy MF, Byrne TJ, Elliott SR, Wilson DW, Rogerson SJ, Bee-son JG, Noviyanti R, Brown GV. Broad analysis reveals a consistent pattern of var gene transcription in Plasmodium falciparum repeatedly selected for a defined adhesion phenotype. Mol Microbiol. 2005;56:774–788. doi: 10.1111/j.1365-2958.2005.04577.x. [DOI] [PubMed] [Google Scholar]
- 16.Fowler EV, Peters JM, Gatton ML, Chen N, Cheng Q. Genetic diversity of the DBLalpha region in Plasmodium falciparum var genes among Asia-Pacific isolates. Mol Biochem Parasitol. 2002;120:117–126. doi: 10.1016/s0166-6851(01)00443-1. [DOI] [PubMed] [Google Scholar]
- 17.Roberts DJ, Craig AG, Berendt AR, Pinches R, Nash G, Marsh K, Newbold CI. Rapid switching to multiple antigenic and adhesive phenotypes in malaria. Nature. 1992;357:689–692. doi: 10.1038/357689a0. [DOI] [PMC free article] [PubMed] [Google Scholar]
- 18.Cheng Q, Lawrence G, Reed C, Stowers A, Ranford CL, Creasey A, Carter R, Saul A. Measurement of Plasmodium falciparum growth rates in vivo: a test of malaria vaccines. Am J Trop Med Hyg. 1997;57:495–500. doi: 10.4269/ajtmh.1997.57.495. [DOI] [PubMed] [Google Scholar]
- 19.Bozdech Z, Llinás M, Pulliam BL, Wong ED, Zhu J, DeRisi JL. The transcriptome of the intraerythrocytic development cycle of Plasmodium falciparum. PLoS Biol. 2003;1:85–100. doi: 10.1371/journal.pbio.0000005. [DOI] [PMC free article] [PubMed] [Google Scholar]
- 20.Livak KJ, Schmittgen TD. Analysis of relative gene expression data using real-time quantitative PCR and the 2−ΔΔcT method. Methods. 2001;25:402–408. doi: 10.1006/meth.2001.1262. [DOI] [PubMed] [Google Scholar]
- 21.Soong R, Ladányi A. Improved indicators for assessing the reliability of detection and quantification by kinetic PCR. Clin Chem. 2003;49:973–976. doi: 10.1373/49.6.973. [DOI] [PubMed] [Google Scholar]
- 22.Gardner MJ, Hall N, Fung E, White O, Berriman M, Hyman RW, Carlton JM, Pain A, Nelson KE, Bowman S, Paulsen IT, James K, Eisen JA, Rutherford K, Salzberg SL, Craig A, Kyes S, Chan M, Nene V, Shallom SJ, Suh B, Peterson J, Angiuoli S, Pertea M, Allen J, Selengut J, Haft D, Mather MW, Vaidya AB, Martin DMA, Fairlamb AH, Fraunholz MJ, Roos DS, Ralph SA, Mc-Fadden GI, Cummings LM, Subramanian GM, Mungall C, Venter JC, Carucci DJ, Hoffman SL, Newbold C, Davis RW, Fraser CM, Barrell B. Genome sequence of the human malaria parasite Plasmodium falciparum. Nature. 2002;419:498–511. doi: 10.1038/nature01097. [DOI] [PMC free article] [PubMed] [Google Scholar]
- 23.Wang X, Rikihisa Y, Lai T, Kumagai Y, Zhi N, Reed SM. Rapid sequential changeover of expressed p44 genes during the acute phase of Anaplasma phagocytophilum infection in horses. Infect Immun. 2004;72:6852–6859. doi: 10.1128/IAI.72.12.6852-6859.2004. [DOI] [PMC free article] [PubMed] [Google Scholar]
- 24.Nash TE. Surface antigenic variation in Giardia lamblia. Mol Microbiol. 2002;45:585–590. doi: 10.1046/j.1365-2958.2002.03029.x. [DOI] [PubMed] [Google Scholar]
- 25.Ropolo AS, Saura A, Carranza PG, Lujan HD. Identification of variant-specific surface proteins in Giardia muris trophozoites. Infect Immun. 2005;73:5208–5211. doi: 10.1128/IAI.73.8.5208-5211.2005. [DOI] [PMC free article] [PubMed] [Google Scholar]
- 26.Tu ZC, Gaudreau C, Blaser MJ. Mechanisms underlying Campylobacter fetus pathogenesis in humans: surface-layer protein variation in relapsing infections. J Infect Dis. 2005;191:2082–2089. doi: 10.1086/430349. [DOI] [PubMed] [Google Scholar]
- 27.Kissinger JC, Brunk BP, Crabtree J, Fraunholz MJ, Gajria B, Milgram AJ, Pearson DS, Schug J, Bahl A, Diskin SJ, Ginsburg H, Grant GR, Gupta D, Labo P, Li L, Mailman MD, McWeeney SK, Whetzel P, Stoeckert CJ, Roos DS. The Plasmodium genome database. Nature. 2002;419:490–492. doi: 10.1038/419490a. [DOI] [PubMed] [Google Scholar]
Associated Data
This section collects any data citations, data availability statements, or supplementary materials included in this article.