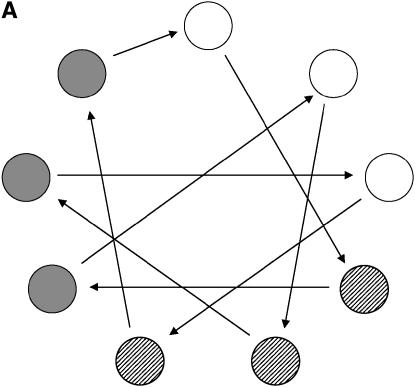
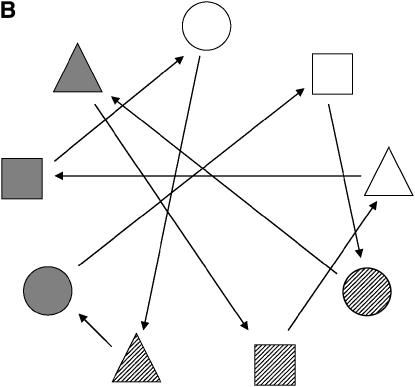
Figure 6.—
Optimal design for a microarray experiment with nine treatments, having random effects, representing nine progenies from hierarchical (A) and factorial (B) mating systems (Table 3). (A) Different circle shadings refer to different paternal half-sibs. (B) Each shape and shading denote a different dam and sire, respectively. In both cases, each geometric figure represents a subject (biological replication), which is assayed in two slides each (technical replication).


