Abstract
Replicable populations, such as panels of recombinant inbred or doubled haploid lines, are convenient resources for the mapping of QTL. To increase mapping power, replications are often collected within each RI line and a common way to analyze such data is to include in the QTL model only a single measurement from each line that represents the average among the replicates (a line means model). An obvious, but seldom explored, alternative, is to include every replicate in the model (a full data model). Here, we use simulations to compare these two approaches. Further, we propose an extension of the standard permutation procedure that is required to correctly control the type I error in mapping populations with nested structure.
PANELS of recombinant inbred (RI) lines, generated by either recurrent sib mating or selfing, constitute a valuable resource for the genetic dissection of quantitative traits and particularly for the mapping of quantitative trait loci (QTL) (Bailey 1971; Swank and Bailey 1973; Watson et al. 1977; Plomin et al. 1991b). With RI panels, as with other true-breeding populations such as panels of doubled haploid (DH) lines, marker genotypes need be measured only once and the trait value for a given genotype can be measured in replicated individuals. The same panel can be used by different investigators and at different times, permitting the dissection of multiple correlated traits even when such traits are measured under different environmental conditions (Plomin et al. 1991a).
In a limited number of systems (e.g., maize, Drosophila), replicable mapping populations that contain hundreds of lines exist (Johnson and Wood 1982; Burr et al. 1988; Reiter et al. 1992; Fry et al. 1998). In other systems, however, such populations have historically been much smaller. For instance, typical mouse RI panels consist of only 15–35 lines.
When using small panels, researchers have generally replicated lines within a given experiment to maximize QTL detection power. However, it is not widely appreciated that even though increased replication of individual lines does improve detection power, it is not equivalent to using a greater number of lines. For any given QTL model, the trait variance can be divided into three components: (1) the variance explained by the QTL in the model, (2) the variance explained by QTL or polygenes not in the model, and (3) nongenetic variance (Knapp and Bridges 1990). Increasing the number of lines decreases variances 2 and 3 while increasing the number of individuals per line decreases only variance 3. An important consequence is that the more genes there are that contribute to variation in a trait, the less well replication of individual lines compensates for having a small number of them.
Unlike backcross and F2 intercross populations, where all subjects have identical genetic relatedness to each other, subjects in panels with replicates do not have the same genetic relatedness to one another. For instance, in an intercross RI panel, the replicates within a line have identical genotypes but share only half their genetic composition with other lines. For QTL mapping of univariate traits, the common solution to the presence of replicates is to include in the model only a single measurement from each line representing the average among the replicates (e.g., Alonso-Blanco et al. 1998) and thus avoid the need of modeling unequal relatedness among subjects. When the experiment is balanced (i.e., the number of replicates per line is constant or nearly so), the use of the line means model should result in little loss of power. However, if the data are extremely unbalanced, averaging the measurements within each line results in unequal variances among the lines and potential loss of QTL detection power. An alternative would be to fit a model that accounts for each individual observation, or what we call a full data model. How the line means model performs compared to the full data model has not been investigated and careful investigation would provide us with useful practical guidelines.
An important issue with the QTL mapping is the choice of an appropriate statistical threshold (i.e., critical value) for rejection of the null hypothesis H0 and control of type I error. The most commonly used approach for the line means model is that of Churchill and Doerge (1994), in which trait observations are reassigned without replacement among the subjects. The distribution of the maximum test statistic obtained in a large number of permutations is used to empirically estimate the genomewide threshold. However, permutation testing is limited to situations in which there is complete exchangeability under the null hypothesis. It is this exchangeability that ensures the validity of inference based on the permutation distribution. In the line means model, there is equal relatedness among all RI lines, which ensures exchangeability. In the full data model, where replicates of the same line have identical genotype across the whole genome, applying the standard permutation procedure would result in replicates of the same line being assigned different permuted genotypes, which is clearly not appropriate. As found by Zou et al. (2005) and Tsaih et al. (2005) in the context of QTL mapping in populations derived from crosses among RI lines, failing to adequately take complex relationships among individuals into account can result in astonishingly high rates of type I error.
To address the problem of choosing an appropriate statistical threshold for the full data model, we propose a simple modification to the standard permutation procedure, based on the work of Zou et al. (2005) and Tsaih et al. (2005), in which only the genotypes of the lines are permuted. That is, all replicates of a given line are assigned the same permuted genotype. With this nested permutation procedure, any two subjects will have the same relatedness before and after the permutation.
To our knowledge, there is no published comparison of the line means vs. the full data model. Thus, our goals of this article are twofold. First, we show that the nested permutation procedure successfully controls type I error when using the full data model while the standard permutation procedure does not. We then compare the power and false discovery rate of the line means model and the full data model (with the nested permutation procedure) in some simple, but instructive, univariate mapping scenarios. We use simulations to vary the number of lines, the variation in replication among lines, the density of markers, and the genetic architecture of the trait (including the presence or absence of background polygenic variation). We conclude that the two models have nearly equivalent power for the experimental designs considered here. Further studies will need to be done to determine if there exist more complex situations in which one model is preferable to the other.
METHODS
Notations and models:
We first introduce some notation and the alternative models. Suppose a total of L lines are used for mapping and that, within each line, there are ni individuals, i = 1, 2, … , L.
Let the individual trait values be  and the average traits be
  , where
  .
.
Two different models are used for QTL analysis. For simplicity, only single-marker analysis is considered. At the kth marker, we have the full data model, yij = μ + akxik + eij, i = 1, 2, … , L, j = 1, 2, … , ni, which reduces to the line means model,  if the average trait is used. In the above, μ is the grand mean; ak is the additive effect of the putative QTL (located at the kth marker); xik is an indicator of the genotype of line i at the kth marker; and eij, ei are random errors. All eij and therefore ei are assumed to be independent and identically distributed (i.i.d.) with normal distribution. We then test H0: ak = 0 vs. H1: ak ≠ 0 using an F-test at each marker.
Analysis:
We used simulations to empirically estimate significance thresholds under the null hypothesis. For each set of parameter values, the 95th percentile of the empirical distribution of maximum F-statistics from a large number (typically 1000) of simulations under the null hypothesis that no QTL (with or without background polygenes) was segregating was taken to be the empirical threshold, which can be regarded as the true threshold and provides a benchmark for evaluating the performance of the permutation-based threshold. Further, type I error rates under the standard and nested permutation procedures were calculated and compared to the targeted type I error.
To calculate true positive and false positive QTL detection rates, we adopted the conventions of Xu et al. (2005). A peak was defined as a point where the test statistic exceeded both the critical value and the test statistic of adjacent points (or point, if at the end of a linkage group). The range of the peak was taken to be the interval on either side of the peak bounded by the end of the linkage group or by that point closest to the peak with a test statistic below the critical value, whichever came first. The position of the highest peak within the range was taken to be the QTL position. If the range bracketed a true QTL position, then the peak was counted as a true positive (TP); otherwise, it was counted as a false positive (FP).
SIMULATIONS AND RESULTS
Simulations:
RI panels were simulated by recurrent selfing from an F2 population (i.e., “single-seed descent”) until all markers were homozygous. For each set of parameters, 1000 simulations were obtained. Within each simulation, 1000 permutations were conducted.
Under the null hypothesis that no QTL was present, errors were sampled from a standard normal distribution. The number of replicates per line was either held constant (balanced) at n = 2, 5, or 10 or allowed to vary (unbalanced). In the latter case, the number of replicates was randomly assigned to each line as 2, 5, or 10 with probabilities of 0.4, 0.5, and 0.1, respectively. One linkage group of 1000 cM with markers spaced evenly at either 5- or 10-cM intervals was simulated. Zero (null hypothesis), one, or five QTL were simulated. The positions of the QTL were assigned randomly from uniform distribution along the linkage group, with the exception that, in the case of five QTL, the positions were constrained to be at least 100 cM apart from each other. QTL effects were sampled from a gamma (1, 2) distribution (Zeng 1992).
In the absence of polygenic background variation, errors were sampled from a normal distribution with mean 0 and variance  , determined by the sampled QTL effect such that the total heritability was constrained to 0.1 for the one-QTL case and 0.5 for the five-QTL case. To simulate polygenic background variation, random errors were sampled from a normal distribution with mean 0 and variance
  , where
  is the variance of the random error calculated above under no polygenic background variation. In addition, a normally distributed polygenic effect was added on top of the random error, if no QTL was simulated, or on top of both the simulated QTL effects and random errors, if one or more QTL were simulated. Specifically, a random number sampled from a normal distribution with mean 0 and variance
  was added to each line. The same polygenic effect was added to all the observations within the same line.
Results:
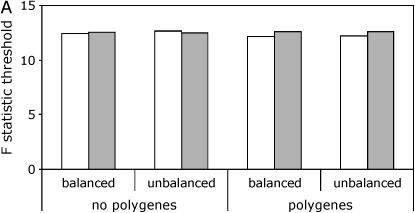
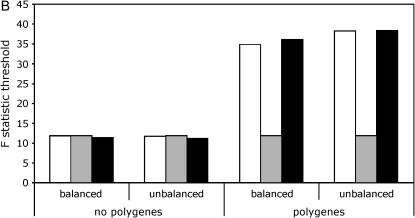
When using line means, the permuted thresholds were very close to the empirical thresholds regardless of whether or not polygenic background variation was present (Figure 1A, supplemental Tables S1 and S2 at http://www.genetics.org/supplemental/). For the full data model, the thresholds from the two permutation procedures were again similar to the empirical thresholds when no polygenic background variation was present. However, in the presence of polygenic background variation, the permuted thresholds based on the standard procedure were dramatically smaller than both the permuted thresholds based on the nested procedure and the empirical thresholds (Figure 1B, supplemental Tables S1 and S2).
Figure 1.—
Critical thresholds for QTL detection with different models and permutation procedures. Thresholds derived by simulation are labeled as “true.” Results are shown for a panel size of 100 lines and a marker spacing of 10 cM. (A) Line means model. True, open bars; standard, shaded bars. (B) Full data model. True, open bars; standard, shaded bars; nested, solid bars.
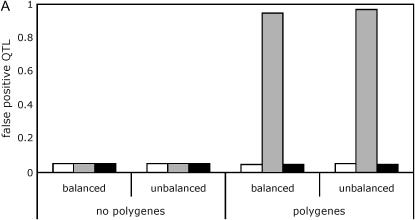
In the absence of polygenic background variation, all three analysis methods (the line means model, the full data model with the standard permutation, and the full data model with the nested permutation) effectively controlled the type I error (Figure 2A, supplemental Tables S3 and S4 at http://www.genetics.org/supplemental/). However, in the presence of polygenic background variation, the type I error of the full data model with the standard permutation was grossly inflated, in some cases approaching 100%.
Figure 2.—
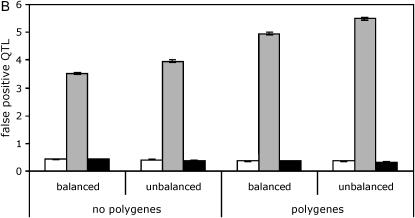
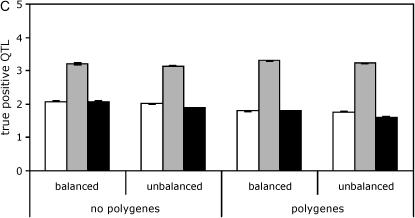
Effect of polygenic background variation and balance of design on QTL mapping. Results are shown for a panel size of 100 lines and a marker spacing of 10 cM. Line means, open bars; standard, shaded bars; nested, solid bars. (A) False positives. No QTL is present. (B) False positives. Five QTL are present. (C) True positives. Five QTL are present.
The false positive rate of the full data model with the standard permutation was grossly inflated when either or both QTL and polygenic background variation are present (Figure 2, A and B, supplemental Tables S5 and S6 at http://www.genetics.org/supplemental/). Thus, while the number of true positives was highest when using the full data model with the standard permutation (Figure 2C, supplemental Tables S3–S6 at http://www.genetics.org/supplemental/), the false discovery rate (FDR), defined as FDR = FP/(TP + FP), was also very high, typically >70% and as high as 90%. These false discovery rates were severalfold higher than those obtained using the line means model and the full data model with the nested permutation.
The full data model with nested permutations behaved very differently. The false positive rate was nearly constant whether or not polygenic background variation was present, while the true positive rate was depressed in the presence of polygenic background variation.
The effects of balance were surprisingly subtle. In comparing the full data model with nested permutation procedure to the line means model, the true and false positive rates were roughly similar in the balanced and unbalanced designs. Comparing the two permutation methods for the full data model, imbalance led to a modest increase in the number of false positives with standard permutations and a slight decrease with nested permutations. There was a slight decrease in the number of true positives for all three approaches when the design was unbalanced (Figure 2, supplemental Tables S3–S6 at http://www.genetics.org/supplemental/).
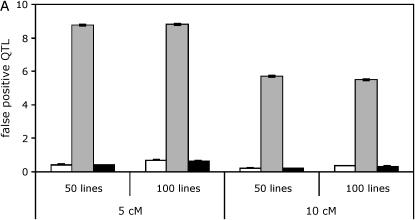
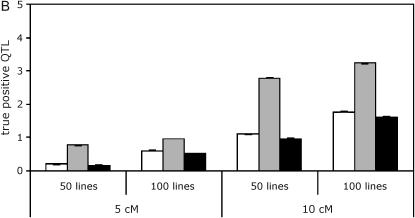
As expected, QTL tests are affected by aspects of experimental design such as the number of lines used and the spacing of markers on the linkage map. We explored whether these features of experimental design had differential effects on the three analysis methods (Figure 3, supplemental Tables S1–S6 at http://www.genetics.org/supplemental/). We found that a larger number of lines (100 vs. 50) led to a slight increase in the number of false positives with the line means model and the full data model using nested permutations but not, interestingly, with the full data model using standard permutations. The number of true positives was increased by using a greater number of lines for all three analysis methods. In general, the false discovery rates remain nearly constant or decrease slightly when the number of lines increases. A denser map resulted in an increase in the number of false positives and an increase or constant in the number of true positives depending on whether one or five QTL are simulated.
Figure 3.—
Effect of line number and marker spacing on QTL mapping. Results are shown for simulations with five QTL in an unbalanced design. Line means, open bars; standard, shaded bars; nested, solid bars. (A) False positives. (B) True positives.
DISCUSSION
The full data model with the standard permutation procedure fails to control the type I error at nominal levels when there is polygenic background variation and leads to false positive rates that are substantially elevated relative to the other two models. Even with the greater power, the false discovery rates under the full data model using standard permutations can be as high as 90%. We interpret this as due to the failure of the standard permutation procedure in adequately modeling the genetic structure of the full data model. Although the importance of controlling type I error in a QTL analysis is generally appreciated, it is not well known that a high type I error can result when using an inappropriate resampling procedure to obtain critical thresholds in a replicated mapping population. These results clearly show that when the full data model is used, the nested permutation procedure is necessary to control the type I error and the false positives. The nested permutation has been implemented in R for marker-based regression analysis and can be downloaded from http://www.bios.unc.edu/∼fzou/RIcode.
The nested permutation procedure is also to be implemented in QTL CARTOGRAPHER (Wang et al. 2003; Z.-B. Zeng, personal communication).
Further, our results demonstrate that the line means model (with the standard permutation procedure) and the full data model (with the nested permutation procedure) lead to similar results when analyzing a single normally distributed trait in a replicated mapping population. Using either of these two methods, the type I error is controlled close to the nominal level in the absence of any QTL, and the power and false discovery rates are nearly equivalent in the presence of QTL. This conclusion does not appear to be materially affected by the degree to which the experimental design is balanced. The simulations in this article support the widely used line means model for univariate QTL mapping. However, it would be worthwhile in the future to explore whether there are more complex situations in which one model may be strongly preferred over the other, such as QTL mapping of nonnormal or multivariate traits.
Here, we have ignored the covariance structure due to the polygenic effects and instead used simple analysis of variance (ANOVA) models. Alternatively, one could specifically model the correlation between any pairs of subjects within the same line or across different lines using mixed-effects models. Our preliminary results suggest that the simple ANOVA models examined here result in power and false positive rates very similar to those of the more complicated mixed models when analyzing RI data with replicates. Therefore, we have decided to use, and also recommend, the simpler ANOVA models for replicated RI data.
Acknowledgments
The authors thank the associate editor and two anonymous referees for helpful comments and suggestions. This work was partially supported by National Institutes of Health grants MH070504 and GM074175 (to F.Z.) and by National Science Foundation grant DBI-0110069 (to T.J.V.).
References
- Alonso-Blanco, C., S. E. El-Assal, G. Coupland and M. Koornneef, 1998. Analysis of natural allelic variation at flowering time loci in the Landsberg erecta and Cape Verde Islands ecotypes of Arabidopsis thaliana. Genetics 149: 749–764. [DOI] [PMC free article] [PubMed] [Google Scholar]
- Bailey, D. W., 1971. Recombinant-inbred strains. An aid to finding identity, linkage, and function of histocompatibility and other genes. Transplantation 11: 325–327. [DOI] [PubMed] [Google Scholar]
- Burr, B., F. A. Burr, K. H. Thompson, M. C. Albertson and C. W. Stuber, 1988. Gene mapping with recombinant inbreds in maize. Genetics 118: 519–526. [DOI] [PMC free article] [PubMed] [Google Scholar]
- Churchill, G. A., and R. W. Doerge, 1994. Empirical threshold values for quantitative trait mapping. Genetics 138: 963–971. [DOI] [PMC free article] [PubMed] [Google Scholar]
- Fry, J. D., S. V. Nuzhdin, E. G. Pasyukova and T. F. Mackay, 1998. QTL mapping of genotype-environment interaction for fitness in Drosophila melanogaster. Genet. Res. 71: 133–141. [DOI] [PubMed] [Google Scholar]
- Johnson, T. E., and W. B. Wood, 1982. Genetic analysis of life-span in C. elegans. Proc. Natl. Acad. Sci. USA 79: 6603–6607. [DOI] [PMC free article] [PubMed] [Google Scholar]
- Knapp, S. J., and W. C. Bridges, 1990. Using molecular markers to estimate quantitative trait locus parameters: power and genetic variances for unreplicated and replicated progeny. Genetics 126: 769–777. [DOI] [PMC free article] [PubMed] [Google Scholar]
- Plomin, R., G. E. Mcclearn, G. Gora-Maslak and J. M. Neiderhiser, 1991. a An RI QTL cooperative data bank for recombinant inbred quantitative trait loci analyses. Behav. Genet. 21: 97–98. [DOI] [PubMed] [Google Scholar]
- Plomin, R., G. E. Mcclearn, G. Gora-Maslak and J. M. Neiderhiser, 1991. b Use of recombinant inbred strains to detect quantitative trait loci associated with behavior. Behav. Genet. 21: 99–116. [DOI] [PubMed] [Google Scholar]
- Reiter, R. S., J. G. Williams, K. A. Feldmann, J. A. Rafalski, S. V. Tingey et al., 1992. Global and local genome mapping in Arabidopsis thaliana by using recombinant inbred lines and random amplified polymorphic DNAs. Proc. Natl. Acad. Sci. USA 89: 1477–1481. [DOI] [PMC free article] [PubMed] [Google Scholar]
- Swank, R. T., and D. W. Bailey, 1973. Recombinant inbred lines: value in the genetic analysis of biochemical variants. Science 181: 1249–1252. [DOI] [PubMed] [Google Scholar]
- Tsaih, S. W., L. Lu, D. C. Airey, R. W. Williams and G. A. Churchill, 2005. Quantitative trait mapping in a diallel cross of recombinant inbred lines. Mamm. Genomics 16: 344–355. [DOI] [PubMed] [Google Scholar]
- Wang, S., C. J. Basten and Z. B. Zeng, 2003. Windows QTL Cartographer 2.0. Department of Statistics, North Carolina State University, Raleigh, NC.
- Watson, J., R. Riblet and B. A. Taylor, 1977. The response of recombinant inbred strains of mice to bacterial lipopolysaccharides. J. Immunol. 118: 2088–2093. [PubMed] [Google Scholar]
- Xu, Z. L., F. Zou and T. J. Vision, 2005. Improving QTL mapping resolution in experimental crosses by the use of genotypically selected samples. Genetics 170: 401–408. [DOI] [PMC free article] [PubMed] [Google Scholar]
- Zeng, Z.-B., 1992. Correcting the bias of Wright's estimates of the number of genes affecting a quantitative character: a further improved method. Genetics 131: 987–1001. [DOI] [PMC free article] [PubMed] [Google Scholar]
- Zou, F., J. Gelfond, D. Airey, L. Lu, K. Manly et al., 2005. Quantitative trait locus analysis using recombinant inbred intercrosses (RIX): theoretical and empirical considerations. Genetics 170: 1299–1311. [DOI] [PMC free article] [PubMed] [Google Scholar]


