

Abstract
Gene expression profiling of suprachiasmatic nucleus, ventrolateral preoptic area and the lateral hypothalamus was used to identify genes regulated diurnally in the hypothalamus of Mus musculus. The putative transcription regulator, cysteine and histidine-rich domain-containing, zinc binding protein 1, which had not been previously described in brain, was found to cycle diurnally in hypothalamus and forebrain with peak levels of mRNA expression during the dark phase. mRNA for the brain-type fatty acid binding protein 7 was found to change rhythmically in hypothalamic and extra-hypothalamic brain regions reaching peak levels early in the light phase suggesting that lipid metabolism is under circadian regulation in astrocytes.
Rhythmically expressed genes in suprachiasmatic nucleus identified here were compared with previous reports in a meta-analysis. Genes held in common included fabp7, and the period gene,Per2. Also identified were genes implicated in guanosine-mediated signaling pathways that included dexamethasone-induced ras-related protein one (dexras1), regulator of G-protein signaling (rgs) 16, and ras-like family member 11b. Northern blotting confirmed diurnal changes in mRNA expression in the hypothalamus for these genes. Ras-like family member 11b was examined in more detail using in situ hybridization and antiphase diurnal changes in expression in suprachiasmatic nucleus and arcuate nucleus were identified implicating the gene in circadian-related, guanosine-mediated signaling.
The transcription transactivator protein, CBP/p300-interacting transactivators with glutamic acid/aspartic acid-rich carboxyl-terminal domain, which had not been previously identified in brain, was enriched in suprachiasmatic nucleus and discrete regions of the hypothalamus and forebrain. The potential regulatory role of CBP/p300-interacting transactivators with glutamic acid/aspartic acid-rich carboxyl-terminal domain in the transcription of genes like TGF-α implicates the protein in diurnal activity rhythms. These results demonstrate the ability of gene expression profiling to identify potential candidates important in circadian or homeostatic processes.
Keywords: microarray, suprachiasmatic nucleus, cited1, rgs16, astrocytes, circadian
In the mammalian hypothalamus, the master circadian pacemaker, the suprachiasmatic nucleus (SCN), is entrained by the light/dark cycle and establishes a 24-hour rhythm to which all other physiological rhythms are set (Pace-Schott and Hobson, 2002). Photic entrainment is thought to occur by a combination of rod/cone visual photoreception and by melanopsin-containing retinal ganglion cells that relay light stimuli to SCN via the retinohypothalamic tract (Hattar et al., 2002, 2003; Panda et al., 2003).
Clock genes form the biochemical basis for circadian rhythmicity in the SCN. The protein products from Clock and Bmal, for example, activate the transcription of target genes containing E-box cis-regulatory enhancer sequences (Gekakis et al., 1998; Hogenesch et al., 1998). In addition to the E-box enhancer, the response element, RevErbA/ROR, has been implicated in the control of transcripts that are rhythmically expressed in SCN (Ueda et al., 2002). Gene expression profiling, which led to the identification of the Rev-ErbA/ROR element, has identified numerous genes within the SCN that are rhythmically expressed (Ueda et al., 2002; Panda et al., 2002). The power of the microarray approach was exemplified by the identification from gene expression profiling in SCN of a diurnally expressed gene called dexamethasone-induced, dexameth-asone-regulated ras protein 1 (dexras1), that has since been found to be a critical modulator of photic and nonphotic entrainment (Ueda et al., 2002; Panda et al., 2002; Cheng et al., 2004).
Although genes involved in regulating circadian rhythms within and circadian output from the SCN have begun to be identified, how these genes influence the cycling of molecules in other brain regions remains unclear. Many genes that undergo rhythmic changes in expression outside the SCN influence important physiological processes (Akabayashi et al., 1994; Gore, 1998; Lu et al., 2002.). Within the sleep-wake cycle, the ventrolateral preoptic (VLPO) area, a sleep-promoting center important in REM and NREM sleep (Sherin et al., 1996; Szymusiak et al., 1998; Lu et al., 2000, 2002), undergoes an increase in the number of Fos-immunoreactive cells during sleep suggesting that there exists Fos-regulated target genes that are diurnally expressed in this region (Sherin et al., 1996; Novak and Nunez, 1998). The lateral hypothalamus (LH) contains hypocretin/orexin (H/O)-containing neurons that are important in maintaining wakefulness (Siegel et al., 2001; Sutcliffe and de Lecea, 2002; Beuckmann and Yanagisawa, 2002; Taheri et al., 2002). In addition to diurnal changes in H/O pre-propeptide mRNA and H/O neuropeptide (Taheri et al., 2002; Yoshida et al., 2001), H/O neurons also undergo diurnal changes in Fos immunoreactivity that likely influence sleep-wake cycles (Estabrooke et al., 2001; Espana et al., 2003).
Given that immediate-early genes such as c-fos and jun-b, which control the expression of downstream genes, are expressed rhythmically in various hypothalamic brain regions (Grassi-Zucconi et al., 1993; O’Hara et al., 1997; Peterfi et al., 2004), it is likely that populations of yet-unidentified genes are diurnally expressed in hypothalamus. Further, some hypothalamic brain regions including VLPO and LH retain endogenous rhythms when cultured in the absence of SCN input, suggesting that signaling pathways important in the maintenance of circadian rhythmicity exist in these areas (Abe et al., 2002). Since cell autonomous circadian rhythmicity in brain remains largely unexplored, the identification of genes important in these extra-SCN pathways would expand our understanding of the molecular mechanisms underlying endogenous circadian processes.
The goal of the current report was to identify genes expressed diurnally in the hypothalamus by comparing the gene expression profile of SCN with a sleep-promoting region, the VLPO and a wake-promoting region, the LH. Cycling genes common to these regions might predict novel pathways involved in homeostasis. This approach enabled the identification of genes like fabp7 and cysteine and histidine-rich domain-containing, zinc binding protein 1 (chordc1), which had not previously been identified as undergoing diurnally regulated patterns of expression. We also compared SCN array data with previous reports in a meta-analysis in an attempt to identify genes in SCN that are diurnally regulated and found a number of genes that implicate guanosine-mediated signaling pathways.
EXPERIMENTAL PROCEDURES
Subjects and handling
One hundred forty-four male C57BL/6 mice of 5 weeks of age were purchased from Harlan Sprague-Dawley and maintained for 5 weeks on a LD12:12 cycle at the Department of Psychiatry at the University of Wisconsin-Madison. All animal care and use procedures were in strict accordance with IACUC guidelines and approved by the University of Wisconsin-Madison animal care and use committee to ensure that the use of animals and their suffering were minimized.
For DNA microarrays, two groups of 12 animals were killed at either zeitgeber time (ZT) 6 or ZT18 (total of 48 animals). In all instances, animals were quickly removed from their cages, lightly anesthetized with halothane and their heads immediately removed by decapitation. During daylight dissections, care was taken not to disturb animals until immediately prior to kill. Brains were then dissected, flash frozen at -30 °C in 2-methylbutane, and stored at -80 °C. For collection of regional punches, brains were embedded in OCT media and sectioned on a Leica (CM3050) cryostat at -25 °C for each brain region as follows (according to Paxinos and Franklin, 2001): 1) VLPO: Two 250 μm bilateral 1 mm diameter punches from interaural 4.06 -3.56; 2) SCN: one 500 μm 1 mm diameter punch from interaural 3.56-2.56; 4) LH: two 500 μm bilateral 1 mm diameter punches from interaural 2.56 -1.56. Punches from the same brain region were pooled from each of the 12 animals within the same group, and stored at -80 °C until RNA isolation.
For Northern blot analysis, two groups of 12 animals were killed at either ZT6 or ZT18 (total of 48 animals). Brains were dissected, flash frozen at -30 °C in 2-methylbutane, and stored at -80 °C. For collection of regional punches, brains were embedded in OCT media and sectioned as described above. An additional 36 animals were collected as follows. Two sets of three animals were killed at each of six diurnal time points that included ZT4, ZT8, ZT12, ZT16, ZT20 and ZT24 and punches collected for VLPO, SCN and LH as described above.
For in situ hybridization, three animals at each of four diurnal time points, ZT6, ZT12, ZT18 and ZT24, were killed (total of 12 animals), frozen and stored at -80 °C.
Microarrays
For Affymetrix probe preparation, tissue punches from 12 animals were pooled and total RNA was isolated using Clontech NucleoSpin RNA II Kit according to the manufacturer’s protocol (BD Biosciences Clontech, Mountain View, CA, USA). Synthesis of cDNA was carried out from 2.5-5 μg of total RNA as described in the Eukaryotic Target Preparation Manual (Affymetrix, Santa Clara, CA, USA). The synthesis of biotin-labeled cRNA was done according to the BioArray HighYield RNA Transcript Labeling Kit (Enzo Biochem, Inc., Farmingdale, NY, USA). Cleanup of biotinlabeled cRNA was done using the RNeasy Mini Kit (Qiagen Inc., Valencia, CA, USA), and quantified using Ribogreen (Molecular Probes, Inc., Eugene, OR, USA). Twenty micrograms of biotin-labeled cRNA was fragmented for 30 min at 94 °C using fragmentation buffer (200 mM Tris-acetate, pH 8.1, 500 mM K acetate, 150 mM Mg acetate). Affymetrix high-density oligonucleotide arrays for Mus musculus (MG-U74Av2) were probed, hybridized, stained, and washed at the University of Wisconsin Genome Center, according to the manufacturer’s protocol (Affymetrix). Two chips were processed at each time point per region (total of four chips per region) using pooled RNA from separate sets of animals.
Data analysis for identification of regionally enriched genes
GeneChip .DAT files were analyzed using the Affymetrix MicroArray Suite and Data Mining Tool Software packages (Affymetrix, Santa Clara, CA, USA) to identify a list of genes from each brain region whose expression was elevated compared with the other two brain regions by at least five-fold. Briefly, for each brain region, signal values from two chips analyzed with RNA collected from individual sets of 12 animals at ZT6 and ZT18 were averaged. A fold comparison of each average signal value between each brain region for each time-point was then generated, and averaged. This value was used to compare the enrichment of gene expression between all brain areas. Each regional comparison was uploaded into the Affymetrix website and cross-referenced with one another generating lists of regionally enriched genes.
Data analysis for identification and comparison of diurnally expressed genes
GeneChip .DAT files were analyzed using the Affymetrix MicorArray Suite and Data Mining Tool Software packages to identify a list of candidate genes whose diurnal pattern of expression varies by way of a 2×2 analysis of fold change. Briefly, signal values were used to calculate fold change of transcripts between ZT6 and ZT18, by dividing the each of the signal values of both the ZT6 time-points by each of the two ZT18 time-points. The fold change values generated by the four sets were then averaged, and genes with an average fold change of 40% or greater were included in the candidate list. Those genes that met the criteria for an average fold change of 40% or greater, but did not have the same direction of change (i.e. increasing or decreasing continuously) throughout the 2×2 analysis, were eliminated from the data set. Genes were further filtered by Affymetrix analysis of present/marginal/absent call. Briefly, genes included in this 2×2 analysis were required to have a minimum of one present call and three marginal calls, or a minimum of two present calls and either two absent calls or one absent and one marginal call. Functional cluster analysis was achieved by integrating data results with the analysis center on the interactive Affymetrix website (www.affymetrix.com), where lists of candidate genes are uploaded onto the Affymetrix server and functional annotations are revealed for organization into a table. Comparative analysis of changing genes between each brain region was achieved by cross-referencing the uploaded data sets in the Affymetrix website with one another. Meta-analysis of transcripts from Panda et al., 2002 and Ueda et al., 2002 with our data sets was achieved by uploading their data sets of SCN into the Affymetrix website and cross-referencing their data against our candidate lists of each diurnally profiled region.
General microarray data analysis
Data sets provided by Affymetrix GeneChips® were analyzed using two programs, Affymetrix MicroArray Suite and Data Mining Tool Software and GeneSpring®7 (Silicon Genetics, Redwood City, CA, USA). We focused our validation and candidate analysis on gene lists derived from Affymetrix MicroArray Suite analysis for two reasons. First, we performed a metaanalysis with data sets from previous studies (Ueda et al., 2002; Panda et al., 2002) and to maintain consistency in software analysis, we elected to use the same initial software program (Affymetrix MicroArray Suite). Second, although an overlap was found between gene lists derived from the two software programs, a moderate number of genes (including Per2) identified using Affymetrix and validated with Northern blotting, were not identified using GeneSpring®7.
Northern blot analysis
Northern blotting was performed essentially as described previously (Schiltz et al., 2005). Briefly, brains were punched and pooled as described above. Total RNA was isolated using TRIZOL (Invitrogen, Carlsbad, CA, USA), according to the manufacturer’s specifications, and stored at -80 °C. Prior to loading, each sample was incubated with sample buffer (7.5% formaldehyde, 40% formamide, 12% 10× MOPS, 0.12% ethidium bromide) for 5 min at 56 °C, and then cooled on ice for 5 min. Northern blots consisted of 1 μg of total RNA per lane and were electrophoresed on a 1.2% agarose/1× MOPS/7.5% formaldehyde gel for 2.5 h at 60 V in 1× MOPS buffer. Each gel was washed 4×15 min in distilled H2O with gentle agitation. RNA was transferred overnight onto a sheet of GeneScreen Plus nitrocellulose (NEN Life Science Products, Boston, MA, USA) using the Stratagene PosiBlot 30-30 Pressure Blotter with 10× salt sodium citrate (SSC). The blots were then cross-linked using a 1800 UV Stratalinker (Stratagene, La Jolla, CA, USA), covered in clear plastic wrap and stored at -20 °C until hybridization.
Prior to probing, blots were pre-hybridized in 10 ml of Hybrisol (Intergen, Burlington, MA, USA) at 42 °C for 1 h. DNA templates generated by PCR (see primer list below) were labeled with 32P using the Megaprime DNA labeling system (Amersham Biosciences, UK), mixed with hybrisol, and incubated overnight at 42 °C. Blots were washed 3× with 100 ml of 2× SSC 1% SDS at RT, then 2×30 min with 100 ml of 2× SSC 1% SDS at 50 °C, and finally 1×30 min with 100 ml of 0.5× SSC 1% SDS at 60 °C. Following washes, blots were exposed to a phosphoscreen, and image analysis was performed using the Storm 860 and Image-Quant 5.2 software (Molecular Dynamics, Sunnyvale, CA, USA). The primers listed in Table 1 were made using the Primer3 software (http://www-genome.wi.mit.edu/cgi-bin/primer/primer3_www.cgi) and were used to generate DNA template under standard PCR conditions.
Table 1.
Primers used in Northern blot analysis
| Gene | Forward primer | Reverse primer | Reverse primer (in) |
|---|---|---|---|
| Cga | ACATTGTTCCCCTCAGATCG | GTAGGGAGGAGGTGGTGACA | TTCTCCACTCTGGCATTTCC |
| Chordc1* | CATGATGCCCTAAAGGGTTG | AACCTCATGATGACCCCAAA | ATCCCCTCGTGGAAAATAGG |
| Cited1* | ATGCCAACCAGGAGATGAAC | AAGCTCATTGGCTCGGTCTA | ACCAGCAGGAGGAGAGACAG |
| Fabp7* | AGACCCGAGTTCCTCCAGTT | CCTCCACACCGAAGACAAAC | — |
| Nurr1 | CATGGACCTCACCAACACTG | TTGCCTGGAACCTGGAATAG | GAAGGTCTGCCCATCCACTA |
| Per2* | CCTACAGCATGGAGCAGGTT | CAGTGATCTGAGGACCAGCA | CAACCCTTTGAGGTTCGTGT |
| Pitx2* | GCCAGCAAGGAAAGAATGAG | CACCATGCTGGACGACATAC | GTACGAATAGCCGGGGTACA |
| Rasd1 | CGCCTCTCTATCCTCACAGG | TCCAGCCAAAGTTTCCAGTT | — |
| Rasl11b* | CCGTCTCCTGTCCTGACTTT | CCCTGCATCTGGTCACTCTT | — |
| Rgs16 | CCTGGAGAGAGCCAAAGAGTT | GAACCCAGCTCCCTTTGTTA | GCAATACTCCCTTGGCTGAG |
| Smst | CCTGAGGACCTGCGACTAGA | GGGCCAGGAGTTAAGGAAGA | GAAGTTCTTGCAGCCAGCTT |
| Thra | AAGGGTTTCTTTCGGAGGAG | ACAGTCCGTTCCTTTGCATC | GTTCCTGGGAATCCGTTCTC |
T7 sequence (GGCCAGTGAATTGTAATACGACTCACTATAGGGAGGCGG) added to 5′ end of reverse primer, for amplification of template used in in situ hybridization probe generation.
A 983-bp PCR product for glyceraldehyde-3-phosphate dehydrogenase (G3PDH) was generated as described previously (Roseboom et al., 1996).
For Northern blots depicting comparisons of RNA from ZT6 and ZT18 only, samples per lane were from RNA pooled stoichiometrically from 12 animals. For Northern blots of enriched genes depicting RNA from VLPO, SCN and LH, samples were derived from RNA from both ZT6 and ZT18 and therefore each sample lane represents 24 animals. Diurnal Northern blots depicting six diurnal time points were from RNA pooled stoichiometrically from three animals per sample and region. Northern blots were repeated at least twice on RNA collected from different animals.
In situ hybridization
Cryostat sections (20 μm) from brains collected as described above were placed onto Superfrost Plus (Fisher Scientific, Hampton, NH, USA) slides, and stored at -80 °C. Prior to hybridization, slides were placed into 4% paraformaldehyde for 1.5 h at 4 °C. Slides were then washed three times in 2× SSC and then 10 min at 37 °C in 100 mM Tris-HCl, 0.5 M EDTA, pH 8 containing proteinase K (0.2 μg/ml, Promega, Madison, WI, USA). Slides were then washed in filtered H2O for 2 min and placed in 0.1 M TEA containing 0.25% acetic anhydride for 10 min. Following a 5 min rinse in 2× SSC, slides were dehydrated in an ethanol series. 35S-labeled antisense riboprobes were made from PCR templates derived from T7-tagged reverse primers (see Table 1). Slides were probed with 150 μl of 35S-labeled antisense riboprobe (10,000 c.p.m./μl) in hybridization buffer (3× SSC, 1× Denhardt’s, 50% formamide, 10% dextran sulfate, 0.05% 1 M NaPO4 (pH 7.4), 200 μg/ml tRNA, 50 mM DTT), coverslipped, and incubated at 55 °C for 16-20 h. Following hybridization, slides were washed three times 10 min in 2× SSC containing 2 mM DTT and 1h in 20 μg/ml of pancreatic RNase A in 10 mM Tris-HCl, 0.5 M NaCl (pH 8.0) at 37 °C. Slides were then washed in 1× SSC (2 mM DTT) for 5 min, 0.5× SSC (2 mM DTT) for 5 min, and 0.1× SSC (2 mM DTT) at 70 °C for 1 h. Sections were then dehydrated in a graded alcohol series, air dried, and exposed to a phosphoscreen for 1 week. Experiments were performed at least three times on separate animals. Image analysis was performed using the Storm 860 and ImageQuant 5.2 software (Molecular Dynamics). Images were color rendered in ImageQuant to enhance visualization of labeled areas.
RESULTS
Genes enriched in specific hypothalamic brain regions
Gene expression profiling was used to identify genes that were diurnally expressed within three hypothalamic brain regions involved in sleep/wake and circadian rhythmicity. These regions included: 1) the master circadian oscillator, the SCN, 2) a major sleep-promoting region, the VLPO, and 3) a major wake-promoting region, the LH. Tissue punches from these regions were used to generate RNA for DNA microarray profiling. As a first analysis, microarray data were compiled from each of the three regions and a list of genes enriched in each region (compared with the other two) was generated (see supplementary data). We used Northern blotting on RNA from tissue punches from a different set of animals to validate a number of these genes (Table 2 and supplemental data). The results were in agreement with the distribution pattern of several known mRNAs in the SCN, VLPO, and LH, confirming the specificity of the microarray approach in our hands.
Table 2.
Validated genes enriched in SCN, VLPO or LH
| Gene | Region of enrichment | Unigene # | Fold enriched over other regions: microarray | Fold enriched over other regions: Northern blot | References that confirm enrichment |
|---|---|---|---|---|---|
| Smst | SCN | Mm.2453 | 3.5 | 2.2 | Tanaka et al., 1996 |
| cited1 | SCN | Mm.42175 | 2.4 | 4.8 | First report |
| Nurr1 | LH | Mm.3507 | 2.9 | 2.1 | Xiao et al., 1996 |
| Ptx2 | LH | Mm.1385 | 44 | 3.5 | Smidt et al., 2000 |
| CGA | VLPO | Mm.1361 | 11 | 14.7 | Schorr-Toshav et al., 1983 |
A number of genes enriched in SCN, VLPO or LH based on microarray analysis were validated using Northern blotting. Fold enrichment over an average value of the other two brain regions is indicated for microarray and Northern blots. Microarray data represent comparisons from four chips per region. Northern blots represent pooled RNA samples from 24 animals (see supplemental data). CGA, α-subunit of glycoprotein hormones; Smst, somatostatin.
One particular gene that was enriched in the SCN, the transcription transactivator, CBP/p300-interacting transactivators with glutamic acid/aspartic acid-rich carboxyl-terminal domain (cited1, melanocyte-specific protein 1), had not previously been identified as expressed in brain. Cited1 modulates the transcription of target genes by interacting with DNA-binding proteins such as the estrogen receptors (ER) α and β (Yahata et al., 2001; Rodriguez et al., 2004). Although this gene was not found to change diurnally in SCN, it is a transcription regulator of transforming growth factor (TGF) -α (Yahata et al., 2001), which is expressed in SCN and is involved in the circadian regulation of locomotor activity and sleep (Kramer et al., 2001). We therefore examined the regulation of cited1 in further detail. Using Northern blotting, we found that cited1 was enriched in SCN 7.4- and 2.1-fold, compared with VLPO and LH, respectively, consistent with microarray data (Fig. 1A).
Fig. 1.

Distribution of cited1 mRNA in mouse hypothalamus and forebrain. (A) Northern blots on RNA independent of samples used for microarray analysis identified an enrichment of cited1 mRNA in SCN. The relative expression level of cited1 was normalized to glyceraldehyde phosphate dehydrogenase (gapdh) in each region to control for equal loading. Highest relative expression was observed in SCN, with an increase of 7.4- and 2.1-fold to the VLPO and LH, respectively. Each lane represents RNA pooled from 24 individual animals. Each value represents the average±S.E.M. of three technical replicates. *** P<0.0001 (t-test). (B) Cryostat sections were collected from separate animals at the same level from which tissue punches used for RNA isolation. Red circles indicate punches at the level of VLPO, SCN, or LH. In situ hybridization using 35S-labeled cited1 riboprobe was used to characterize expression patterns. cited1 expression was confined to the MPA including the SCN, dorsohypothalamic area (DM) and VMH and specific nuclei in the thalamus. Schematic diagrams were based on Paxinos and Franklin (2001) and correspond to -0.1, -0.58 and -1.7 mm from Bregma for VLPO, SCN and LH tissue punch regions, respectively. In situ hybridization images were color rendered to enable visualization of labeling (red, highest and blue, lowest levels). CPu, caudate putamen; DM, dorsomedial hypothalamic nucleus; H, hippocampus; MCPO, magnocellular preoptic nucleus; MD, mediodorsal thalamic nucleus; PH, posterior hypothalamic area; ZI, zona incerta.
In situ hybridization was used to examine the distribution of cited1 in hypothalamus and to provide spatial resolution of the expression data provided by microarray and Northern analysis. In agreement with RNA extracted from tissue punches, cited1 was enriched in the SCN (Fig. 1B). At comparable regions where microarray tissue punches from VLPO were taken, cited1 mRNA was found to be expressed in the medial preoptic area (MPA) but not the VLPO (Fig. 1A). At the level of SCN, cited1 was expressed in a localized region within the MPA that included the lateroanterior hypothalamic nucleus (LA; Fig. 1B). Less intense expression was also evident within the cerebral cortex (CC). Within the coronal section of the LH tissue punch, intense cited1 expression was present in the region of the ventromedial hypothalamic nuclei (VMH) with less intense expression in the laterodorsal (LD), mediodorsal (MD) and ventral posterior (VP) thalamic nuclei. In situ analysis, therefore, confirmed data on this gene obtained from DNA microarrays.
Diurnally regulated genes
Gene expression profiling on SCN, LH and VLPO was performed at two diurnal time points: the middle of the light period (ZT6) and the middle of dark period (ZT18). Lists of gene candidates from each hypothalamic brain region that were elevated at either time point were then compiled (see supplementary material). Inter-regional comparisons of genes elevated at ZT6 or ZT18 are shown in Fig. 2.We focused our validation on the small set of genes that were elevated in common within the three regions analyzed. Genes rhythmically expressed in common between all three hypothalamic brain regions would predict common mechanisms of diurnal regulation across regions. For example, the transcription factor, albumin site d-binding protein, which is a well-characterized circadian gene, was elevated at ZT6 compared with ZT18 in agreement with previous reports (Lopez-Molina et al., 1997). The other candidates, however, had not been previously identified as undergoing rhythmic changes in expression. We therefore selected two genes from this set for validation. These included brain-type fatty acid binding protein 7 (fabp7), which represents an mRNA elevated at ZT6, and chordc1, which represents an mRNA elevated at ZT18. In agreement with microarray analysis, Northern blotting of RNA collected at ZT6 and ZT18 revealed an elevation of fabp7 mRNA at ZT6, and chordc1 at ZT18. fabp7 was elevated 2.3-, 3.2-, and 2.5-fold at ZT6 (Fig. 3A), while chordc1 was elevated 1.4-, 1.6-, and 1.5-fold at ZT18, in VLPO, SCN, and LH, respectively (Fig. 3B).
Fig. 2.

Venn diagram of gene populations elevated at ZT6 or ZT18 in VLPO, SCN or LH. Affymetrix GeneChip analysis resulted in populations of genes elevated in specific regions at either ZT6 or ZT18. The three common genes elevated at ZT6 were fabp7, d-albumin binding protein and an expressed sequence tag. The two common genes elevated at ZT18 were chordc1 and hsp70.
Fig. 3.

fabp7 and chordc1 are differentially expressed at ZT6 and ZT18 in specific hypothalamic brain regions. Northern blotting on RNA samples independent from those used for microarray analysis revealed differences in expression levels for (A) fabp7 and (B) chordc1 mRNA at ZT6 and ZT18 in VLPO, SCN and LH. Densitometry was used to compare the expression ratio in each case at ZT6 compared with ZT18 (reported as fold change) with gapdh. The expression of fabp7 mRNA at ZT6 was significantly higher and chordc1 was significantly lower than at ZT18. Each value represents the average±S.E.M. Each lane represents RNA pooled from 12 individual animals. SCN, LH, N=3; VLPO, N=2. * P<0.05, ** P<0.01 (t-test). Light shaded bar represents fold change of fabp7 (A) and chordc1 (B). Dark shaded bar represents fold change in gapdh in (A) and (B). Size of mRNA bands was chordc1, 2200 bp; fabp7, 750 bp; gapdh, 1200 bp.
chordc1 was selected for further analysis because it has not been previously described in nervous tissue, and may be involved in modulating transcription by altering chromatin conformation (Partridge et al., 2002; Brancaccio et al., 2003). A more extensive diurnal time course revealed that chordc1 mRNA levels were elevated during the dark phase in all three hypothalamic regions. A statistical analysis was performed on SCN and a significant circadian effect was observed (one-way ANOVA, P<0.001; Fig. 4A). Further, a significant circadian effect was also evident if data from all three hypothalamic brain regions were combined (N=7, one-way ANOVA, ZT16, 20 24 versus ZT8, P<0.001, post hoc Bonferroni, graph not shown).
Fig. 4.

chordc1 mRNA is diurnally expressed in hypothalamus and forebrain. (A) Twenty-four hour profiles of the expression of chordc1 mRNA in VLPO, SCN and LH. In the upper panel, chordc1 mRNA levels are expressed relative to the average value of all samples normalized to gapdh. Each value represents the average±S.E.M. of RNA pooled from three individual animals that were independent from those used to probe DNA microarrays. SCN, N=3; VLPO, LH, N=2. SCN data were subjected to one-way ANOVA and a statistically significant circadian effect was revealed (P<0.001). Power of ANOVA with α=0.05: 0.999. ** P<0.01, *** P<0.001 vs. ZT8 (post hoc Bonferroni). The lower panel illustrates representative Northern blot analyses of chordc1 and gapdh in VLPO, SCN and LH. (B) In situ hybridization of forebrain sections taken at four time points confirmed diurnal changes in chordc1 mRNA expression. chordc1 mRNA was present throughout the forebrain including the CC, thalamus (T), hypothalamus (Hy) and the neuronal cell layers of the hippocampus (H). Note diurnal changes in expression in SCN. Peak levels of chordc1 mRNA expression occurred during the dark period. Se, septum; St. striatum.
To examine the distribution of chordc1 in more detail, sections from mouse brain collected at different diurnal time points were subjected to in situ hybridization. chordc1 was expressed throughout the brain including CC, hypothalamus, thalamus and hippocampus (Fig. 4B). In addition, diurnal changes in chordc1 expression appeared to occur in all areas analyzed with peak expression levels occurring during the dark period, in agreement with Northern blotting results. Diurnal changes in SCN are high-lighted in Fig. 4B.
fabp7 is an important developmental marker that has been implicated in astroglial differentiation (Feng et al., 1994). Its presumed role in fatty acid trafficking in astrocytes of the adult brain is interesting given the growing appreciation of lipid metabolism in homeostatic mechanisms (Cirelli et al., 2005). Further, given that important circadian effectors like TGF-α have been localized to astrocytes in the SCN (Li et al., 2002), we examined the expression profile of fabp7 in more detail. Northern blotting in SCN, VLPO and LH at six time-points throughout the day and night depicted at interesting pattern of fabp7 mRNA expression with highest levels evident at the beginning of the light phase (Fig. 5A). A reduction in relative expression levels occurred throughout the light period and was lowest following lights off. A statistical analysis was performed on SCN and a significant circadian effect was observed (one-way ANOVA, P<0.001;Fig. 5A). Further, like chordc1, a significant circadian effect was also evident if data from all three hypotha-lamic brain regions were combined (N=7, one-way ANOVA, ZT4, 8, 24 versus ZT16, P<0.001, post hoc Bonferroni, graph not shown).
Fig. 5.

fabp7 mRNA is diurnally expressed in hypothalamus and forebrain. (A) Twenty-four hour profiles of the expression of fabp7 mRNA in VLPO, SCN and LH. In the upper panel, fabp7 mRNA levels are expressed relative to the average value of all samples normalized to gapdh. Each value represents the average±S.E.M. of RNA pooled from three individual animals that were independent from those used to probe DNA microarrays. SCN, N=3; VLPO, LH, N=2. SCN data were subjected to one-way ANOVA and a statistically significant circadian effect was revealed (P=0.002). Power of ANOVA with α=0.05: 0.952. * P<0.05, ** P<0.01 vs. ZT16 (post hoc Bonferroni). The lower panel illustrates representative Northern blot analyses of fabp7 and gapdh in VLPO, SCN and LH. (B) In situ hybridization at the level of the dorsal hippocampus (H) taken at four time points confirmed diurnal changes in fabp7 mRNA expression. fabp7 mRNA was expressed primarily in cells surrounding the ventricles, although low levels of expression were evident throughout the forebrain. Peak levels of fapb7 mRNA expression occurred during the onset of the light period. T, thalamus.
Using in situ hybridization, we identified low levels of fabp7 mRNA throughout the brain and, in agreement with previous reports (Bennett et al., 1994), observed higher levels within the glial limiting membranes surrounding ventricles (Fig. 5B). Diurnal changes in fabp7 mRNA expression were similar to those observed on Northern blots (i.e. peak levels occurred during the light period) and were evident in all brain regions analyzed.
Meta-analysis
The data set reported here for SCN was compared with two similar, independent data sets previously reported (Ueda et al., 2002; Panda et al., 2002). In both studies, Affymetrix microarrays and Affymetrix MicroArray Suite and Data Mining Tool software were used to profile changes in gene expression within the SCN at 4 h intervals over a 48-hour period. Genes that oscillated rhythmically throughout the diurnal cycle were then identified using a cosine function. We compared the SCN data from these reports in a meta-analysis and found that 23 genes were shared in common between the two data sets (see supplemental material). We then performed a meta-analysis and included the two-time point diurnal comparison of SCN reported here with the previous two data sets. Of the 23 genes identified as shared in the previous reports, seven were held in common when all three data sets were compared (Table 3). These included regulator of G-protein signaling (rgs) 16, dexras1, ras-like protein family member 11b (rasl11b), the period gene, per2, fabp7, which is described in detail above, thyroid hormone receptor α (thra), which we were unable to validate on Northern blots and an est, AA407619, which was not examined further.
Table 3.
Diurnally regulated genes in the SCN as revealed by meta-analysis
| Time-point Elevated | Affymetrix ID | Gene | Description | Unigene |
|---|---|---|---|---|
| ZT6 | 93694_at | Per2 | Period homolog 2 (Drosophila) | Mm.8471 |
| ZT6 | 94378_at | Rgs16 | Regulator of G-protein signaling 16 | Mm.2555 |
| ZT6 | 95418_at | 1190017B18Rik | RIKEN cDNA 1190017B18 gene | Mm.24348 |
| ZT6 | 98967_at | Fabp7 | Fatty acid binding protein 7, brain | Mm.3644 |
| ZT6 | 99076_at | Thra | Thyroid hormone receptor alpha | Mm.4015 |
| ZT18 | 95913_at | AA407619 | Expressed sequence AA407619 | Mm.24462 |
| ZT18 | 99032_at | Rasd1 | RAS, dexamethasone-induced 1 | Mm.3903 |
| 92532_at | Avpr1a | Arginine vasopressin receptor 1A | Mm.4351 | |
| 95749_at | Armet | Arginine-rich, mutated in early stage tumors | Mm.29778 | |
| 102382_at | Arnt1 (Bmal1) | Aryl hydrocarbon receptor nuclear translocator-like | Mm.12177 | |
| 96254_at | Dnajb1 | DnaJ (Hsp40) homolog, subfamily B, member 1 | Mm.2982 | |
| 92611_at | Gpiap1 | GPI-anchored membrane protein 1 | Mm.1098 | |
| 97890_at | Sgk | Serum/glucocorticoid regulated kinase | Mm.28405 | |
| 98055_at | Blcap | Bladder cancer-associated protein homolog (human) | Mm.34330 | |
| 98038_at | Hmgb3 | High mobility group box 3 | Mm.340 | |
| 100708_at | H3f3b | H3 histone, family 3B | Mm.18516 | |
| 103029_at | Pdcd4 | Programmed cell death 4 | Mm.1605 | |
| 101889_s_at | Rora | RAR-related orphan receptor alpha | Mm.8858 | |
| 101135_at | Calcr | Calcitonin receptor | Mm.4642 | |
| 104598_at | Dusp1 | Dual specificity phosphatase 1 | Mm.2404 | |
| 96653_at | 0610007O07Rik | RIKEN cDNA 0610007O07 gene | Mm.27336 | |
| 99185_at | 2810443J12Rik | RIKEN cDNA 2810443J12 gene | Mm.41874 | |
| 93325_at | none | Mus musculus, clone MGC:46792 IMAGE:3156885, mRNA, complete cds | Mm.18579 |
Genes exhibiting a diurnal pattern of expression in the SCN in three separate studies. Meta-analysis revealed 23 probe sets that were in common between the two studies of Panda et al. (2002) and Ueda et al. (2002). Of these 23 cycling genes, seven probe sets (five probe sets elevated at ZT6, and two probe sets elevated at ZT18) were held in common with the present study and are highlighted in bold.
Fig. 6 is a representative Northern blot of RNA collected at six time points over the day and night showing the validation of four of these candidates, rgs16, dexras1, rasl11b and per2. All candidates underwent a diurnal change in mRNA abundance in SCN where highest levels were evident during the light period. dexras1 was found to undergo changes in mRNA abundance in SCN with highest levels observed at ZT16, in agreement with previous reports (Takahashi et al., 2003). per2 was also found to undergo a diurnal pattern of mRNA expression as previously described (Zheng et al., 1999).
Fig. 6.
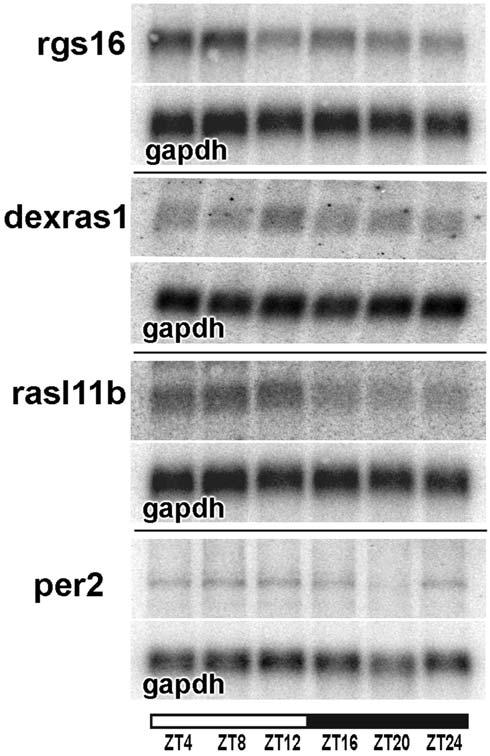
Genes expressed diurnally in SCN. Northern blots of RNA independent of microarray samples were collected from punches of SCN at six time points and probed with rgs16, dexras1, rasl11b or per2. Blots were also probed with gapdh to control for equal loading. Size of mRNA bands was dexras1, 2200 bp; rgs16, 2300 bp; rasl11b, 2300bp; per2, 5800 bp; gapdh, 1200 bp.
Rasl11b is an uncharacterized member of the small GTPase, ras-like superfamily and has not been previously described in detail in brain (Bos, 1997; Paduch et al., 2001; Ueda et al., 2002; Louro et al., 2004). We therefore analyzed coronal forebrain sections at the level of SCN and LH for the expression of rasl11b and compared its tissue distribution to the well-characterized period gene, per2 (Fig. 7). rasl11b was expressed broadly in forebrain and was evident in cortex, striatum and hippocampus. Dramatic rhythmic changes in rasl11b mRNA were present in the SCN and the arcuate nucleus. Peak expression levels in SCN were evident between ZT24 and ZT6 and were out of phase with expression in the arcuate nucleus, where highest levels were evident at about ZT12. per2 was also broadly expressed in forebrain and was present in many of the same regions as rasl11b. Unlike rasl11b, however, per2 mRNA was diurnally regulated throughout the fore-brain with peak levels evident at ZT18. Peak levels of per2 mRNA in SCN were evident at ZT12, out of phase with expression in other brain regions but similar to rasl11b diurnal expression in arcuate nucleus.
Fig. 7.
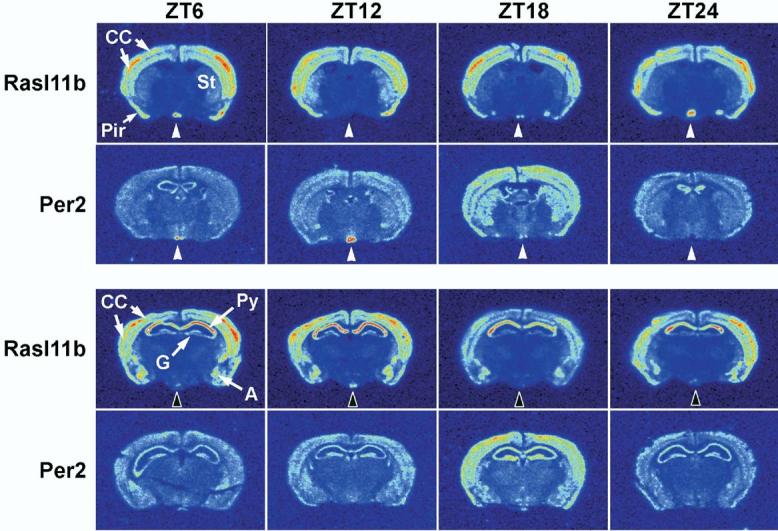
rasl11b mRNA undergoes diurnal regulation in SCN and arcuate nucleus. In situ hybridization with riboprobe to rasl11b revealed intense expression in CC, piriform cortex (Pir) and amygdala (A). In hippocampus, high levels of expression were evident in the pyramidal cell layers (Py) compared with lower levels of expression in granule cell layers (G) of dentate gyrus. White arrowheads indicate diurnal expression of rasl11b and per2 in SCN. Note that the expression of these two mRNAs was antiphase in this region and that the diurnal rhythmicity of per2 in SCN was out of phase with diurnal changes in other brain regions. Dark arrowheads indicate the diurnal regulation of rasl11b in the arcuate nucleus. St, striatum.
DISCUSSION
Gene expression profiling was used to identify genes enriched or diurnally regulated in specific regions of the hypothalamus and resulted in four major observations. First, the transcription transactivator, cited1, which had not been previously described in brain, was expressed in SCN and discrete regions of the hypothalamus and forebrain. Cited1 potentiates the ER-mediated transcription of TGF-α, which has been shown to be important in diurnal activity rhythms (Kramer et al., 2001; Yahata et al., 2001). Second, mRNA for the brain-type Fabp7 was found to change rhythmically in hypothalamus and forebrain suggesting that lipid metabolism is under circadian regulation in astrocytes. Third, the diurnal regulation of the novel zinc-binding protein, chordc1, may implicate the protein in circadian transcriptional regulation. Fourth, a member of the ras-like protein family of small GTPases, rasl11b, underwent a diurnal regulation of expression in the SCN that was antiphase to diurnal changes observed in arcuate nucleus, suggesting the presence of a novel diurnally-regulated, guanosine-mediated signaling pathway in these regions.
Diurnal gene expression profiling of VLPO, SCN, and LH revealed a number of cycling transcripts shared among the three hypothalamic brain regions. Of these, mRNA for chordc1 and fabp7, which had not previously been found to undergo rhythmic changes in expression, was examined in more detail. Fabp7 is an astrocytic protein that has been described extensively in glial cell development (Feng et al., 1994; Feng and Heintz, 1995; Rousselot et al., 1997) but whose function in adult brain is not well understood. The observation that a glial-specific mRNA encoding a fatty acid binding protein is diurnally regulated in adult brain implies that specific metabolic components of glial function are likely tied to diurnal rhythms. This is in keeping with the observation that astrocytes express clock genes and maintain independent circadian oscillation in culture (Prolo et al., 2005). Further, the cell-surface area of astrocytes decreases in the rostral preoptic area of the female rat hypothalamus between ZT4 and ZT8 (Cashion et al., 2003). While this morphological change appears to be associated with the estrous cycle, it is interesting that fabp7 mRNA underwent a diurnal variation in expression in mouse hypothalamus that reached peak levels at about ZT6, corresponding temporally to the morphometric changes observed in hypothalamic astrocytes of female rats. Whether diurnal changes in astrocyte morphology occur more generally and whether these changes involve Fabp7 remains to be determined.
This is the first report that profiles the expression of Chordc1 mRNA in brain. Although little is known about the function of Chordc1 in mammals, Chordc1-like proteins are involved in nematode development, yeast histone methylation, and disease resistance in plants (Shirasu et al., 1999; Partridge et al., 2002). In the mammalian system, chordc1 has been found to associate with the chaperone protein, hsp 90 (Wu et al., 2005) and since a number of cell chaperone proteins have been implicated in sleep deprivation and photic response (Doi et al., 2002; Cirelli et al., 2004; Naidoo et al., 2005), it is possible that Chordc1 is part of this system. Alternatively, the function of the Chordc1 homolog, chp1, in histone H3 methylation in yeast (Partridge et al., 2002) may predict a role for Chordc1 in transcription regulation, perhaps similar to circadian genes like Clock and Bmal. Interestingly, Clock is involved in the acetylation of histone H3 in the promoter regions of target genes (Etchegaray et al., 2003), and in yeast, chp1 has been shown to be sufficient for silencing transcription by methylating lysine 9 on histone H3 (Partridge et al., 2002). Since the rhythmic modification (including methylation) of histone H3 in circadian genes has been put forward as a potential method of regulating their transcription (Etchegaray et al., 2003), the putative role of Chordc1 in this process warrants further study.
The ability to analyze sets of data from similar gene expression profiling studies is a powerful method of identifying critical candidate genes. Our meta-analysis screen identified seven transcripts held in common between our data from SCN and more extensive analyses performed by two other groups (Ueda et al., 2002; Panda et al., 2002). Of this short list of candidates, two transcripts, per2 and dexras1, have been implicated in vital circadian control mechanisms in SCN (Zheng et al., 1999; Cheng et al., 2004) and illustrate the power of this kind of analysis. We validated three additional candidates, fabp7, rgs16 and rasl11b. fabp7 undergoes diurnal regulation in astrocytes and may be important for fatty acid trafficking while rgs16 and rasl11b are likely involved in guanosine-mediated cell signaling. In addition, fabp7 and rasl11b were found to undergo complex patterns of regulation in hypothalamic, as well as extrahypothalamic brain regions, and may be involved in more global homeostatic mechanisms.
A number of genes that we identified as rhythmically cycling in the SCN are molecules involved in guanosine-mediated cell signaling. One of these, dexras1, has been found to be integral for the photic and non-photic entrainment of SCN (Cheng et al., 2004). The importance of dexras1 in photic signaling implicates other diurnally regulated guanosine-associated molecules like regulator of G-protein signaling (RGS) 16 and rasl11b in similar mechanisms. rgs16 has previously been shown to undergo diurnal regulation in SCN (Ueda et al., 2002), however its function in circadian mechanisms remains unexplored. RGS16 is a member of a family of G-protein signaling peptides that stimulate the GTPase activities of G-protein α-subunits and thereby modulate the activity of G-proteincoupled receptors (Snow et al., 1998). The expression of RGS16 is induced by mitogenic signals and overexpression of the protein inhibits G-protein-coupled mitogenic signal transduction and activation of the mitogen-activated protein kinase (MAPK) signaling cascade (Buckbinder et al., 1997). It is likely that the diurnal regulation of RGS16 in SCN is involved in the modification of this pathway, however, the specific receptor system that integrates RGS16 activity in SCN is unknown.
This is the first report to show that rasl11b, a small, monomeric GTPase (Bos, 1997; Paduch et al., 2001), is diurnally regulated in multiple hypothalamic brain regions. We found that the rhythmic cycling of rasl11b in SCN was complex since in situ hybridization results in some animals indicated an elevation in rasl11b at the end of the dark period that was not evident on Northern blots. In addition, comparison of previous microarray data of rasl11b in SCN indicated differences in peak levels between studies (Ueda et al., 2002; Panda et al., 2002). Since RNA samples of SCN used to generate Northern blots consisted of pooled samples from multiple animals, it is likely that rasl11b is generally higher during the light period. However, differences between animals that are housed similarly may suggest that the diurnal rhythmicity of rasl11b in SCN may be influenced by factors other than photic stimuli. Further, the diurnal changes in rasl11b mRNA in the arcuate nucleus implicate the GTPase in feeding mechanisms. Given the specificity and diurnal expression of rasl11b between these two regions, it would be interesting to determine whether rasl11b changes in response to shifts in scheduled feeding times or alterations in the expression of clock controlling genes. Restricted feeding has been implicated in the control of circadian rhythms (Saper et al., 2005), and recently it has also been shown that hypothalamic mRNAs encoding peptides involved in energy balance are altered in Clock mutant mice (Turek et al., 2005). The results reported here underscore the importance of guanosinemediated cell signaling, and their presence in these specific regions within hypothalamus suggests they may have a putative role in the signaling pathways involved in the integration of feeding and circadian rhythmicity.
The microarray analysis employed here also enabled the identification of genes that were enriched in one hypothalamic brain region compared with the other two. These lists of enriched genes provided candidates from which we obtained initial validation of the microarray approach and were therefore not examined in more detail. We did identify a number of hormones, including the α-subunit of glycoprotein hormones, that were enriched in VLPO based on microarray analysis and then confirmed on Northern blots using a separate pool of RNA. We obtained inconsistent results when examining the distribution of these hormone mRNAs using in situ hybridization, and although we are uncertain whether our observations represent sample contamination or individual animal variation, they highlight the importance of obtaining spatial validation of the mRNA expression of gene candidates. mRNA for the gene cited1 was identified on microarrays as enriched in SCN and in situ hybridization confirmed this observation. Cited1 (also called melanocyte-specific gene 1) is a transcriptional co-activator that potentiates transcription by interacting with DNA-binding proteins like the ER α and β (Yahata et al., 2001). Cited1 has been implicated in placental development and embryogenesis (Dunwoodie et al., 1998; Rodriguez et al., 2004) but has not been previously identified in brain. Its presence in SCN is intriguing since ER-α and β have also been described in SCN, although their mechanism of action remains unclear. Further, Cited1 has been shown to enhance transcription of TGF-α in cell culture through an interaction with ERs (Yahata et al., 2001). Hence, a potential target of Cit-ed1-ER transcriptional activation in SCN is TGF-α, which is important in the diurnal regulation of locomotor activity (Kramer et al., 2001). An involvement of Cited1 in behavioral state regulation is also inferred by a partial overlap of cited1 mRNA expression with the recently reported distribution of neuronal cell populations that project to H/O neurons (Sakurai et al., 2005).
We used a two-time point gene expression profiling analysis to identify novel genes that undergo diurnal variation in the hypothalamus. Two of these genes, chordc1 and fabp7, were found to undergo diurnal changes in expression in numerous neuronal and astroglial populations. chordc1, which had not previously been described in brain, contains structural features, including zinc-binding sites, which are consistent with a role for the protein in transcriptional regulation. Fabp7 is likely important in the regulation of glial metabolism. Comparison of our data with previous reports further identified three diurnally changing genes in SCN, dexras1, rgs16 and rasl11b that are involved in guanosine-mediated signaling processes. These results demonstrate the ability of gene expression profiling to identify potential candidates important in circadian or homeostatic processes.
Supplementary Material
APPENDIX
Supplementary data associated with this article can be found, in the online version, at doi: 10.1016/j.neuroscience.2006.01.020.
Footnotes
- CC
- cerebral cortex
- chordc1
- cysteine and histidinerich domain-containing, zinc binding protein 1
- cited1
- CBP/p300-in-teracting transactivators with glutamic acid/aspartic acid-rich carboxyl-terminal domain
- dexras1
- dexamethasone-induced ras-regulated protein 1
- ER
- estrogen receptor
- fabp7
- fatty acid binding protein 7
- H/O
- hypocretin/orexin
- LA
- lateroanterior hypothalamic nucleus
- LD
- laterodorsal thalamic nucleus
- LH
- lateral hypothalamus
- MPA
- medial preoptic area
- rasl11b
- ras-like family member 11b
- RGS
- regulator of G-protein signaling
- rgs16
- regulator of g-protein signaling 16
- SCN
- suprachiasmatic nucleus
- SSC
- salt sodium citrate
- TGF
- transforming growth factor
- VLPO
- ventrolateral preoptic area
- VMH
- ventromedial hypothalamic nucleus
- VP
- ventral posterior thalamic nucleus
- ZT
- zeitgeber time
REFERENCES
- Abe M, Herzog ED, Yamazaki S, Straume M, Tei H, Sakaki Y, Menaker M, Block GD. Circadian rhythms in isolated brain regions. J Neurosci. 2002;22:350–356. doi: 10.1523/JNEUROSCI.22-01-00350.2002. [DOI] [PMC free article] [PubMed] [Google Scholar]
- Akabayashi A, Levin N, Paez X, Alexander JT, Leibowitz SF. Hypothalamic neuropeptide Y and its gene expression: relation to light/dark cycle and circulating corticosterone. Mol Cell Neurosci. 1994;5:210–218. doi: 10.1006/mcne.1994.1025. [DOI] [PubMed] [Google Scholar]
- Beuckmann CT, Yanagisawa M. Orexins: from neuropeptides to energy homeostasis and sleep/wake regulation. J Mol Med. 2002;80:329–342. doi: 10.1007/s00109-002-0322-x. [DOI] [PubMed] [Google Scholar]
- Bos JL. Ras-like GTPases. Biochim Biophys Acta. 1997;1333:M19–M31. doi: 10.1016/s0304-419x(97)00015-2. [DOI] [PubMed] [Google Scholar]
- Brancaccio M, Menini N, Bongioanni D, Ferretti R, De Acetis M, Silengo L, Tarone G. Chp-1 and melusin, two CHORD containing proteins in vertebrates. FEBS Lett. 2003;551:47–52. doi: 10.1016/s0014-5793(03)00892-5. [DOI] [PubMed] [Google Scholar]
- Buckbinder L, Velasco-Miguel S, Chen Y, Xu N, Talbott R, Gelbert L, Gao J, Seizinger BR, Gutkind JS, Kley N. The p53 tumor suppressor targets a novel regulator of G protein signaling. Proc Natl Acad Sci USA. 1997;94:7868–7872. doi: 10.1073/pnas.94.15.7868. [DOI] [PMC free article] [PubMed] [Google Scholar]
- Cashion AB, Smith MJ, Wise PM. The morphometry of astrocytes in the rostral preoptic area exhibits a diurnal rhythm on proestrus: relationship to the luteinizing hormone surge and effects of age. Endocrinology. 2003;144:274–280. doi: 10.1210/en.2002-220711. [DOI] [PubMed] [Google Scholar]
- Cheng HY, Obrietan K, Cain SW, Lee BY, Agostino PV, Joza NA, Harrington ME, Ralph MR, Penninger JM. Dexras1 potentiates photic and suppresses nonphotic responses of the circadian clock. Neuron. 2004;43:715–728. doi: 10.1016/j.neuron.2004.08.021. [DOI] [PubMed] [Google Scholar]
- Cirelli C, Gutierrez CM, Tononi G. Extensive and divergent effects of sleep and wakefulness on brain gene expression. Neuron. 2004;41:35–43. doi: 10.1016/s0896-6273(03)00814-6. [DOI] [PubMed] [Google Scholar]
- Cirelli C, Lavaute TM, Tononi G. Sleep and wakefulness modulate gene expression in Drosophila. J Neurochem. 2005;94:1411–1419. doi: 10.1111/j.1471-4159.2005.03291.x. [DOI] [PubMed] [Google Scholar]
- Doi M, Nakajima Y, Okano T, Fukada Y. Light-dependent changes in the chick pineal temperature and the expression of cHsp90 alpha gene: a potential contribution of in vivo temperature change to the photic-entrainment of the chick pineal circadian clock. Zoolog Sci. 2002;19:633–641. doi: 10.2108/zsj.19.633. [DOI] [PubMed] [Google Scholar]
- Dunwoodie SL, Rodriguez TA, Beddington RS. Msg1 and Mrg1, founding members of a gene family, show distinct patterns of gene expression during mouse embryogenesis. Mech Dev. 1998;72:27–40. doi: 10.1016/s0925-4773(98)00011-2. [DOI] [PubMed] [Google Scholar]
- Espana RA, Valentino RJ, Berridge CW. Fos immunoreactivity in hypocretin-synthesizing and hypocretin-1 receptor-expressing neurons: effects of diurnal and nocturnal spontaneous waking, stress and hypocretin-1 administration. Neuroscience. 2003;121:201–217. doi: 10.1016/s0306-4522(03)00334-8. [DOI] [PubMed] [Google Scholar]
- Estabrooke IV, McCarthy MT, Ko E, Chou TC, Chemelli RM, Yanagisawa M, Saper CB, Scammell TE. Fos expression in orexin neurons varies with behavioral state. J Neurosci. 2001;21:1656–1662. doi: 10.1523/JNEUROSCI.21-05-01656.2001. [DOI] [PMC free article] [PubMed] [Google Scholar]
- Etchegaray JP, Lee C, Wade PA, Reppert SM. Rhythmic histone acetylation underlies transcription in the mammalian circadian clock. Nature. 2003;421:177–182. doi: 10.1038/nature01314. [DOI] [PubMed] [Google Scholar]
- Feng L, Hatten ME, Heintz N. Brain lipid-binding protein (BLBP): a novel signaling system in the developing mammalian CNS. Neuron. 1994;12:895–908. doi: 10.1016/0896-6273(94)90341-7. [DOI] [PubMed] [Google Scholar]
- Feng L, Heintz N. Differentiating neurons activate transcription of the brain lipid-binding protein gene in radial glia through a novel regulatory element. Development. 1995;121:1719–1730. doi: 10.1242/dev.121.6.1719. [DOI] [PubMed] [Google Scholar]
- Gekakis N, Staknis D, Nguyen HB, Davis FC, Wilsbacher LD, King DP, Takahashi JS, Weitz CJ. Role of the CLOCK protein in the mammalian circadian mechanism. Science. 1998;280:1564–1569. doi: 10.1126/science.280.5369.1564. [DOI] [PubMed] [Google Scholar]
- Gore AC. Diurnal rhythmicity of gonadotropin-releasing hormone gene expression in the rat. Neuroendocrinology. 1998;68:257–263. doi: 10.1159/000054373. [DOI] [PubMed] [Google Scholar]
- Grassi-Zucconi G, Menegazzi M, De Prati AC, Bassetti A, Montagnese P, Mandile P, Cosi C, Bentivoglio M. c-fos mRNA is spontaneously induced in the rat brain during the activity period of the circadian cycle. Eur J Neurosci. 1993;5:1071–1078. doi: 10.1111/j.1460-9568.1993.tb00960.x. [DOI] [PubMed] [Google Scholar]
- Hattar S, Liao HW, Takao M, Berson DM, Yau KW. Melanopsin-containing retinal ganglion cells: architecture, projections, and intrinsic photosensitivity. Science. 2002;295:1065–1070. doi: 10.1126/science.1069609. [DOI] [PMC free article] [PubMed] [Google Scholar]
- Hattar S, Lucas RJ, Mrosovsky N, Thompson S, Douglas RH, Hankins MW, Lem J, Biel M, Hofmann F, Foster RG, Yau KW. Melanopsin and rod-cone photoreceptive systems account for all major accessory visual functions in mice. Nature. 2003;424:76–81. doi: 10.1038/nature01761. [DOI] [PMC free article] [PubMed] [Google Scholar]
- Hogenesch JB, Gu YZ, Jain S, Bradfield CA. The basic-helix-loop-helix-PAS orphan MOP3 forms transcriptionally active complexes with circadian and hypoxia factors. Proc Natl Acad Sci U S A. 1998;95:5474–5479. doi: 10.1073/pnas.95.10.5474. [DOI] [PMC free article] [PubMed] [Google Scholar]
- Kramer A, Yang FC, Snodgrass P, Li X, Scammell TE, Davis FC, Weitz CJ. Regulation of daily locomotor activity and sleep by hypothalamic EGF receptor signaling. Science. 2001;294:2511–2515. doi: 10.1126/science.1067716. [DOI] [PubMed] [Google Scholar]
- Li X, Sankrithi N, Davis FC. Transforming growth factor-alpha is expressed in astrocytes of the suprachiasmatic nucleus in hamster: role of glial cells in circadian clocks. Neuroreport. 2002;13:2143–2147. doi: 10.1097/00001756-200211150-00031. [DOI] [PubMed] [Google Scholar]
- Lopez-Molina L, Conquet F, Dubois-Dauphin M, Schibler U. The DBP gene is expressed according to a circadian rhythm in the supra-chiasmatic nucleus and influences circadian behavior. EMBO J. 1997;16:6762–6771. doi: 10.1093/emboj/16.22.6762. [DOI] [PMC free article] [PubMed] [Google Scholar]
- Louro R, Nakaya HI, Paquola AC, Martins EA, da Silva AM, Verjovski-Almeida S, Reis EM. RASL11A, member of a novel small monomeric GTPase gene family, is down-regulated in prostate tumors. Biochem Biophys Res Commun. 2004;316:618–627. doi: 10.1016/j.bbrc.2004.02.091. [DOI] [PubMed] [Google Scholar]
- Lu J, Bjorkum AA, Xu M, Gaus SE, Shiromani PJ, Saper CB. Selective activation of the extended ventrolateral preoptic nucleus during rapid eye movement sleep. J Neurosci. 2002;22:4568–4576. doi: 10.1523/JNEUROSCI.22-11-04568.2002. [DOI] [PMC free article] [PubMed] [Google Scholar]
- Lu J, Greco MA, Shiromani P, Saper CB. Effect of lesions of the ventrolateral preoptic nucleus on NREM and REM sleep. J Neurosci. 2000;20:3830–3842. doi: 10.1523/JNEUROSCI.20-10-03830.2000. [DOI] [PMC free article] [PubMed] [Google Scholar]
- Naidoo N, Giang W, Galante RJ, Pack AI. Sleep deprivation induces the unfolded protein response in mouse cerebral cortex. J Neurochem. 2005;92:1150–1157. doi: 10.1111/j.1471-4159.2004.02952.x. [DOI] [PubMed] [Google Scholar]
- Novak CM, Nunez AA. Daily rhythms in Fos activity in the rat ventrolateral preoptic area and midline thalamic nuclei. Am J Physiol. 1998;275:R1620–R1626. doi: 10.1152/ajpregu.1998.275.5.R1620. [DOI] [PubMed] [Google Scholar]
- O’Hara BF, Watson FL, Andretic R, Wiler SW, Young KA, Bitting L, Heller HC, Kilduff TS. Daily variation of CNS gene expression in nocturnal vs. diurnal rodents and in the developing rat brain. Brain Res Mol Brain Res. 1997;48:73–86. doi: 10.1016/s0169-328x(97)00084-3. [DOI] [PubMed] [Google Scholar]
- Pace-Schott EF, Hobson JA. The neurobiology of sleep: genetics, cellular physiology and subcortical networks. Nat Rev Neurosci. 2002;3:591–605. doi: 10.1038/nrn895. [DOI] [PubMed] [Google Scholar]
- Paduch M, Jelen F, Otlewski J. Structure of small G proteins and their regulators. Acta Biochim Pol. 2001;48:829–850. [PubMed] [Google Scholar]
- Panda S, Antoch MP, Miller BH, Su AI, Schook AB, Straume M, Schultz PG, Kay SA, Takahashi JS, Hogenesch JB. Coordinated transcription of key pathways in the mouse by the circadian clock. Cell. 2002;109:307–320. doi: 10.1016/s0092-8674(02)00722-5. [DOI] [PubMed] [Google Scholar]
- Panda S, Provencio I, Tu DC, Pires SS, Rollag MD, Castrucci AM, Pletcher MT, Sato TK, Wiltshire T, Andahazy M, Kay SA, Van Gelder RN, Hogenesch JB. Melanopsin is required for non-image-forming photic responses in blind mice. Science. 2003;301:525–527. doi: 10.1126/science.1086179. [DOI] [PubMed] [Google Scholar]
- Partridge JF, Scott KS, Bannister AJ, Kouzarides T, Allshire RC. cis-Acting DNA from fission yeast centromeres mediates histone H3 methylation and recruitment of silencing factors and cohesin to an ectopic site. Curr Biol. 2002;12:1652–1660. doi: 10.1016/s0960-9822(02)01177-6. [DOI] [PubMed] [Google Scholar]
- Paxinos G, Franklin KBJ. The mouse brain in stereotaxic coordinates. Academic Press; London: 2001. [Google Scholar]
- Peterfi Z, Churchill L, Hajdu I, Obal F, Jr, Krueger JM, Parducz A. Fos-immunoreactivity in the hypothalamus: dependency on the diurnal rhythm, sleep, gender, and estrogen. Neuroscience. 2004;124:695–707. doi: 10.1016/j.neuroscience.2003.10.047. [DOI] [PubMed] [Google Scholar]
- Prolo LM, Takahashi JS, Herzog ED. Circadian rhythm generation and entrainment in astrocytes. J Neurosci. 2005;25:404–408. doi: 10.1523/JNEUROSCI.4133-04.2005. [DOI] [PMC free article] [PubMed] [Google Scholar]
- Rodriguez TA, Sparrow DB, Scott AN, Withington SL, Preis JI, Michalicek J, Clements M, Tsang TE, Shioda T, Beddington RS, Dunwoodie SL. Cited1 is required in trophoblasts for placental development and for embryo growth and survival. Mol Cell Biol. 2004;24:228–244. doi: 10.1128/MCB.24.1.228-244.2004. [DOI] [PMC free article] [PubMed] [Google Scholar]
- Rousselot P, Heintz N, Nottebohm F. Expression of brain lipid binding protein in the brain of the adult canary and its implications for adult neurogenesis. J Comp Neurol. 1997;385:415–426. [PubMed] [Google Scholar]
- Sakurai T, Nagata R, Yamanaka A, Kawamura H, Tsujino N, Muraki Y, Kageyama H, Kunita S, Takahashi S, Goto K, Koyama Y, Shioda S, Yanagisawa M. Input of orexin/hypocretin neurons revealed by a genetically encoded tracer in mice. Neuron. 2005;46:297–308. doi: 10.1016/j.neuron.2005.03.010. [DOI] [PubMed] [Google Scholar]
- Saper CB, Lu J, Chou TC, Gooley J. The hypothalamic integrator for circadian rhythms. Trends Neurosci. 2005;28:152–157. doi: 10.1016/j.tins.2004.12.009. [DOI] [PubMed] [Google Scholar]
- Schiltz CA, Kelley AE, Landry CF. Contextual cues associated with nicotine administration increase arc mRNA expression in corticolimbic areas of the rat brain. Eur J Neurosci. 2005;21:1703–1711. doi: 10.1111/j.1460-9568.2005.04001.x. [DOI] [PMC free article] [PubMed] [Google Scholar]
- Schorr-Toshav NL, Halmi NS, Wurzel JM, Kourides IA. Immunocytochemical localization of the glycoprotein hormone alpha subunit in the median eminence of the mouse hypothalamus. Horm Metab Res. 1983;15:485–487. doi: 10.1055/s-2007-1018765. [DOI] [PubMed] [Google Scholar]
- Sherin JE, Shiromani PJ, McCarley RW, Saper CB. Activation of ventrolateral preoptic neurons during sleep. Science. 1996;271:216–219. doi: 10.1126/science.271.5246.216. [DOI] [PubMed] [Google Scholar]
- Shirasu K, Lahaye T, Tan MW, Zhou F, Azevedo C, Schulze-Lefert P. A novel class of eukaryotic zinc-binding proteins is required for disease resistance signaling in barley and development in C. elegans. Cell. 1999;99:355–366. doi: 10.1016/s0092-8674(00)81522-6. [DOI] [PubMed] [Google Scholar]
- Siegel JM, Moore R, Thannickal T, Nienhuis R. A brief history of hypocretin/orexin and narcolepsy. Neuropsychopharmacology. 2001;25:S14–S20. doi: 10.1016/S0893-133X(01)00317-7. [DOI] [PMC free article] [PubMed] [Google Scholar]
- Smidt MP, Cox JJ, van Schaick HS, Coolen M, Schepers J, van der Kleij AM, Burbach JP. Analysis of three Ptx2 splice variants on transcriptional activity and differential expression pattern in the brain. J Neurochem. 2000;75:1818–1825. doi: 10.1046/j.1471-4159.2000.0751818.x. [DOI] [PubMed] [Google Scholar]
- Snow BE, Antonio L, Suggs S, Siderovski DP. Cloning of a retinally abundant regulator of G-protein signaling (RGS-r/RGS16): genomic structure and chromosomal localization of the human gene. Gene. 1998;206:247–253. doi: 10.1016/s0378-1119(97)00593-3. [DOI] [PubMed] [Google Scholar]
- Sutcliffe JG, de Lecea L. The hypocretins: setting the arousal threshold. Nat Rev Neurosci. 2002;3:339–349. doi: 10.1038/nrn808. [DOI] [PubMed] [Google Scholar]
- Szymusiak R, Alam N, Steininger TL, McGinty D. Sleep-waking discharge patterns of ventrolateral preoptic/anterior hypothalamic neurons in rats. Brain Res. 1998;803:178–188. doi: 10.1016/s0006-8993(98)00631-3. [DOI] [PubMed] [Google Scholar]
- Taheri S, Zeitzer JM, Mignot E. The role of hypocretins (orexins) in sleep regulation and narcolepsy. Annu Rev Neurosci. 2002;25:283–313. doi: 10.1146/annurev.neuro.25.112701.142826. [DOI] [PubMed] [Google Scholar]
- Takahashi H, Umeda N, Tsutsumi Y, Fukumura R, Ohkaze H, Sujino M, van der Horst G, Yasui A, Inouye ST, Fujimori A, Ohhata T, Araki R, Abe M. Mouse dexamethasone-induced RAS protein 1 gene is expressed in a circadian rhythmic manner in the suprachiasmatic nucleus. Brain Res Mol Brain Res. 2003;110:1–6. doi: 10.1016/s0169-328x(02)00543-0. [DOI] [PubMed] [Google Scholar]
- Tanaka M, Okamura H, Matsuda T, Shigeyoshi Y, Hisa Y, Chihara K, Ibata Y. Somatostatin neurons form a distinct peptidergic neuronal group in the rat suprachiasmatic nucleus: a double labeling in situ hybridization study. Neurosci Lett. 1996;215:119–122. [PubMed] [Google Scholar]
- Turek FW, Joshu C, Kohsaka A, Lin E, Ivanova G, McDearmon E, Laposky A, Losee-Olson S, Easton A, Jensen DR, Eckel RH, Takahashi JS, Bass J. Obesity and metabolic syndrome in circadian Clock mutant mice. Science. 2005;308:1043–1045. doi: 10.1126/science.1108750. [DOI] [PMC free article] [PubMed] [Google Scholar]
- Ueda HR, Chen W, Adachi A, Wakamatsu H, Hayashi S, Takasugi T, Nagano M, Nakahama K, Suzuki Y, Sugano S, Iino M, Shigeyoshi Y, Hashimoto S. A transcription factor response element for gene expression during circadian night. Nature. 2002;418:534–539. doi: 10.1038/nature00906. [DOI] [PubMed] [Google Scholar]
- Wu J, Luo S, Jiang H, Li H. Mammalian CHORD-containing protein 1 is a novel heat shock protein 90-interacting protein. FEBS Lett. 2005;579:421–426. doi: 10.1016/j.febslet.2004.12.005. [DOI] [PubMed] [Google Scholar]
- Xiao Q, Castillo SO, Nikodem VM. Distribution of messenger RNAs for the orphan nuclear receptors Nurr1 and Nur77 (NGFI-B) in adult rat brain using in situ hybridization. Neuroscience. 1996;75:221–230. doi: 10.1016/0306-4522(96)00159-5. [DOI] [PubMed] [Google Scholar]
- Yahata T, Shao W, Endoh H, Hur J, Coser KR, Sun H, Ueda Y, Kato S, Isselbacher KJ, Brown M, Shioda T. Selective coactivation of estrogen-dependent transcription by CITED1 CBP/p300-binding protein. Genes Dev. 2001;15:2598–2612. doi: 10.1101/gad.906301. [DOI] [PMC free article] [PubMed] [Google Scholar]
- Yoshida Y, Fujiki N, Nakajima T, Ripley B, Matsumura H, Yoneda H, Mignot E, Nishino S. Fluctuation of extracellular hypocretin-1 (orexin A) levels in the rat in relation to the light-dark cycle and sleep-wake activities. Eur J Neurosci. 2001;14:1075–1081. doi: 10.1046/j.0953-816x.2001.01725.x. [DOI] [PubMed] [Google Scholar]
- Zheng B, Larkin DW, Albrecht U, Sun ZS, Sage M, Eichele G, Lee CC, Bradley A. The mPer2 gene encodes a functional component of the mammalian circadian clock. Nature. 1999;400:169–173. doi: 10.1038/22118. [DOI] [PubMed] [Google Scholar]
Associated Data
This section collects any data citations, data availability statements, or supplementary materials included in this article.