Abstract
Throughout the last decade many laboratories have shown that mRNA levels in formalin-fixed and paraffin-embedded (FPE) tissue specimens can be quantified by reverse transcriptase-polymerase chain reaction (RT-PCR) techniques despite the extensive RNA fragmentation that occurs in tissues so preserved. We have developed RT-PCR methods that are sensitive, precise, and that have multianalyte capability for potential wide use in clinical research and diagnostic assays. Here it is shown that the extent of fragmentation of extracted FPE tissue RNA significantly increases with archive storage time. Probe and primer sets for RT-PCR assays based on amplicons that are both short and homogeneous in length enable effective reference gene-based data normalization for cross comparison of specimens that differ substantially in age. A 48-gene assay used to compare gene expression profiles from the same breast cancer tissue that had been either frozen or FPE showed very similar profiles after reference gene-based normalization. A 92-gene assay, using RNA extracted from three 10-μm FPE sections of archival breast cancer specimens (dating from 1985 to 2001) yielded analyzable data for these genes in all 62 tested specimens. The results were substantially concordant when estrogen receptor, progesterone receptor, and HER2 receptor status determined by RT-PCR was compared with immunohistochemistry assays for these receptors. Furthermore, the results highlight the advantages of RT-PCR over immunohistochemistry with respect to quantitation and dynamic range. These findings support the development of RT-PCR analysis of FPE tissue RNA as a platform for multianalyte clinical diagnostic tests.
Throughout the last decade more than a dozen different laboratories have demonstrated that it is possible to measure mRNA levels (ie, profile gene expression) using fixed, paraffin-embedded tissue as a source of RNA, despite the fact that RNA extracted from formalin-fixed and paraffin-embedded (FPE) tissue is often present in fragments less than ∼300 bases in length.1–8 This methodology has great potential to facilitate discovery and development of new diagnostic assays and therapeutic agents for two reasons.9 First, the prognostic/predictive potential of gene expression profiles (ie, to define new subcategories of known diseases with different prognoses and possible dissimilar responses to drugs) is now evident from the work of a number of groups.10–13 Second, FPE tissue represents by far the most abundant supply of solid tissue specimens associated with clinical records. The standard process for handling biopsy specimens has been, and still is, to fix tissues in formalin and then embed them in paraffin (FPE). Reverse transcriptase-polymerase chain reaction (RT-PCR) assay of FPE RNA can enable fast, large, and relatively inexpensive clinical trials to validate its potential in routine clinical diagnostic assays.
We therefore have sought to develop RT-PCR assays that measure FPE RNA and are optimized with respect to sensitivity, accuracy, reproducibility, and precision. The capability of gene expression analysis to provide diagnostic information of greatest utility hinges on measuring the contributions of multiple genes, often dozens or more.11–17 Consequently, we have also sought to develop RT-PCR assays of FPE RNA that measure the expression of many genes at once from small amounts of archival tumor blocks. The present study describes results with 48- and 92-gene assays.
Materials and Methods
Tissue Specimens
Archival breast tumor FPE blocks and matching frozen tumor sections were provided by Providence–St. Joseph Medical Center, Burbank CA. Fixed tissues were incubated for 5 to 10 hours in 10% neutral-buffered formalin before being alcohol-dehydrated and embedded in paraffin.
RNA Extraction Procedure
RNA was extracted from three 10-μm FPE sections per each patient case. Paraffin was removed by xylene extraction followed by ethanol wash. RNA was isolated from sectioned tissue blocks using the MasterPure Purification kit (Epicenter, Madison, WI); a DNase I treatment step was included. RNA was extracted from frozen samples using Trizol reagent according to the supplier’s instructions (Invitrogen Life Technologies, Carlsbad, CA). Residual genomic DNA contamination was assayed by a TaqMan (Applied Biosystems, Foster City, CA) quantitative PCR assay (no RT control) for β-actin DNA. Samples with measurable residual genomic DNA were resubjected to DNase I treatment, and assayed again for DNA contamination.
FPE Tissue RNA Analysis
RNA was quantitated using the RiboGreen fluorescence method (Molecular Probes, Eugene, OR), and RNA size was analyzed by microcapillary electrophoresis using an Agilent 2100 Bioanalyzer (Agilent Technologies, Palo Alto, CA).
TaqMan Primer and Probe Design
For each gene, we identified the appropriate mRNA reference sequence (REFSEQ) accession number and accessed the consensus sequence through the NCBI Entrez nucleotide database. RT-PCR primers and probes were designed using Primer Express (Applied Biosystems, Foster City, CA) and Primer3 programs.18 Oligonucleotides were supplied by Biosearch Technologies Inc. (Novato, CA) and Integrated DNA Technologies (Coralville, IA). Amplicon sizes were preferably limited to less than 100 bases in length (see Results). Fluorogenic probes were dual-labeled with 5′-FAM as a reporter and 3′-BHQ-1 as a quencher.
Reverse Transcription
Reverse transcription (RT) was performed using a SuperScript First-Strand Synthesis kit for RT-PCR (Invitrogen Corp., Carlsbad, CA). Total FPE RNA and pooled gene-specific primers were present at 10 to 50 ng/μl and 100 nmol/L (each), respectively.
TaqMan Gene Expression Profiling
TaqMan reactions were performed in 384-well plates according to instructions of the manufacturer, using Applied Biosystems Prism 7900HT TaqMan instruments. Expression of each gene was measured either in duplicate 5-μl reactions using cDNA synthesized from 1 ng of total RNA per reaction well, or in single reactions using cDNA synthesized from 2 ng of total RNA, as indicated. Final primer and probe concentrations were 0.9 μmol/L (each primer) and 0.2 μmol/L, respectively. PCR cycling was performed as follows: 95°C for 10 minutes for one cycle, 95°C for 20 seconds, and 60°C for 45 seconds for 40 cycles. To verify that the RT-PCR signals derived from RNA rather than genomic DNA, for each gene tested a control identical to the test assay but omitting the RT reaction (no RT control) was included. The threshold cycle for a given amplification curve during RT-PCR occurs at the point the fluorescent signal from probe cleavage grows beyond a specified fluorescence threshold setting. Test samples with greater initial template exceed the threshold value at earlier amplification cycle numbers than those with lower initial template quantities.
Normalization and Data Analysis
To compare expression profiles between specimens, normalization based on six reference genes was used to correct for differences arising from variability in RNA quality and total quantity of RNA in each assay. A reference CT (threshold cycle) for each tested specimen was defined as the average measured CT of the six reference genes. In an approach similar to what has been described by others, six reference genes were selected for use from among 10 candidate reference genes tested in this assay.19 Reference gene candidates were selected from among those well-known in the literature as commonly constitutively expressed genes across a wide range of tissues and biological conditions. The six genes selected for the final analysis showed the lowest levels of expression variability among the patient specimens tested. An average of six reference genes was used to minimize the risk of normalization bias that can result from variation in expression of any single reference gene.20 Relative mRNA level of a test gene within a tissue specimen was defined as 2ΔCT+10.0, where Δ CT = CT (test gene) − CT (mean of six reference genes). In the figures, unless indicated otherwise, normalized expression is represented on a scale in which the average expression of the six reference genes is 10, corresponding to a mean CT of 30.7.
Statistical Analysis
Correlation of gene expression analyses was done using Pearson linear correlation. Cluster analysis was done using 1-Pearson R as the distance metric and single linkage hierarchical clustering.
Results
FPE Tissue RNA Fragmentation Increases with Archive Storage Time
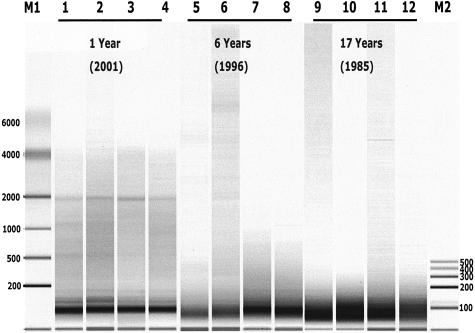
Capillary electrophoresis analysis of RNA extracted from archival FPE breast cancer specimens shows that the RNA exists primarily as fragments of less than 300 bases in length. This is consistent with findings of others.6,21 Figure 1 presents RNA-sizing results from specimens archived for substantially different durations. As shown, breast cancer tissue RNA archived for ∼1 year had larger average molecular weight than RNA archived for ∼6 or 17 years (note detectable 18S RNA at ∼2000 bases in the 1-year-old specimens). All of these specimens came from one source (Providence Hospital, Burbank, CA) and throughout this 17-year period all specimens were fixed using the same formalin fixation protocol (see Materials and Methods for details). This therefore suggests that fragmentation of FPE tissue continues to occur after specimens are dehydrated and embedded in wax.
Figure 1.
Size distribution of FPE tissue RNA from 12 tumor specimens. Total RNA was extracted from breast cancer specimens as described in Materials and Methods. One μl from each RNA extract (1/30 of the sample) was analyzed using an Agilent 2100 Bioanalyzer, RNA 6000 Nanochip. Lanes 1–4, 5–8, and 9–12 contain RNA from samples archived 1, 6, and 17 years, respectively. Lanes M1 and M2 contain two different sets of molecular weight marker RNA (sizes denoted in bases).
Results from a 92-Gene Assay: Impact of Amplicon Length on Normalization
Expression of 92 different genes was profiled (single well per gene) across 62 different FPE breast cancer specimens that had been archived from 1 to 17 years. All specimens yielded an adequate quantity of RNA for analysis. The mean and median raw CT for all patients and genes was 33.2 and 32.5, respectively. Raw CT values ranged from 24 to 40 (the latter being the default upper limit PCR cycle number that defines failure to detect a signal as set by the manufacturer).
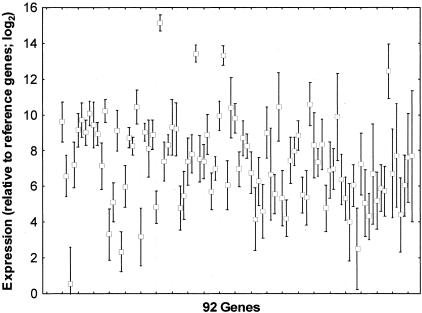
To be able to compare RT-PCR data from different tissue specimens, it is necessary to correct for relative differences in input RNA quantity and quality. These differences arise primarily from the variability inherent in processing surgical tissue specimens, including relative mass of tissue and the time between surgery and formalin fixation. A secondary consideration is the cumulative variability accrued while processing each sample from RNA extraction through quantitation, reverse transcription to cDNA, and PCR. This correction is routinely accomplished by normalizing raw expression values relative to a set of genes that vary little in their median expression among different tissue specimens (reference genes). Our observation that RNA continues to degrade with increased archive storage (Figure 1, above) raised the question whether RT-PCR signals tend to decay with increased archive storage, and if so, whether normalization to reference genes could compensate for this trend. Figure 2 shows the mean expression (±SD) relative to the six reference genes for all 92 genes.
Figure 2.
Expression ranges for 92 genes in 62 breast cancer specimens. TaqMan RT-PCR was used to measure mRNA levels as described in Materials and Methods, and expression relative to six reference genes. The mean and mean SD of the expression values across all tested patients is shown for each gene. Each box represents the mean mRNA level for all tested tumor specimens and the error bars indicate the SD of all measurements for that gene. Expression values (y axis) are normalized relative to the reference genes expressed as log base 2 values.
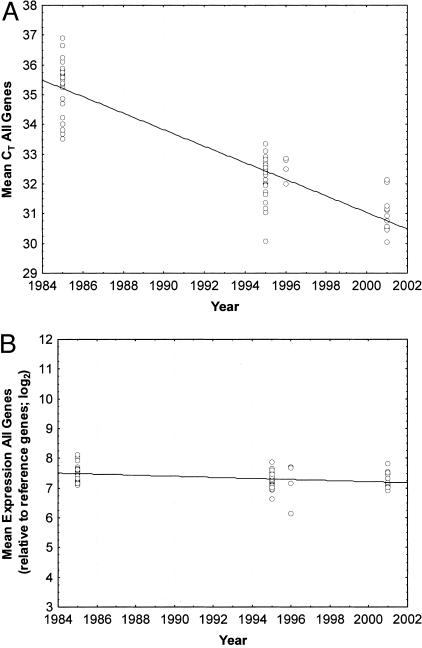
Each of the 62 specimens used for the 92-gene study was collected within one of three time ranges, specifically in year 2001, ∼1996, and ∼1985. Each symbol in Figure 3 represents the average CT across all of the tested genes for each of the 62 tested patient specimens. As shown in Figure 3A, CT values from the oldest specimens were substantially higher (mean, 35.3) than CT values from the newer specimens (mean, 31.0). Because the CT scale is log base 2, loss of five CT units between year 2001 and 1985 represents a decrease in average RT-PCR signal of >90%.
Figure 3.
A and B: Mean CT values for 92 genes in 62 patient samples as a function of paraffin block archive storage time. The x axis shows the year each specimen was archived. The y axis shows mean expression values for all tested genes. Each symbol represents a separate patient. A: Raw mean CT expression values for all specimens. B: Expression values after normalization relative to six reference genes, as described in Materials and Methods. Reference genes were β-ACTIN, CYP1, GUS, RPLPO, TBP, and TFRC. Lines: Linear regression best fit.
Normalization, using a six-gene reference set, effectively corrects for this bias (Figure 3B), flattening the slope of the curve seen in Figure 3A and compensating for the loss of RT-PCR signal that resulted throughout prolonged storage of FPE specimens. An analysis similar to that shown in Figure 3B was also performed on a gene by gene basis (data not shown). In general, individual genes yielded raw data that approximately corresponded to the curve in Figure 3A before normalization and to Figure 3B after normalization. However, for 12 genes the age of the block correlated with a rise in average normalized expression. For these 12 genes the average amplicon size was greater (104 ± 15 bases) than the average amplicon size of the other genes in the panel (78 ± 11 bases).
The amplicon size was greater than 90 bases for 10 of the 12 genes. Therefore, when possible, we redesigned probe and primer sets to fit within the relatively narrow range of 70 to 85 bases. We found that with the redesigned probe and primer sets normalization corrected for the archive storage-related bias. Thus, optimally, amplicon sizes not only must be limited in length but also the lengths of test gene and reference gene amplicons must be effectively homogeneous.
Results of a 92-Gene Assay: Clusters of Co-Expressed Genes
Subsets of the 92 tested genes would be expected to co-express based on results published by others. The presence or absence of these expected clusters of co-expressed genes can serve as one check of the expression data validity. The DNA array-based gene expression profiles published by Sorlie and colleagues11 identified four clusters of co-expressed genes in human breast cancer, likely representing different cell type subclasses. We included 11 genes from among these four cluster groups in our 92-gene panel. Table 1 shows that our assay clearly identifies the same gene clusters as Sorlie and colleagues.11 For example, the correlation coefficient for HER2 and GRB7 expression using our assay was 0.71. The HER2 gene is often amplified in breast cancer and the GRB7 gene lies nearby at this locus.22 For none of the other genes represented in Table 1 was there a strong indication of co-expression with these two genes. Similarly, the basal epithelial gene cluster represented by GRO1, KRT5, and KRT17 all had pair-wise correlation coefficients for their expression values between 0.6 and 0.8.
Table 1.
Pearson Correlation Coefficients for Expression of Selected Gene Pairs in 62 Breast Tumors
| ER1 | GATA3 | HNF3A | HER2 | GRB7 | ITGA7 | LPL | RBP4 | GRO1 | KRT5 | KRT17 | |
|---|---|---|---|---|---|---|---|---|---|---|---|
| ER1 | 1.00 | ||||||||||
| GATA3 | 0.60 | 1.00 | |||||||||
| HNF3A | 0.60 | 0.59 | 1.00 | ||||||||
| HER2 | −0.04 | −0.06 | 0.32 | 1.00 | |||||||
| GRB7 | −0.34 | −0.20 | 0.05 | 0.71 | 1.00 | ||||||
| ITGA7 | 0.19 | 0.01 | 0.33 | 0.23 | −0.03 | 1.00 | |||||
| LPL | 0.04 | 0.06 | 0.19 | −0.02 | 0.00 | 0.61 | 1.00 | ||||
| RBP4 | −0.01 | 0.16 | 0.19 | −0.11 | −0.06 | 0.47 | 0.84 | 1.00 | |||
| GRO1 | −0.38 | −0.52 | −0.41 | 0.03 | 0.12 | 0.23 | 0.03 | −0.04 | 1.00 | ||
| KRT5 | −0.32 | −0.44 | −0.36 | −0.03 | 0.04 | 0.22 | 0.05 | −0.01 | 0.64 | 1.00 | |
| KRT17 | −0.36 | −0.50 | −0.40 | −0.02 | 0.09 | 0.03 | 0.00 | −0.10 | 0.64 | 0.85 | 1.00 |
The 11 genes shown were identified in DNA array studies as representatives of four different gene expression clusters in human breast cancers, and are grouped separately in the first column of the table: 1) ER, GATA3, and HNF3A: luminal epithelial cluster; 2) HER2 and Grb7: ERBB2 amplicon cluster; 3) ITGA7, LPL, and RBP4: normal breast-like cluster; and 4) GRO1, KRT5, and KRT17: basal epithelial cluster).11 The expression data used are the same as shown in Figure 2.
Results of a 92-Gene Assay: Concordance between ER, PR, and HER2 mRNA Levels and Immunohistochemistry (IHC) Results
To validate the performance of our quantitative RT-PCR assay at measuring gene expression in FPE tissues, we compared the measured mRNA levels of the diagnostic marker genes estrogen receptor (ER), progesterone receptor (PR), and HER2, to their respective protein levels as determined by standard diagnostic assays based on IHC, for all 62 primary breast cancer FPE specimens. In addition, 17 specimens that were analyzed by RT-PCR and IHC for HER2 were also analyzed for HER2 gene amplification by fluorescent in situ hybridization (FISH). IHC and FISH were performed by an independent clinical diagnostics laboratory.
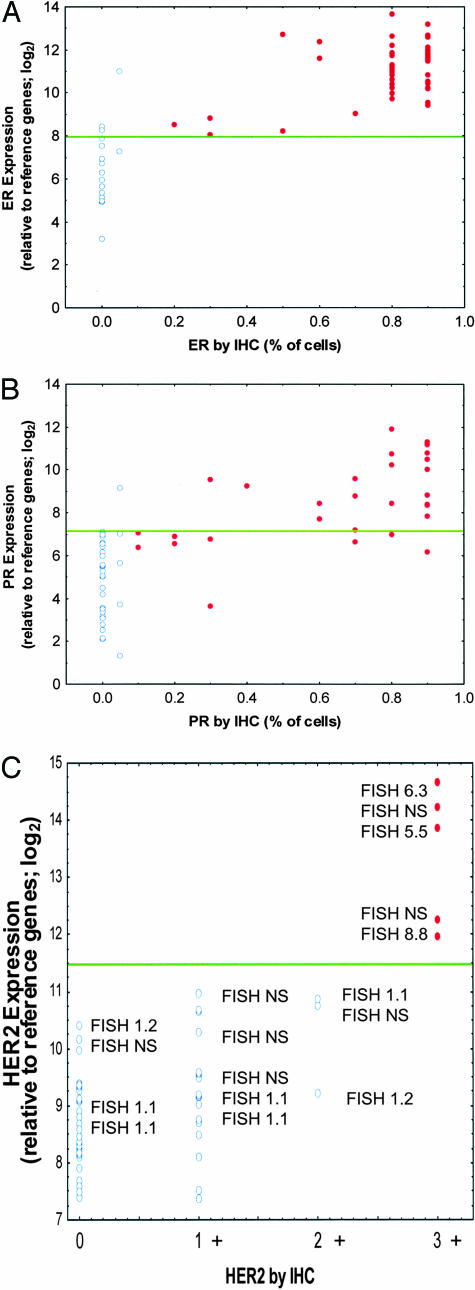
Figure 4, A to C, shows that a significant correlation exists between mRNA levels and (IHC-based) protein levels for each of these genes. For ER (Figure 4A) and PR (Figure 4B), the concordance between RT-PCR and IHC was further compared by defining a cut point to differentiate RT-PCR-positive and -negative receptor status. The derived interassay concordance values for ER and PR were ∼94% and ∼84%, respectively (Table 2).
Figure 4.
A–C: RT-PCR compared with IHC and FISH assays for ER, PR, and HER2 in 62 FPE breast tumors. The RT-PCR expression data from the 92-gene assay of 62 patient specimens are normalized relative to the reference genes and presented on a log base 2 scale. IHC and FISH assays were performed by an independent diagnostics reference laboratory. The RT-PCR and IHC/FISH laboratories were each blinded with respect to the data generated by the other laboratory at the time the analyses were performed. In each panel, normalized expression values are on the y axis and the IHC or FISH scores are on the x axis. A: Normalized ER expression compared with percentage of cells scored as ER+ by IHC. Open circles are ER− by IHC and filled circles are IHC ER+. Expression scores above ∼28.0 are ER+ and below are ER−. B: Normalized PR expression compared with percentage of cells scored as PR+ by IHC. Open circles are PR− by IHC and filled circles are IHC PR+. Expression scores above ∼27.2 are PR+ and below are PR−. C: Normalized HER2 expression compared with IHC scoring (0 to +3 scale). Open circles are HER2-negative and filled circles are HER2-positive. Expression scores above ∼211.5 are HER2+ and below are HER2−. FISH scores are noted for each case tested. NS, FISH was not scored.
Table 2.
Concordance between RT-PCR and IHC for ER and PR
| RT-PCR | IHC
|
|
|---|---|---|
| − | + | |
| ER | ||
| − | 13 | 0 |
| + | 4 | 45 |
| PR | ||
| − | 31 | 9 |
| + | 1 | 21 |
Data correspond to those represented in Figure 4, A and B. The RT-PCR data were dichotomized into positive (expressing) and negative (nonexpressing) levels using normalized expression values for ER and PR.
Figure 4C shows both IHC results for HER2 protein and FISH test results for HER2 gene amplification in comparison to the measured mRNA expression. In several older specimens FISH did not report a result, consistent with findings reported by others.23 In all other cases, the RT-PCR, IHC, and FISH assays all identified the same tumors as 3+ for HER2 expression. The 3+ HER2 designation is considered clinically relevant with patients classified as HER2 3+ exhibiting the greatest beneficial response to the therapeutic monoclonal antibody Herceptin.24
Gene Expression Profiles Compared between FPE and Frozen Tissue RNAs
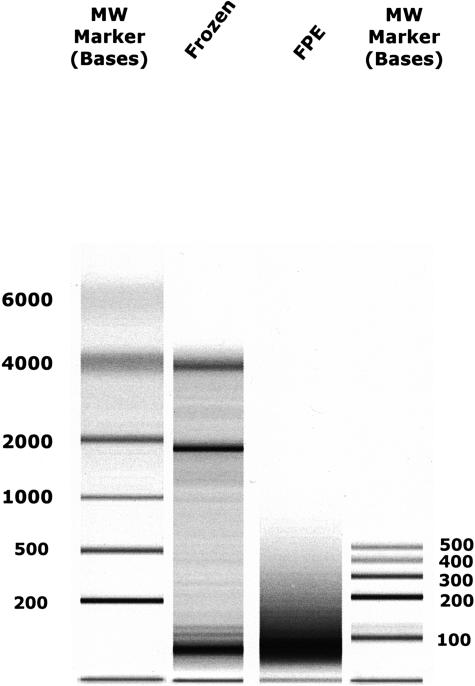
RT-PCR is often used as a standard against which to test other gene expression measurement methods, for example DNA array methods.25,26 Similarly, we sought to compare RT-PCR-based gene expression profiles from FPE tissue RNA with those from unfixed tissue RNA. For this purpose we identified FPE and frozen samples prepared from the same breast tumor in 1995. As shown in Figure 5, the RNA from the frozen tissue remained relatively intact, as indicated by detectable 28S and 18S ribosomal RNA bands. In contrast, much of the RNA from the FPE tissue was smaller than 200 bases in length. Nevertheless, we note that in our experience frozen tissues often yield RNA that is similarly fragmented. The specimens chosen here were deliberately selected for their well-preserved RNA. We have explored in some detail the effect of tissue processing on gene expression profiles using fresh placenta tissue as a model. RNA isolated from placenta tissue transferred shortly after delivery into RNAlater (Ambion, Inc., Austin, TX) preservative was compared with frozen tissue and with tissue fixed using a variety of fixing times and conditions. Expression profiles were found to be highly concordant among tissues processed by all of these methods (manuscript in preparation).
Figure 5.
RNA size analysis of paired frozen and FPE tissue RNAs. Total RNA was extracted from frozen and FPE tissue specimens as described in Materials and Methods then analyzed for size profile using an Agilent 2100 Bioanalyzer, RNA 6000 Nanochip. One μl from each RNA preparation (1/30 of the sample) was analyzed. Lanes 2 and 3 contain frozen and FPE RNA, respectively, from the same breast tumor (from a 1995 surgery). Lanes M1 and M2 contain different sets of molecular weight RNAs (band sizes denoted in bases).
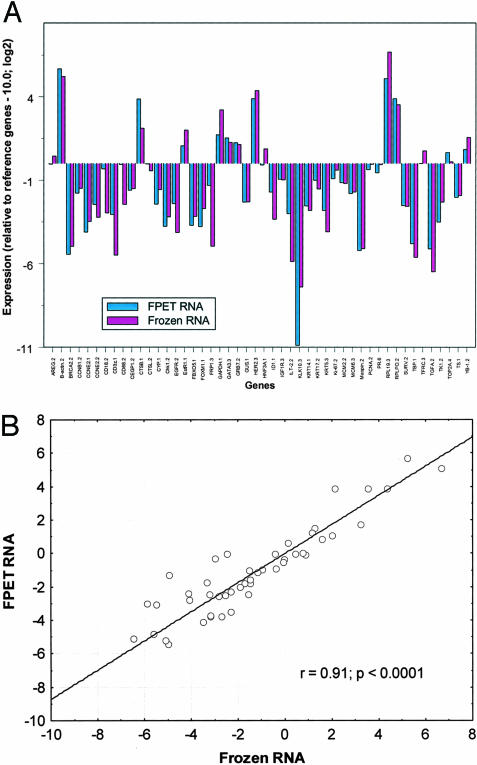
The RNAs from the paired FPE and frozen samples were profiled with a 48-gene assay that consisted of 42 test genes and six reference genes. Before reference normalization the expression profiles were very similar but offset on the y axis by approximately two CT values, consistent with an average ∼75% loss of intact amplicon template in the FPE material (data not shown). The normalized profiles were not only similar but essentially identical between the two samples for most genes. The comparative results are shown for each gene in Figure 6A. The adjusted Pearson correlation R between FPE and frozen tissue for all tested genes was 91% (Figure 6B).
Figure 6.
A–B: Comparison of RT-PCR expression profiles of 48 genes from paired frozen and FPE tissue RNAs. A: RNA was extracted from the frozen and FPET specimens and mRNA levels were determined by TaqMan quantitative RT-PCR as described in Materials and Methods. Results are plotted in a bar graph. Each bar represents normalized expression relative to the reference genes, and the mean of three measurements. B: Pearson correlation for all 48 genes between the two tissue preparation methods is 0.91.
Discussion
It is possible to measure mRNA using FPE tissue as a source of RNA as has been demonstrated in more than a dozen peer-reviewed articles from nearly as many groups, spanning from 1988 to the present.1–9,27–32 Nevertheless, this approach to mRNA measurement has not been widely applied to developing assays for medical practice. This is unfortunate because the enormous number of FPE biopsy specimens associated with clinical records would allow faster validation of potential clinically useful markers. It is possible that, despite the significant number of journal articles that describe this technique, there is a perception that the published examples are exceptional in some way, for example that only a small fraction of mRNA species can actually be measured by this approach. The present study may help lay such perceptions to rest.
In this study, two multianalyte assays one with 48 genes and the other with 92 genes, were designed and tested in different experiments with preserved human breast cancer tissue. In the first case, all of the genes profiled in FPE RNA yielded measurable values, and the overall profile was validated by its similarity to that generated with well-preserved RNA from matched fresh-frozen tissue. In the second experiment using a 92-gene assay only one of the tested genes failed to yield a signal.
Measured levels of ER, PR, and HER2 mRNAs were concordant with the levels of the respective proteins as measured by IHC at an independent clinical reference laboratory. Approximately 90% concordance was obtained when RT-PCR expression results for ER and PR were dichotomized into positive and negative values and compared to ER- and PR-positive and -negative assignments based on IHC. It is noteworthy, that similar levels of concordance were found in other comparative studies of IHC versus RT-PCR.33,34 Interestingly, those studies differed from the present study in that the RT-PCR analyses of ER and PR were performed with RNA from unfixed breast tissue.
Although the number of different mRNA species measured per RT-PCR assay panel as described in the present study could be extended to hundreds of different mRNAs, it will likely remain impractical in the near future to develop RT-PCR assays for the tens of thousands of genes it is possible to measure with DNA array technology. On the other hand, little evidence exists to date that DNA arrays can effectively be applied to FPE tissue RNA analysis.35 RT-PCR and DNA array technologies complement each other in this respect for clinical research. Data from array experiments on limited numbers of frozen tissue specimens generate candidate gene sets of tens to hundreds of genes10–13 that can then be screened at high resolution in multiplexed RT-PCR experiments on relatively large numbers of available FPE tissue specimens.
IHC remains the standard gene expression assay that is widely used in diagnostic clinical applications despite its numerous weaknesses that include variation in sensitivity from field to field, dependence on fixation conditions, and lack of calibrated quantitation.36 The advantages of RT-PCR with respect to reproducibility, quantitation, sensitivity, dynamic range, and multianalyte capability, make this a promising diagnostic technology for immediate future application.
Footnotes
Address reprint requests to Joffre Baker, Genomic Health, Inc., 301Penobscot Dr., Redwood City, CA 94063. E-mail: joff@genomichealth.com.
References
- Rupp GM, Locker J. Purification and analysis of RNA from paraffin-embedded tissues. Biotechniques. 1988;6:56–60. [PubMed] [Google Scholar]
- Finke J, Fritzen R, Ternes P, Lange W, Dolken G. An improved strategy and a useful housekeeping gene for RNA analysis from formalin-fixed, paraffin-embedded tissues by PCR. Biotechniques. 1993;14:448–453. [PubMed] [Google Scholar]
- Reichmuth C, Markus MA, Hillemanns M, Atkinson MJ, Unni KK, Saretzki G, Hofler H. The diagnostic potential of the chromosome translocation t(2;13) in rhabdomyosarcoma: a PCR study of fresh-frozen and paraffin-embedded tumour samples. J Pathol. 1996;180:50–57. doi: 10.1002/(SICI)1096-9896(199609)180:1<50::AID-PATH629>3.0.CO;2-C. [DOI] [PubMed] [Google Scholar]
- Stanta G, Bonin S. RNA quantitative analysis from fixed and paraffin-embedded tissues: membrane hybridization and capillary electrophoresis. Biotechniques. 1998;24:271–276. doi: 10.2144/98242st04. [DOI] [PubMed] [Google Scholar]
- Sheils OM, Sweeney EC. TSH receptor status of thyroid neoplasms—TaqMan RT-PCR analysis of archival material. J Pathol. 1999;188:87–92. doi: 10.1002/(SICI)1096-9896(199905)188:1<87::AID-PATH322>3.0.CO;2-5. [DOI] [PubMed] [Google Scholar]
- Godfrey TE, Kim SH, Chavira M, Ruff DW, Warren RS, Gray JW, Jensen RH. Quantitative mRNA expression analysis from formalin-fixed, paraffin-embedded tissues using 5′ nuclease quantitative reverse transcription-polymerase chain reaction. J Mol Diagn. 2000;2:84–91. doi: 10.1016/S1525-1578(10)60621-6. [DOI] [PMC free article] [PubMed] [Google Scholar]
- Specht K, Richter T, Muller U, Walch A, Werner M, Hofler H. Quantitative gene expression analysis in microdissected archival formalin-fixed and paraffin-embedded tumor tissue. Am J Pathol. 2001;158:419–429. doi: 10.1016/S0002-9440(10)63985-5. [DOI] [PMC free article] [PubMed] [Google Scholar]
- Abrahamsen HN, Steiniche T, Nexo E, Hamilton-Dutoit SJ, Sorensen BS. Towards quantitative mRNA analysis in paraffin-embedded tissues using real-time reverse transcriptase-polymerase chain reaction: a methodological study on lymph nodes from melanoma patients. J Mol Diagn. 2003;5:34–41. doi: 10.1016/S1525-1578(10)60449-7. [DOI] [PMC free article] [PubMed] [Google Scholar]
- Lewis F, Maughan NJ, Smith V, Hillan K, Quirke P. Unlocking the archive—gene expression in paraffin-embedded tissue. J Pathol. 2001;195:66–71. doi: 10.1002/1096-9896(200109)195:1<66::AID-PATH921>3.0.CO;2-F. [DOI] [PubMed] [Google Scholar]
- Davis RE, Staudt LM. Molecular diagnosis of lymphoid malignancies by gene expression profiling. Curr Opin Hematol. 2002;9:333–338. doi: 10.1097/00062752-200207000-00011. [DOI] [PubMed] [Google Scholar]
- Sorlie T, Perou CM, Tibshirani R, Aas T, Geisler S, Johnsen H, Hastie T, Eisen MB, van de RM, Jeffrey SS, Thorsen T, Quist H, Matese JC, Brown PO, Botstein D, Eystein LP, Borresen-Dale AL. Gene expression patterns of breast carcinomas distinguish tumor subclasses with clinical implications. Proc Natl Acad Sci USA. 2001;98:10869–10874. doi: 10.1073/pnas.191367098. [DOI] [PMC free article] [PubMed] [Google Scholar]
- van’t Veer LJ, Dai H, van de Vijver MJ, He YD, Hart AA, Mao M, Peterse HL, van der KK, Marton MJ, Witteveen AT, Schreiber GJ, Kerkhoven RM, Roberts C, Linsley PS, Bernards R, Friend SH. Gene expression profiling predicts clinical outcome of breast cancer. Nature. 2002;415:530–536. doi: 10.1038/415530a. [DOI] [PubMed] [Google Scholar]
- Ramaswamy S, Tamayo P, Rifkin R, Mukherjee S, Yeang CH, Angelo M, Ladd C, Reich M, Latulippe E, Mesirov JP, Poggio T, Gerald W, Loda M, Lander ES, Golub TR. Multiclass cancer diagnosis using tumor gene expression signatures. Proc Natl Acad Sci USA. 2001;98:15149–15154. doi: 10.1073/pnas.211566398. [DOI] [PMC free article] [PubMed] [Google Scholar]
- Chang JC, Wooten EC, Tsimelzon A, Hilsenbeck SG, Gutierrez MC, Elledge R, Mohsin S, Osborne CK, Chamness GC, Allred DC, O’Connell P. Gene expression profiling for the prediction of therapeutic response to docetaxel in patients with breast cancer. Lancet. 2003;362:362–369. doi: 10.1016/S0140-6736(03)14023-8. [DOI] [PubMed] [Google Scholar]
- van de Vijver MJ, He YD, van’t Veer LJ, Dai H, Hart AA, Voskuil DW, Schreiber GJ, Peterse JL, Roberts C, Marton MJ, Parrish M, Atsma D, Witteveen A, Glas A, Delahaye L, van d V, Bartelink H, Rodenhuis S, Rutgers ET, Friend SH, Bernards R. A gene-expression signature as a predictor of survival in breast cancer. N Engl J Med. 2002;347:1999–2009. doi: 10.1056/NEJMoa021967. [DOI] [PubMed] [Google Scholar]
- Rosenwald A, Wright G, Wiestner A, Chan WC, Connors JM, Campo E, Gascoyne RD, Grogan TM, Muller-Hermelink HK, Smeland EB, Chiorazzi M, Giltnane JM, Hurt EM, Zhao H, Averett L, Henrickson S, Yang L, Powell J, Wilson WH, Jaffe ES, Simon R, Klausner RD, Montserrat E, Bosch F, Greiner TC, Weisenburger DD, Sanger WG, Dave BJ, Lynch JC, Vose J, Armitage JO, Fisher RI, Miller TP, LeBlanc M, Ott G, Kvaloy S, Holte H, Delabie J, Staudt LM. The proliferation gene expression signature is a quantitative integrator of oncogenic events that predicts survival in mantle cell lymphoma. Cancer Cell. 2003;3:185–197. doi: 10.1016/s1535-6108(03)00028-x. [DOI] [PubMed] [Google Scholar]
- Nutt CL, Mani DR, Betensky RA, Tamayo P, Cairncross JG, Ladd C, Pohl U, Hartmann C, McLaughlin ME, Batchelor TT, Black PM, von Deimling A, Pomeroy SL, Golub TR, Louis DN. Gene expression-based classification of malignant gliomas correlates better with survival than histological classification. Cancer Res. 2003;63:1602–1607. [PubMed] [Google Scholar]
- Rozen S, Skaletsky H. Primer3 on the WWW for general users and for biologist programmers. Methods Mol Biol. 2000;132:365–386. doi: 10.1385/1-59259-192-2:365. [DOI] [PubMed] [Google Scholar]
- Vandesompele J, De Preter K, Pattyn F, Poppe B, Van Roy N, De Paepe A, Speleman F. Accurate normalization of real-time quantitative RT-PCR data by geometric averaging of multiple internal control genes. Genome Biol. 2002;3:RESEARCH0034. doi: 10.1186/gb-2002-3-7-research0034. [DOI] [PMC free article] [PubMed] [Google Scholar]
- Suzuki T, Higgins PJ, Crawford DR. Control selection for RNA quantitation. Biotechniques. 2000;29:332–337. doi: 10.2144/00292rv02. [DOI] [PubMed] [Google Scholar]
- Goldsworthy SM, Stockton PS, Trempus CS, Foley JF, Maronpot RR. Effects of Fixation on RNA extraction and amplification from laser capture microdissected tissue. Mol Carcinog. 1999;25:86–91. [PubMed] [Google Scholar]
- Stein D, Wu J, Fuqua SA, Roonprapunt C, Yajnik V, D’Eustachio P, Moskow JJ, Buchberg AM, Osborne CK, Margolis B. The SH2 domain protein GRB-7 is co-amplified, overexpressed and in a tight complex with HER2 in breast cancer. EMBO J. 1994;13:1331–1340. doi: 10.1002/j.1460-2075.1994.tb06386.x. [DOI] [PMC free article] [PubMed] [Google Scholar]
- Miranda RN, Mark HF, Medeiros LJ. Fluorescent in situ hybridization in routinely processed bone marrow aspirate clot and core biopsy sections. Am J Pathol. 1994;145:1309–1314. [PMC free article] [PubMed] [Google Scholar]
- Genentech, Inc. Herceptin Package Insert. 2003. [Google Scholar]
- Chuaqui RF, Bonner RF, Best CJ, Gillespie JW, Flaig MJ, Hewitt SM, Phillips JL, Krizman DB, Tangrea MA, Ahram M, Linehan WM, Knezevic V, Emmert-Buck MR. Post-analysis follow-up and validation of microarray experiments. Nat Genet. 2002;32:S509–S514. doi: 10.1038/ng1034. [DOI] [PubMed] [Google Scholar]
- Rajeevan MS, Ranamukhaarachchi DG, Vernon SD, Unger ER. Use of real-time quantitative PCR to validate the results of cDNA array and differential display PCR technologies. Methods. 2001;25:443–451. doi: 10.1006/meth.2001.1266. [DOI] [PubMed] [Google Scholar]
- Koopmans M, Monroe SS, Coffield LM, Zaki SR. Optimization of extraction and PCR amplification of RNA extracts from paraffin-embedded tissue in different fixatives. J Virol Methods. 1993;43:189–204. doi: 10.1016/0166-0934(93)90076-4. [DOI] [PMC free article] [PubMed] [Google Scholar]
- Mies C. A simple, rapid method for isolating RNA from paraffin-embedded tissues for reverse transcription-polymerase chain reaction (RT-PCR). J Histochem Cytochem. 1994;42:811–813. doi: 10.1177/42.6.7514626. [DOI] [PubMed] [Google Scholar]
- Houze TA, Gustavsson B. Sonification as a means of enhancing the detection of gene expression levels from formalin-fixed, paraffin-embedded biopsies. Biotechniques. 1996;21:1074–1082. doi: 10.2144/96216st05. [DOI] [PubMed] [Google Scholar]
- O’Shea U, Wyatt JI, Howdle PD. Analysis of T cell receptor beta chain CDR3 size using RNA extracted from formalin fixed paraffin wax embedded tissue. J Clin Pathol. 1997;50:811–814. doi: 10.1136/jcp.50.10.811. [DOI] [PMC free article] [PubMed] [Google Scholar]
- D’Orazio D, Stumm M, Sieber C. Accurate gene expression measurement in formalin-fixed and paraffin-embedded tumor tissue. Am J Pathol. 2002;160:383–384. doi: 10.1016/S0002-9440(10)64382-9. [DOI] [PMC free article] [PubMed] [Google Scholar]
- Thomazy VA, Luthra R, Uthman MO, Davies PJ, Medeiros LJ. Determination of cyclin D1 and CD20 mRNA levels by real-time quantitative RT-PCR from archival tissue sections of mantle cell lymphoma and other non-Hodgkin’s lymphomas. J Mol Diagn. 2002;4:201–208. doi: 10.1016/S1525-1578(10)60704-0. [DOI] [PMC free article] [PubMed] [Google Scholar]
- Chevillard S, Muller A, Levalois C, Laine-Bidron C, Vielh P, Magdelenat H. Reverse transcription-polymerase chain reaction (RT-PCR) assays of estrogen and progesterone receptors in breast cancer. Breast Cancer Res Treat. 1996;41:81–89. doi: 10.1007/BF01807039. [DOI] [PubMed] [Google Scholar]
- Knowlden JM, Gee JM, Bryant S, McClelland RA, Manning DL, Mansel R, Ellis IO, Blamey RW, Robertson JF, Nicholson RI. Use of reverse transcription-polymerase chain reaction methodology to detect estrogen-regulated gene expression in small breast cancer specimens. Clin Cancer Res. 1997;3:2165–2172. [PubMed] [Google Scholar]
- Karsten SL, Van Deerlin VM, Sabatti C, Gill LH, Geschwind DH. An evaluation of tyramide signal amplification and archived fixed and frozen tissue in microarray gene expression analysis. Nucleic Acids Res. 2002;30:E4. doi: 10.1093/nar/30.2.e4. [DOI] [PMC free article] [PubMed] [Google Scholar]
- Paik S, Bryant J, Tan-Chiu E, Romond E, Hiller W, Park K, Brown A, Yothers G, Anderson S, Smith R, Wickerham DL, Wolmark N. Real-world performance of HER2 testing—National Surgical Adjuvant Breast and Bowel Project experience. J Natl Cancer Inst. 2002;94:852–854. doi: 10.1093/jnci/94.11.852. [DOI] [PubMed] [Google Scholar]


