Abstract
Partial bladder outlet obstruction (PBOO) induces remodeling of urinary bladder smooth muscle (detrusor). We demonstrate an increase in bladder wall mass, muscle bundle size, and a threefold increase in the cross-sectional area of detrusor myocytes following PBOO in male New Zealand White rabbits compared to that of controls. Some bladders with detrusor hypertrophy function close to normal (compensated), whereas others were dysfunctional (decompensated), showing high intravesical pressure, large residual urine volume, and voiding difficulty. We analyzed the expression of smooth muscle-specific caldesmon (h-CaD) and non-muscle (l-CaD) by Western blotting, RT-PCR, and real-time PCR. The expression of l-CaD is increased significantly at the mRNA and protein levels in the decompensated bladders compared to that of normal and compensated bladders. The CaD was also co-localized with myosin containing cytoplasmic fibrils in cells dissociated from obstructed bladders and cultured overnight. Our data show that the inability of decompensated bladders to empty, despite detrusor hypertrophy, is associated with an overexpression of l-CaD. The level of l-CaD overexpression might be a useful marker to estimate the degree of detrusor remodeling and contractile dysfunction in PBOO.
Obstruction of the urinary bladder outlet, one of the major effects of benign prostate hypertrophy (BPH) in men, induces remodeling of smooth muscle in the bladder wall and leads to impairment of the ability of the bladder to store and to empty urine.1–3 The rabbit model for partial outlet obstruction (PBOO) has been used to demonstrate that such obstruction induces a significant increase in bladder mass.4,5 PBOO also results in increased micturition frequency, urine residual volume and intravesical micturition pressure.6 However, the degree of bladder remodeling and dysfunction caused by PBOO varies,7 and a suitable characteristic useful in the clinical identification of bladder remodeling is not yet available.8
Following bladder outlet obstruction, the bladder function is altered. Although the detrusor smooth muscle hypertrophy to compensate for the increased muscle contractility required to overcome the increased urethral resistance during micturition, only some rabbits reveal functions close to normal. Other rabbits show severe bladder dysfunction, despite the smooth muscle hypertrophy.5,9 Detrusor smooth muscle from these animals reveals alterations in the contractile characteristics.
Actin-associated protein caldesmon (CaD) is thought to modulate the regulation of smooth muscle contraction by myosin-mediated regulation, via the phosphorylation of myosin light chain.10,11 CaD is an actin-associated protein, expressed as two dominant isoforms, l-CaD and h-CaD with low and high molecular sizes, respectively. l-CaD is found in non-muscle cells of various tissue types,12 whereas h-CaD is present in smooth muscle cells from all sources.13 h-CaD is bound to thin filaments in smooth muscle,14,15 where it inhibits the actin-myosin interaction and actomyosin ATPase activity.13,15–17 This protein also binds to calmodulin at specific sites,18–20 and the inhibition of actin-activated ATPase is reversed by calmodulin in the presence of Ca2+.11,15,21 h-CaD also inhibits the in vitro motility of actin filaments over myosin heads22,23 and this inhibition requires the N-terminal myosin-binding region and the C-terminal actin-binding region of the molecule.24 Thus, the tethering of actin filaments to the myosin S-2 region by h-CaD17 is essential for the inhibition of actin filament motility by the h-CaD in the in vitro motility assay.24 Using N-terminal region of CaD, Lee et al25 provided further support for the role of tethering in regulating the tone of vascular smooth muscle. Inhibition of h-CaD expression by antisense oligodeoxynucleotides in arterial muscle strips produced 62% less KCl-induced force than controls, and unstimulated h-caldesmon-deficient smooth muscle tissues stretched and then released redeveloped force, demonstrating active cross-bridge cycling.26 Interaction between CaD and actin may be modulated by the phosphorylation of CaD.27
The role of l-CaD in contractility or cell motility is less clear, although it has been shown to cause bundling of actin filaments.28 l-CaD is a component of stress fibers and may be involved in cell shape changes.29 Both l-CaD and h-CaD have similar regions for binding to actin and myosin.30
In this study, we analyzed the expression of h-CaD and l-CaD in the detrusor smooth muscle, which undergoes remodeling following partial outlet obstruction. We find that the detrusor smooth muscle hypertrophy following partial outlet obstruction is associated with alterations in the expression of both l- and h-CaD isoforms. Furthermore, there is an overexpression of l-CaD in the hypertrophied detrusor smooth muscle in decompensated dysfunctional urinary bladders, whereas the smooth muscle in the compensated bladders revealed a slight increase in the h-CaD isoforms. The relative expression of l-CaD and h-CaD may determine the level of remodeling in the smooth muscle to compensate for the increased force required to expel the urine during obstruction.
Materials and Methods
Partial Outlet Obstruction
All animal procedures used in this study were approved by the Institute of Animal Care and Use Committee (IACUC) of the Children’s Hospital of Philadelphia and the University of Pennsylvania. Male New Zealand White rabbits (3–5 kg) were separated into three groups: normal (n = 10), sham-operated (n = 12), and obstructed (n = 23). Urinary bladder outlet was obstructed as described.31 Two weeks after the surgery, obstructed and sham-operated rabbits were kept in metabolic cages (Kent Scientific Corp., Torrington, CT) before sacrifice and bladder function was monitored. Urine output and voiding frequency were continuously monitored, and in vivo videourodynamics without sedation was performed. Based on the urinary bladder function monitoring, obstructed rabbits were divided into two groups: compensated (N = 11), in which the bladder function recovered nearly completely, and decompensated (N = 12), in which severe voiding dysfunction was observed, despite detrusor hypertrophy.
Bladder Function Studies
Noninvasive monitoring of the voiding patterns was done by keeping the rabbits in metabolic cages 3 days before sacrifice as previously described.9 After keeping the rabbits for two days in the metabolic cages to adjust to the environment, voided urine was monitored by collection on digital scales interfaced to a computer. Scales were monitored at 2-minute intervals. Collected data were transferred into spreadsheet for analysis. Frequency data were expressed as voids per 24 hours and average voided volume was expressed in milliliters per void.
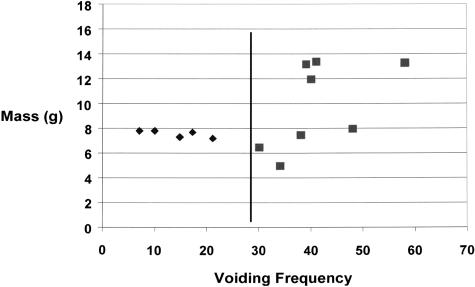
Bladders were classified into normal, sham-operated, and obstructed groups. After obstruction, all rabbits develop bladder dysfunction. Normal rabbits void 4 ± 3 times per 24 hours and the total urine volume/void is around 31 ± 17 ml per void. These parameters were not significantly different for the sham-operated rabbits. For some obstructed rabbits the function returns close to normal (14 ± 9 voids/24 hours and 18 ± 14 ml/void), and they were classified as compensated. Other rabbits continued to show dysfunction as determined from the voids per 24 hours (43 ± 12 ml), and volume of urine per void (2.5 ± 1 ml). Since compensation and decompensation was a graded phenomenon, the separation of obstructed animals into compensated and decompensated animals was arbitrary. Rabbits which had a voiding frequency of <28 per 24 hours was grouped as compensated, and those gave a voiding frequency of >28 were grouped as decompensated. A correlation between the number of voids per 24 hours the day before the sacrifice and the bladder mass at the time of sacrifice is shown in Figure 1. All of the compensated rabbits used for this study had a bladder mass of around 6 to 8 g and a voiding frequency between 10 to 25 voids per 24 hours. The decompensated rabbits used had a voiding frequency of 30 to 60 per 24 hours, and their bladders weighed about 8 to 15 g.
Figure 1.
Relationship between voiding frequency before sacrifice and bladder mass at the time of sacrifice. Despite the consistency of the surgical technique to produce outlet obstruction, a variable degree of bladder hypertrophy and bladder dysfunction is observed 2 weeks after the outlet obstruction. Some rabbits reveal severe bladder dysfunction, voiding up to 60 times, whereas other obstructed rabbits void only around 10 times in 24 hours. Control rabbits (sham and normal) void 4 to 6 times/24 hours (data not shown). For this study, obstructed rabbits which void <28 times/24 hours were grouped as compensated, and those with voiding frequency of >28 were classified as decompensated. Although all obstructed rabbits showed bladder wall hypertrophy, the hypertrophy was severe (up to sevenfold) for some decompensated bladders.
Videourodynamic Studies
The ability to study the whole bladder in situ in an awake and neurologically intact animal offers a tremendous advantage in understanding the effects of obstruction-induced hypertrophy. The abdomen was opened and a purse-string suture was placed in the detrusor muscle. A long hemostat was used to create a subcutaneous tunnel from the nape of the animal’s neck to the incision site; two double-lumen catheters were passed through this tunnel. One catheter was passed into the bladder via a stab wound and the purse-string suture secured in place. The second catheter had a small glove tip attached to it with silk sutures and function as an intraperitoneal pressure transducer. Once the catheters were in place, the abdomen was closed in layers. The animal was returned to the cage for 24 hours and allowed for the anesthetics to wear off.
Twenty-four hours later the animal was placed in a radiolucent plastic restrainer in the cardiac fluoroscopy suit and allowed 15 minutes to acclimate to the new surroundings. The bladder was then emptied of all residual urine, and a slow-fill cystometrogram was performed at 1 ml/min with 25% X-ray contrast. Periodic fluoroscopy was done to ensure no extravasation was taking place. With any rise in bladder pressure, fluoroscopy was used to confirm whether the animal was voiding. True voiding pressure was determined by subtracting the abdominal pressure from the detrusor pressure. Residual urine was determined by aspiration from the bladder on completion of the void with fluoroscopic confirmation. On completion of the study, the animal was anesthetized, the bladder harvested, and the animal was euthanized.
Fixation and Embedding
Bladder tissues were fixed in 4% paraformaldehyde in PBS (pH 7.4) at 4°C for 2 hours. Tissues were washed three times in PBS for 30 minutes each, dehydrated in an ascending ethanol series (30, 50, 70, 85, 95, and 100%), infiltrated into Technovit 7100 (Heraeus Kulzer GmbH & Co. KG, Wehrheim, Germany) overnight, and embedded in Technovit 7100 at room temperature by adding the polymerization agent provided in the kit.
Sectioning and Morphometry
Semithin sections (2–3 μm) were prepared using a LKB rotary retracting microtome with a tungsten carbide blade. For histological study, slides were stained with 2% toluidine blue O, washed in water, and temporarily mounted with 50% glycerol. For measurement of the area of bladder detrusor layer, mucosa layer, and cavity in the bladder wall, cross-sections of bladder obtained through the mid-portion of the bladder were used. Low-power photographs were taken under a dissecting microscope. For cellular measurements, high-power photographs were taken using a Leitz Orthoplan 2 microscope with a 40× objective lens. All measurements were obtained from the photographs using Image-Pro Plus software (Phase 3 Imaging System, Glen Mills, PA). Measurements of cell diameter were made from cross-section of the cells in the muscle bundles which revealed the nuclei in the cytoplasm.
RNA Extraction and RT-PCR
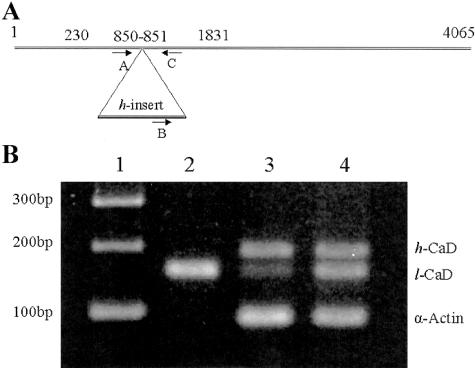
Total RNA from the muscular layer of the bladder was isolated from 100 mg of tissue using TRIZol (GIBCO-BRL). The cDNA was reverse-transcribed from 2 μg of total RNA using oligo-dT primer (Promega) and Moloney murine leukemia virus reverse transcriptase (GIBCO) at 37°C for 60 minutes. The cDNA (2 μl) was amplified by PCR in a 100-μl reaction mixture for 30 cycles (50 seconds at 94°C, 30 seconds at 55°C, and 30 seconds at 72°C, with a minimum of 7-minute final extension at 72°C after 30 cycles) using the following primers: upstream l-CaD (primer A, 5′CAAATCCGAGCAGAAGAATGACTG3′), the upstream h-CaD specific (primer B, 5′CAGAAGGGAAGTCGGTAAATGAAA3′) and downstream h-CaD and l-CaD (primer C, 5′TCTTCTTTGGCCTCTTTGTCCTT3′). The upstream and downstream primers were designed according to GenBank nucleotides RABLCA (accession no. L37147) and RABRSMC (accession no. L37206). The h-CaD space region is inserted between nucleotides 850 and 851 of the l-CaD, and the primer for l-CaD and the primer for h-CaD cross-overlap this inserted region. The primers for h-CaD share the downstream primer and an upstream primer from the insert space region. Figure 4A shows the location of these primers in the CaD cDNA. PCR products were resolved in 2% agarose gels and stained with ethidium bromide.
Figure 4.
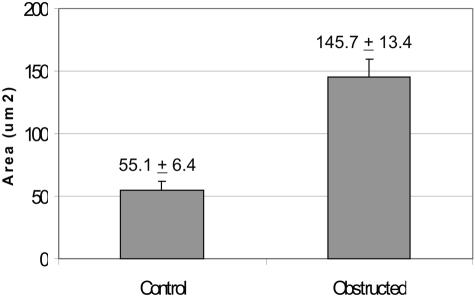
Comparison of cross-sectional area of smooth muscle cells of normal and obstructed rabbit bladder. Smooth muscle cells containing nuclei were chosen to determine the cross-sectional area using Image-Pro Plus software (Media Cybernetics). Data are given as means + SEM cross-sectional area of 25 normal bladder cells and 27 obstructed bladder cells.
Real-Time PCR
Real-time PCR was performed by the LightCycler (Roche, Indianapolis, IN). A master mix of the following reaction components was prepared to the indicated end concentration: 1 μl of forward primer (0.4 μmol/L), 1 μl of reverse primer (0.4 μmol/L), 4 μl of 5X PCR buffer (BD Biosciences, Palo Alto, CA), 2 μl of dNTP (100 μmol/L), 0.4 μl of DMSO, 2 μl of SYBR Green I (Sigma, St. Louis, MO), 11 μl of water, and 0.6 μl of titanium TaqDNA polymerase (BD Biosciences). 19 μl of master mix was filled in the LightCycler glass capillaries and 1 μl of cDNA was added as PCR template. Capillaries were closed, centrifuged, and placed into the LightCycler rotor. The following LightCycler PCR protocol was used: denaturation program (95°C for 30 seconds) amplification program repeated 20 to 35 cycles (95°C for 5 seconds, 68°C for 20 seconds with a single fluorescence measurement), melting curve program (60–95°C with a heating rate of 0.1°C per second and a continuous fluorescence measurement) and finally a cooling step to 40°C. The specificity of the PCR product was verified by the melting curve analysis and gel electrophoresis. The primers for h-CaD and l-CaD were the same as in regular RT-PCR.
Protein Extraction and Western Blot Analysis
Total protein was extracted in extraction buffer [20% glycerol, 50 mmol/L Tris-HCl (pH 6.8) and 0.5% (v/v) Tween 20], and protease inhibitor cocktail (Sigma). After adding 10% SDS, the sample was mixed, boiled for 4 minutes, and centrifuged at 10,000 rpm for 15 minutes to remove undissolved material. Protein concentration in the supernatant was measured using the Bio-Rad DC protein assay kit. Aliquots of protein extract containing 30 μg of total protein were electrophoresed in a 6% SDS-PAGE gel, and blotted overnight at 4°C to P-membrane with Towbin buffer [25 mmol/L Tris, 192 mmol/L glycine, and 20% (v/v) methanol]. The membrane was blocked with 5% dry milk, and incubated with antibody against CaD (Sigma, catalog no. C-297). After treatment with primary antibody, the membrane was washed in TBST buffer (20 mmol/L Tris, 500 mmol/L NaCl, 0.05% Tween 20), and incubated with secondary antibody (goat anti-mouse IgG at 1:10000). Final exposure was obtained using ECL (Amersham Pharmacia Biotech). Scanning densitometry was done on gels with loadings of proteins at concentrations which fell within the linear portion of the curve of protein concentration versus absorption (of the Coomassie blue stained SDS-PAGE gels).
Immunolocalization
The antibodies used for immunolocalization were obtained commercially from the following sources: α-actin antibody from Sigma (catalog no. F3777); smooth muscle myosin antibody from Sigma (catalog no. M-7786); antibody against C-terminal region of CaD from Sigma (catalog no. C0297); and antibody specific to h-CaD from BioGenex (h-Clone, Ab No. 332M, catalog no. MU332-UC). Plastic sections were blocked with 1% BSA in PBS for 1 hour and incubated with anti-CaD (1:125) in blocking solution overnight at 4°C. Slides were washed with PBS three times for 5 minutes each, incubated with CY3-conjugated anti-mouse IgG (Sigma catalog no. C 2181) diluted at 1:250 for 2 to 4 hours at room temperature, washed with PBS three times of 5 minutes each, and mounted in Aqua-Poly/Mount (Polysciences) medium. Photographs were taken using a Leitz Orthoplan 2 fluorescence microscope.
Statistical Analysis
Data are given as means ± SE (SEM) compared by one-way analysis of variance (ANOVA), and analyzed using Dunnet’s test of multiple comparisons versus control groups. Differences were considered significant at P < 0.05.
Results
Urodynamic Studies
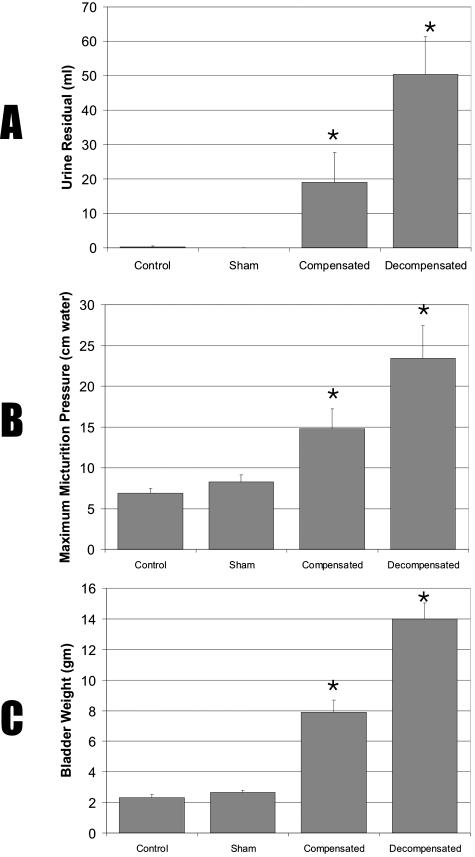
Frequency of urination and volume per void were obtained from metabolic cage studies as described above under Materials and Methods. Maximum micturition pressure and minimum residual urine volume were analyzed by videourodynamics studies of obstructed and control rabbits before sacrifice. Obstructed rabbits demonstrated voiding dysfunction and were classified as compensated or decompensated based on urinary bladder function as monitored in the cages. Obstructed bladders were unable to empty completely, resulting in mean residual urine of 50 ml for the decompensated and 20 ml for the compensated bladders (Figure 2A). Micturition pressure for the controls was around 6 to 9 cm of water, and it was increased for all obstructed bladders (Figure 2B, but the increase was greater in decompensated bladders as compared with compensated bladders (23 vs. 16 cm of water). Voiding frequency for rabbits with decompensated bladders was >28 per 24 hours (Figure 1).
Figure 2.
Effect of bladder obstruction on residual urine volume (A), micturition pressure (B), and bladder mass (C). Male rabbits grouped as control (N = 10), sham-operated (N = 12), compensated (N = 11), and decompensated (N = 12). Data are given as means + SEM.
Morphological Changes of Outlet Obstructed Bladder
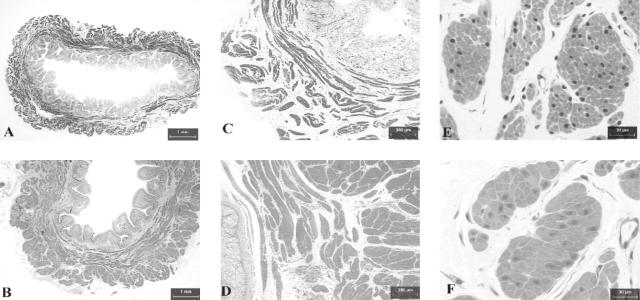
Comparison of control, sham, compensated, and the decompensated bladders revealed a three-to fivefold increase in bladder mass in response to outlet obstruction (Figure 2C), indicating bladder wall hypertrophy. Some decompensated bladders showed severe hypertrophy, weighing up to 16 g. Obstructed rabbits with severe urinary bladder dysfunction, despite the increase in bladder mass are classified as decompensated. Other obstructed bladders with hypertrophy at the termination of the experiment revealed urinary bladder function that was close to normal, and these rabbits were classified as compensated. The typical histological appearance of the wall of a decompensated bladder is depicted in Figure 3, A–F. Concomitant with the increased bladder mass following outlet obstruction, a twofold increase in bladder wall thickness was also observed (Figure 3, A and B). The total cross-sectional area of the emptied bladder was ∼77 mm2 in normal bladder and 141 mm2 in the decompensated bladder; detrusor smooth muscle accounted for ∼72% of the total increase in cross-sectional area of the decompensated bladder, thickened urothelium (mucosa) accounted for 22% and bladder cavity only 6% (Table 1).
Figure 3.
Photomicrographs of semithin (2–3 μm) cross-sections of normal (left panels) and obstructed (right panels) rabbit bladders. A and B: Cross-sections of the whole bladder photographed under a dissection microscope, showing the cavity, mucosa and detrusor of the bladder wall. C and D: Sections photographed under a light microscope with low-power objectives, showing smooth muscle bundles and their distribution pattern in the bladder wall. E and F: Sections photographed under a light microscope with high-power lens, showing the morphology of the smooth muscle cells. Magnifications are indicated by the bars in the figures.
Table 1.
Changes in Cross-Sectional Areas of Obstructed Bladder
| Normal bladder (mm2) | Obstructed bladder (mm2) | Net change (mm2) | |
|---|---|---|---|
| Total area | 77 | 141 | +64 |
| Detrusor area | 44 | 90 | +46 |
| Mucosa area | 20 | 34 | +14 |
| Cavity area | 13 | 17 | +4 |
Areas of an obstructed bladder (7.5 g) were compared to those in a normal bladder (2.1 g). Detrusor accounted for 72% of the total increase in cross-sectional area. Mucosa for 22% of the total increase, and cavity for only 6%.
The cross-section of the bladder body wall revealed many bundles of smooth muscle cells composing the detrusor (Figure 3, C and D). Two layers of these bundles in the cross-section of the bladder were discernable: an inner layer, composed primarily of longitudinal (circumferential to the bladder cavity) section of smooth muscle cells, and an outer layer (running longitudinally from the bladder dome to the base) composed of cross-sections of cells. As compared with normal bladder, the decompensated bladders showed much larger smooth muscle bundles and greatly reduced connective tissue between these bundles (Figure 3, C and D).
The cross-sectional area of the smooth muscle cells was also measured in cells chosen to include the nucleus (Figure 3, E and F). Analysis of these cells using Image Pro-Plus software indicated a mean (±SEM) 145.7 ± 13.4 μm2 and 55.1 ± 6.4 μm2 for smooth muscle cells of decompensated and normal bladders, respectively (Figure 4). Thus, the increase in smooth muscle cell size accounts for the increased thickness of the detrusor muscle layer in the bladder wall. Thus, a prominent response to partial obstruction of the urinary bladder outlet is the hypertrophy of the detrusor smooth muscle in the bladder wall.
RT-PCR Analysis of Caldesmon Isoforms in Bladder
Figure 5A shows the location of the PCR primers used to amplify the l- and h-CaD cDNA. Primers A and C amplify the cDNA for l-CaD, whereas primers B and C amplify the h-CaD region of the cDNA. As shown in Figure 5B, for RT-PCR analysis of the RNAs isolated from normal and obstructed bladders and from rabbit liver, primers A, B, and C amplified two fragments of the sizes expected for l-CaD (159 bp) and h-CaD (194 bp) in detrusor smooth muscle tissue from normal and obstructed rabbits (Figure 5, lanes 3 and 4). Sequence analysis confirmed the identity of each fragment (not shown). The cDNA amplified from RT-PCR of RNA from liver showed only the159-bp l-CaD fragment (Figure 5B, lane 2). RT-PCR analysis of liver RNA, used as a control, showed neither the smooth muscle-specific h-CaD nor α-actin.
Figure 5.
RT-PCR analysis of h-CaD and l-CaD from control and obstructed bladders. A: Location of primers A, B, and C in the CaD cDNA. Numbers refer to the rabbit l-CaD (GenBank accession no. L37147). The open reading frame is between nucleotides (nt) 230 to 1831, and the h-CaD-specific space region is inserted between nt 850 and 851. B: PCR products separated on a 2% agarose gel. Lane 1, 100 bp DNA ladder; lane 2, normal liver; lane 3, normal bladder; lane 4, obstructed bladder. Both l-CaD and h-CaD were expressed in normal and obstructed bladders. Neither α-actin nor h-CaD was expressed in liver tissue
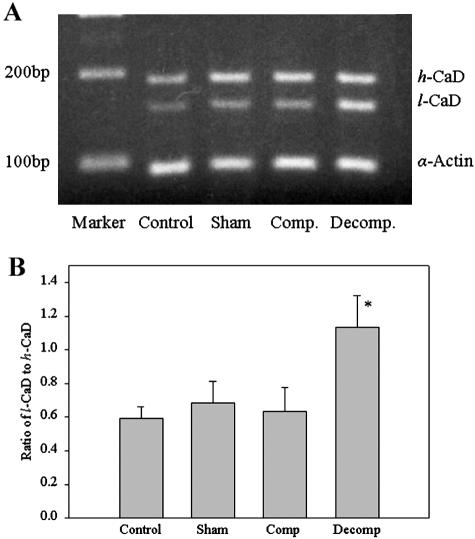
RT-PCR analysis of the mRNA extracted from the control, sham-operated, compensated, and decompensated bladders, using the mixture of primers A, B, and C, detected both h-CaD (Figure 6A) and l-CaD in all groups (Figure 6A). Imaging densitometry indicated a significantly higher (P < 0.001) l-CaD/h-CaD ratio in decompensated bladder as compared to any other group (Figure 6B).
Figure 6.
RT-PCR analysis of h-CaD and l-CaD in different bladder groups. A: PCR products separated on a 2% agarose gel. The high and low molecular size fragments representing the h- and l-CaD cDNA are shown. The α-actin was used as an internal control. B: Mean (+SEM) ratios of l-CaD to h-CaD from scanning densitometric analyses. * P < 0.05.
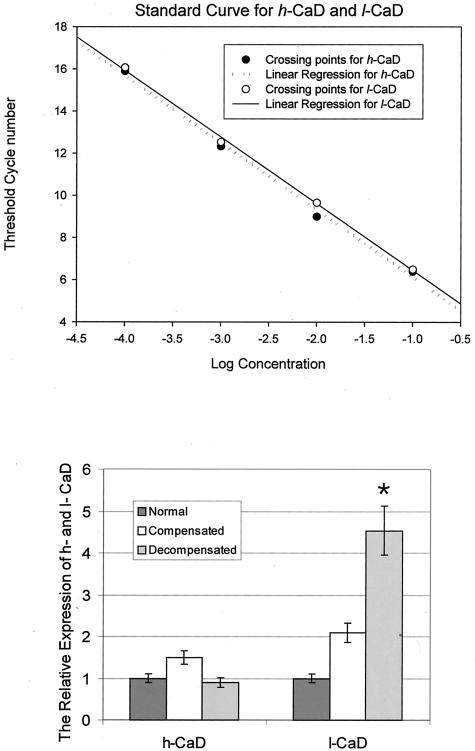
The relative expression of l- and h-CaD in the detrusor tissue from decompensated bladders was also determined by real-time PCR (Figure 7). The real-time PCR analysis also showed no difference between normal and decompensated bladders in the expression of h-CaD, but the expression of l-CaD was greatly increased, compared to that of normal and compensated. Compensated bladder showed a very slight increase in h-CaD. The l-CaD expression is increased compared to that of normal, but significantly less compared to that of decompensated.
Figure 7.
Real-time PCR analysis of the expression of h-CaD and l-CaD. The alteration of h-CaD and l-CaD in bladder smooth muscle from PBOO rabbits is assessed using quantitative real-time PCR. A: Standard curve for h-CaD and l-CaD obtained by amplifying cDNA samples containing known amount of target (open circle for l-CaD and closed circle for h-CaD). B: Relative expression level of h-CaD and l-CaD in PBOO bladder smooth muscle. There was no significant change of h-CaD in decompensated bladder, while l-CaD was greatly overexpressed.
Western Blot Analysis of Caldesmon Isoforms in Bladder
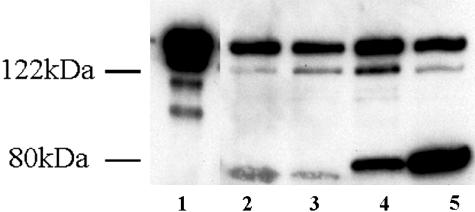
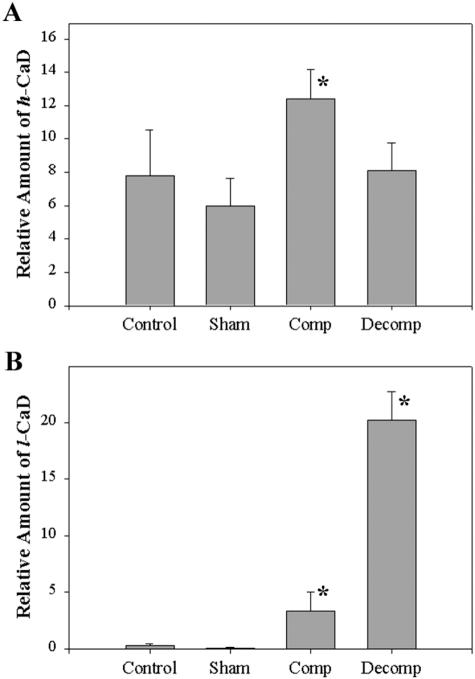
The Western blot and SDS-PAGE analyses of the protein extracted from control, sham, compensated, and decompensated bladders are shown in Figure 8, A and B. There was a very small amount of l-CaD in the normal and sham controls. Both compensated and decompensated bladders showed an increase in l-CaD, but the increase was remarkable in the detrusor from decompensated bladders, compared to the compensated bladders. Data obtained from Western blot analyses of the protein extracted from control, sham, compensated, and decompensated bladders are shown in Figure 9, A and B. h-CaD was expressed in smooth muscle tissues from all bladders but at significantly higher levels in compensated versus decompensated, sham, and normal bladders (P < 0.05) (Figure 9A). Expression of l-CaD was significantly higher (P < 0.05) in obstructed bladders (compensated and decompensated) than in the normal and sham groups, but the decompensated bladders showed a remarkable increase in l-CaD as compared with normal/sham controls and compensated (Figure 9B).
Figure 8.
Western blot analysis of h-CaD and l-CaD in different bladder groups. Western blots revealing h-CaD and l-CaD as detected by anti-caldesmon antibody. Lane 1, purified chicken gizzard h-CaD; lane 2, control bladder; lane 3, sham-operated bladder; lane 4, compensated bladder; lane 5, decompensated bladder. The small bands below the h-CaD band in well 1 are proteolytic fragments, exaggerated by overloading of the well by purified h-CaD.
Figure 9.
Relative amounts of h- and l-CaD in the extracts of detrusor smooth muscles from normal, sham, compensated, and decompensated bladders. Western blots were scanned using a scanning densitometer and the areas under the bands were determined. The loadings were adjusted to contain sufficient amounts of CaD for the absorption to fall within the linear portion of the standard curve of protein concentration versus absorption in the Western blots using varying concentrations of pure CaD. Relative amounts of h-CaD and l-CaD were calculated as means + SEM. *, P < 0.05.
Immunolocalization of Caldesmon
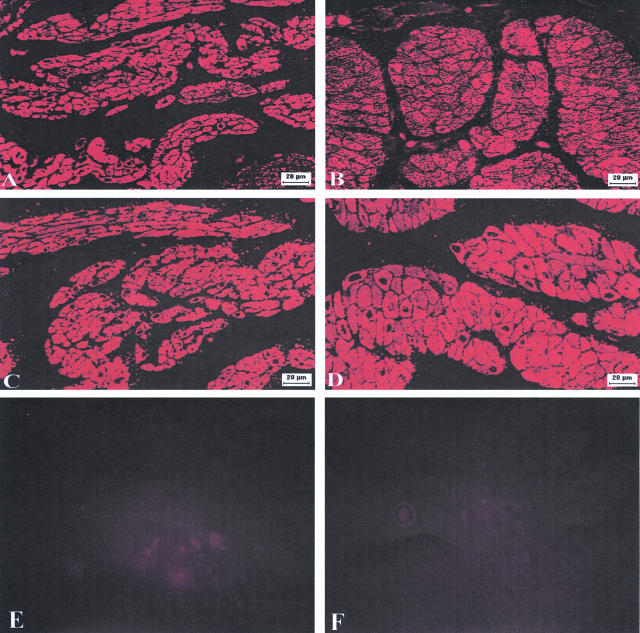
The anti-CaD antibody coupled with the cy3-conjugated anti-mouse IgG second antibody revealed intense fluorescence in the smooth muscle cells on plastic sections of normal and obstructed rabbit bladders (Figure 10, A and B). This immunolocalization pattern was similar when immunostained against smooth muscle-specific α-actin (Figure 10, C and D). Hypertrophy was obvious in the obstructed bladders (Figure 10, B and D). The CaD antibody, which detected both l-CaD and h-CaD in Western blotting, reacted intensely with smooth muscle.
Figure 10.
Immunolocalization of CaD and α-actin in control and obstructed bladders. Semithin (3 μm) cross-sections were prepared from normal and obstructed bladders and probed by indirect immunofluorescence using anti-caldesmon, anti-α actin antibodies (1:250), and CY3-conjugated anti-mouse IgG. Photographs were obtained under a fluorescence microscope. The smooth muscle layers from normal (A) and decompensated (B) bladders reacted with anti-caldesmon antibody. Adjacent sections from both bladders were reacted with anti-actin antibody (C, normal bladder and D, decompensated bladder). Notice that the immunostaining of the muscle bundles using α-actin and CaD antibodies are similar. E and F are negative controls for CaD and α-actin, respectively, carried out on adjacent sections from decompensated bladder, treated similar to A–D except that the anti-CaD and anti-α-actin antibodies were replaced by normal mouse serum. Magnifications are shown by the bars in the photographs.
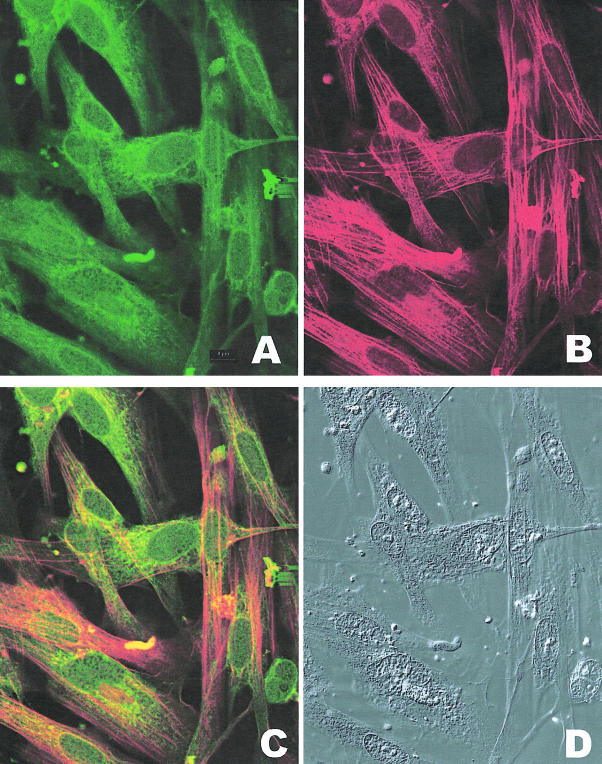
For better visualization of the myocytes and their co-localization of contractile proteins and caldesmon, detrusor myocytes from decompensated bladders were dissociated overnight by collagenase treatment (0.1 mg/ml highly purified collagenase from GIBCO BRL). Liberated cells were collected by centrifugation (15 minutes at 3000 rpm at 4°C) and cultured overnight on collagen-coated coverslips (1 mg/ml rat tail collagen; Sigma) placed in 60-mm culture dishes. Cultures were fed with nutrient medium (M199 supplemented with 10% fetal calf serum and 1% antibiotic-antimycotic) containing 15 mmol/L thymidine to inhibit DNA synthesis and cell division. Cells were fixed in 4% buffered formalin and processed. Cultures were immunostained with antibody against caldesmon for immunofluorescence microscopy (Figure 11A, FITC) and anti-smooth muscle myosin antibody (Figure 11B, Texas Red). The combined fluorescence shown in Figure 11C reveals co-localization of caldesmon and myosin in cytoplasmic fibrils. An overabundance of caldesmon antibody staining is seen around the nucleus. The same field, taken under differential interference optics is shown in Figure 11D.
Figure 11.
Co-localization of smooth muscle myosin and caldesmon in bladder myocytes from decompensated bladder. A: Immunostaining of myocytes dissociated from bladder wall smooth muscle reacted with FITC-conjugated antibody specific to caldesmon. B: Immunostaining of myocytes dissociated from bladder wall smooth muscle reacted with Texas Red-conjugated antibody specific to smooth muscle myosin. C: Combined fluorescence showing co-localization of myosin and caldesmon antibodies in bladder myocytes and cytoplasmic fibrils D: Photographs of the cells shown in A, B, and C taken under differential interference contrast. Notice that the cytoplasmic fibrils in the myocytes react with smooth muscle-specific myosin and caldesmon. There is a large amount of immunostaining with caldesmon antibody in the area around the nuclei.
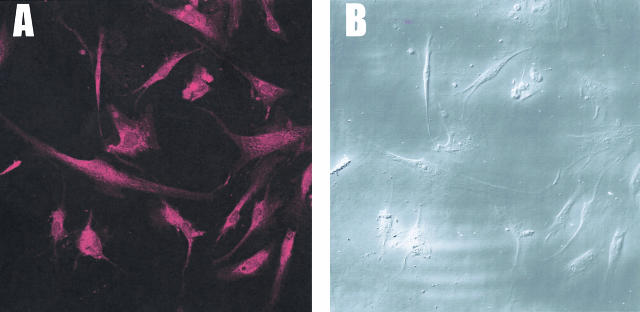
Cells dissociated from decompensated bladders were treated with unlabeled antibody against the C-terminal end of CaD to block the antigenic sites in the C-terminal regions. This was followed by immunostaining with antibody specific to h-CaD labeled with Texas Red (Figure 12A). Since the h-CaD antibody we used reacts specifically to high molecular weight CaD, the intense immunostaining of all of the cells in the field shown under differential interference optics (Figure 12B) indicate that all of the myocytes contain smooth muscle-specific h-CaD, although they overexpress l-CaD (Figure 10).
Figure 12.
Specific immunostaining of h-CaD in bladder myocytes dissociated from decompensated bladder. A: Myocytes were treated with unlabeled antibody against the C-terminal region of CaD before immunoreaction with Texas red labeled h-CaD-specific antibody. B: Bladder myocytes in the same field as A, shown under differential interference contrast. Notice that the majority of the cells dissociated from the detrusor smooth muscle from decompensated bladder stains positive for h-CaD, which is smooth muscle-specific, indicating the differentiated state of the myocytes in the detrusor.
Discussion
Smooth muscle layers in the wall of a viscous organ, such as the urinary bladder, undergo hypertrophy in response to obstruction. In partial outlet obstruction, a condition that is common in men with benign prostatic hyperplasia, the detrusor smooth muscle must increase force to overcome the obstruction of normal urine flow. Using a rabbit model for partial outlet obstruction, we demonstrate smooth muscle remodeling characterized by hypertrophy of the smooth muscle layers, urinary bladder dysfunction, and overexpression of a non-muscle isoform of caldesmon.
In some rabbits with obstructed bladders, hypertrophy of the smooth muscle compensated for the requirement to produce more force than normal to empty the bladder during micturition, whereas other obstructed rabbits continued to present contractile dysfunction, leading to increased frequency of urination, elevated intravesical pressure, and high residual urine volume. Such functional decompensation was observed despite the hypertrophy evidenced by the increased cross-sectional diameter of the cells and increased bladder mass (Figures 3 and 4). The increase in bladder mass associated with obstruction might result from either hyperplasia and/or hypertrophy. Our morphological analysis of semithin sections of the detrusor smooth muscle layers and measurements of the cross-sectional area of the myocytes demonstrated a two- to threefold increase in the diameter of the myocytes (Figure 4). Mitotic figures were absent in the detrusor smooth muscle layer hypertrophying bladder, in agreement with a previous study showing incorporation of 3H-thymidine only into urothelium and interstitial fibroblasts, but not into smooth muscle cells following obstruction.32 However, proliferation of myocytes in the early stages of detrusor smooth muscle remodeling following obstruction, or the differentiation and recruitment of interstitial mesenchymal cells into the smooth muscle bundle cannot be ruled out.
Several studies have reported the alteration in contractile proteins of the detrusor following outlet obstruction.11,33–35 In the present study, we analyzed the expression of the caldesmon isoforms h- and l-CaD, which are associated with thin filaments in smooth muscle and microfilaments in non-muscle cells, respectively. One function of CaD is the induction of side-to side aggregation of actin filaments into bundles,28,29,36 which are localized in the structures such as cytoskeleton and stress fibers.14,15,28 The detrusor smooth muscle tissue used for the biochemical analysis is devoid of the urothelium and serosal layer. Since fibroblasts are present in the interstitial connective tissue, a part of the overexpressed l-CaD in the hypertrophied detrusor may be from these cells. However, we found no increase in the interstitial connective tissue in the hypertrophied detrusor when compared with sham and normal controls. Immunofluorescence microscopy using antibody against caldesmon shows localization in the smooth muscle cells in the same pattern as it does with antibody against α-actin. Co-localization of caldesmon and smooth muscle-specific myosin to the cytoplasmic fibrils in myocytes from decompensated bladder (Figure 11) indicate that a large portion of the overexpressed l-CaD in the hypertrophied detrusor is derived from smooth muscle cells. Increased amounts of l-CaD, the non-muscle isoform of caldesmon may indicate a modulation of the myocytes to a “less differentiated” state. However, immunostaining of the cells dissociated from detrusor from decompensated bladder showed that these cells reacted both with antibody specific to smooth muscle myosin and to h-CaD (Figures 11 and 12) and the immunostaining in tissue sections was similar to α-actin and CaD (Figure 10). Thus, with respect to myosin and α-actin, these cells are fully differentiated.
It is likely that the overexpressed l-CaD may be associated with the remodeling of cytoskeletal structure in myocytes. It is also possible that the overexpressed l-CaD displaces h-CaD from the thin filaments and that thin filaments containing l-CaD might interfere with the generation and/or the maintenance of the additional force required to compensate for the outlet obstruction. In that case, overexpression of l-CaD would account for the contractile dysfunction of the smooth muscle and decompensation of these bladders. While h-CaD inhibits the in vitro motility of actin filaments over the myosin heads.16,22,23 l-CaD has been shown to inhibit cell motility and formation of focal adhesion in cultured non-muscle cells.30 Further experiments with reconstituted proteins and intact muscle overexpressing l-CaD are needed to test this possibility.
The compensated rabbit bladder also showed a slight increase in l-CaD and in h-CaD levels relative to normal and decompensated bladders. It is possible that the excess amount of h-CaD prevents its replacement with the l-CaD in the thin filaments and the alteration of contractile characteristics. It is also likely that the smooth muscle cells in the compensated bladder have excess amounts of thin filaments or the same amounts of thin filaments containing more h-CaD than the smooth muscle in the decompensated and normal bladders. Our previous study37 indicating slightly more γ-actin in hypertrophied urinary bladders suggests the likelihood that more thin filaments are present in hypertrophied smooth muscle and that the actin:h-CaD molar ratio is unchanged in smooth muscle of the compensated bladder.
Smooth muscle remodeling induced by bladder outlet obstruction may develop through two related processes, one which involves compensating bladder contractility by increasing h-CaD and one involving an increase in l-CaD production and, in turn, actin bundling associated with cytoskeleton21,28,36 to resist the high intravesical pressure during micturition. Compensated bladders show increased expression of both l- and h-CaD, whereas decompensated bladders show overexpression of l-CaD but very little change in h-CaD as compared to controls. Thus, although the role of overexpressed l-CaD in smooth muscle contractile dysfunction and decompensation of the bladder in partial outlet obstruction is not clear, the level of caldesmon expression and the h-CaD:l-CaD ratio may provide a rather precise index for the status of bladder remodeling and dysfunction. It will be interesting to determine whether smooth muscle in other viscous organs behave similar in hypertrophy associated with obstruction.
Acknowledgments
We thank Ms. Marina Hoffman for editorial assistance, Mr. Brian Siano for the photographic production, and our colleagues in the Division of Urology for helpful suggestions and critiques.
Footnotes
Address reprint requests to Dr. Samuel Chacko, Department of Pathobiology and Division of Urology, University of Pennsylvania, 3800 Spruce St., Philadelphia, PA 19104. E-mail: chackosk@mail.med.upenn.edu.
Supported by George O’Brien Urology Research Center grants P50 (DK52620) and T-32 (DK07708).
References
- Levin RM, Longhurst PA, Monson FC, Kato K, Wein AJ. Effect of bladder outlet obstruction on the morphology, physiology, and pharmacology of the bladder. Prostate (Suppl) 1990;3:9–26. doi: 10.1002/pros.2990170503. [DOI] [PubMed] [Google Scholar]
- Mostwin JL, Karim OMA, VanKoeveringe G, Brooks EL. The guinea pig as a model of gradual urethral obstruction. J Urol. 1991;145:854–858. doi: 10.1016/s0022-5347(17)38477-x. [DOI] [PubMed] [Google Scholar]
- Elbadawi A. Functional anatomy of the organs of micturition. Urol Clin N Am. 1996;23:177–210. doi: 10.1016/s0094-0143(05)70304-9. [DOI] [PubMed] [Google Scholar]
- Levin RM, Malkowicz SB, Wein AJ, Atta MA, Elbadawi A. Recovery from short-term obstruction of the rabbit urinary bladder. J Urol. 1985;134:388–390. doi: 10.1016/s0022-5347(17)47183-7. [DOI] [PubMed] [Google Scholar]
- Buttyan R, Chen MW, Levin RM. Animal models of bladder outlet obstruction and molecular insights into the basis for the development of bladder dysfunction. Eur Urol. 1997;32(Suppl 1):32–39. [PubMed] [Google Scholar]
- Stein R, Gong C, Hutcheson JC, Canning DA, Zderic SA. The decompensated detrusor. III: impact of bladder outlet obstruction on sarcoplasmic endoplasmic reticulum protein and gene expression. J Urol. 2000;164:1026–1030. doi: 10.1097/00005392-200009020-00026. [DOI] [PubMed] [Google Scholar]
- Kato K, Monson FC, Longhurst PA, Wein AJ, Haugaard N, Levin RM. The functional effects of long-term outlet obstruction on the rabbit urinary bladder. J Urol. 1990;143:600–606. doi: 10.1016/s0022-5347(17)40038-3. [DOI] [PubMed] [Google Scholar]
- Wein AJ. Bladder outlet obstruction—an overview. Adv Exp Med Biol. 1995;385:3–5. doi: 10.1007/978-1-4899-1585-6_2. [DOI] [PubMed] [Google Scholar]
- Stein R, Hutcheson JC, Krasnopolsky L, Canning DA, Carr MC, Zderic SA. The decompensated detrusor. V: molecular correlates of bladder function after reversal of experimental outlet obstruction. J Urol. 2001;166:651–657. doi: 10.1016/s0022-5347(05)66037-5. [DOI] [PubMed] [Google Scholar]
- Marston SB, Redwood CS. The molecular anatomy of caldesmon. Biochem J. 1991;279:1–16. doi: 10.1042/bj2790001. [DOI] [PMC free article] [PubMed] [Google Scholar]
- Chacko S, DiSanto M, Menon C, Zheng Y, Hypolite J, Wein AJ. Contractile protein changes in urinary bladder smooth muscle following outlet obstruction. Adv Exp Med Biol. 1999;462:137–153. doi: 10.1007/978-1-4615-4737-2_11. [DOI] [PubMed] [Google Scholar]
- Bryan J, Imai M, Lee R, Moore P, Cook RG, Lin WG. Cloning and expression of a smooth muscle caldesmon. J Biol Chem. 1989;264:13873–13879. [PubMed] [Google Scholar]
- Sobue K, Muramoto Y, Fujita M, Kakiuchi S. Purification of a calmodulin-binding protein from chicken gizzard that interacts with F-actin. Proc Natl Acad Sci USA. 1981;78:5652–5655. doi: 10.1073/pnas.78.9.5652. [DOI] [PMC free article] [PubMed] [Google Scholar]
- Mabuchi K, Wang CL. Electron microscopic studies of chicken gizzard caldesmon and its complex with calmodulin. J Muscle Res Cell Motil. 1991;12:145–151. doi: 10.1007/BF01774033. [DOI] [PubMed] [Google Scholar]
- Marston SB, Lehman W. Caldesmon is a Ca2+-regulatory component of native smooth-muscle thin filaments. Biochem J. 1985;231:517–522. doi: 10.1042/bj2310517. [DOI] [PMC free article] [PubMed] [Google Scholar]
- Horiuchi KY, Chacko S. Caldesmon inhibits the cooperative turning-on of the smooth muscle heavy meromyosin by tropomyosin-actin. Biochemistry. 1989;28:9111–9116. doi: 10.1021/bi00449a023. [DOI] [PubMed] [Google Scholar]
- Chalovich JM, Sen A, Resetar A, Leinweber B, Fredricksen RS, Lu F, Chen YD. Caldesmon: binding to actin and myosin and effects on elementary steps in the ATPase cycle. Acta Physiol Scand. 1998;164:427–435. doi: 10.1046/j.1365-201X.1998.00449.x. [DOI] [PubMed] [Google Scholar]
- Bartegi A, Fattoum A, Kassab R. Cross-linking of smooth muscle caldesmon to the NH2-terminal region of skeletal F-actin. J Biol Chem. 1990;265:2231–2237. [PubMed] [Google Scholar]
- Zhuang S, Wang E, Wang CL. Identification of the functionally relevant calmodulin binding site in smooth muscle caldesmon. J Biol Chem. 1995;270:19964–19968. doi: 10.1074/jbc.270.34.19964. [DOI] [PubMed] [Google Scholar]
- Wang Z, Chacko S. Mutagenesis analysis of functionally important domains within the C-terminal end of smooth muscle caldesmon. J Biol Chem. 1996;271:25707–25714. doi: 10.1074/jbc.271.41.25707. [DOI] [PubMed] [Google Scholar]
- Sobue K, Takahashi K, Wakabayashi I. Caldesmon150 regulates the tropomyosin-enhanced actin-myosin interaction in gizzard smooth muscle. Biochem Biophys Res Commun. 1985;132:645–651. doi: 10.1016/0006-291x(85)91181-7. [DOI] [PubMed] [Google Scholar]
- Shirinsky VP, Biryukov KG, Hettasch JM, Sellers JR. Inhibition of the relative movement of actin and myosin by caldesmon and calponin. J Biol Chem. 1992;267:15886–15892. [PubMed] [Google Scholar]
- Horiuchi KY, Chacko S. Effect of unphosphorylated smooth muscle myosin on caldesmon- mediated regulation of actin filament velocity. J Muscle Res Cell Motil. 1995;16:11–19. doi: 10.1007/BF00125306. [DOI] [PubMed] [Google Scholar]
- Wang Z, Yang ZQ, Chacko S. Functional and structural relationship between the calmodulin-binding, actin-binding, and actomyosin-ATPase inhibitory domains on the C terminus of smooth muscle caldesmon. J Biol Chem. 1997;272:16896–16903. doi: 10.1074/jbc.272.27.16896. [DOI] [PubMed] [Google Scholar]
- Lee YH, Gallant C, Guo H, Li Y, Wang CA, Morgan KG. Regulation of vascular smooth muscle tone by N-terminal region of caldesmon. Possible role of tethering actin to myosin. J Biol Chem. 2000;275:3213–3220. doi: 10.1074/jbc.275.5.3213. [DOI] [PubMed] [Google Scholar]
- Earley JJ, Su X, Moreland RS. Caldesmon inhibits active crossbridges in unstimulated vascular smooth muscle: an antisense oligodeoxynucleotide approach. Circ Res. 1998;83:661–667. doi: 10.1161/01.res.83.6.661. [DOI] [PubMed] [Google Scholar]
- Gerthoffer WT, Yamboliev IA, Shearer M, Pohl J, Haynes R, Dang S, Sato K, Sellers JR. Activation of MAP kinases and phosphorylation of caldesmon in canine colonic smooth muscle. J Physiol. 1996;495:597–609. doi: 10.1113/jphysiol.1996.sp021619. [DOI] [PMC free article] [PubMed] [Google Scholar]
- Dabrowska R, Goch A, Galazkiewicz B, Osinska H. The influence of caldesmon on ATPase activity of the skeletal muscle actomyosin and bundling of actin filaments. Biochim Biophys Acta. 1985;842:70–75. doi: 10.1016/0304-4165(85)90295-8. [DOI] [PubMed] [Google Scholar]
- Lin JJ, Davis-Nanthakumar EJ, Jin JP, Lourim D, Novy RE, Lin JL. Epitope mapping of monoclonal antibodies against caldesmon and their effects on the binding of caldesmon to Ca++/calmodulin and to actin or actin-tropomyosin filaments. Cell Motil Cytoskeleton. 1991;20:95–108. doi: 10.1002/cm.970200203. [DOI] [PubMed] [Google Scholar]
- Helfman DM, Levy ET, Berthier C, Shtutman M, Riveline D, Grosheva I, Lachish-Zalait A, Elbaum M, Bershadsky AD. Caldesmon inhibits nonmuscle cell contractility and interferes with the formation of focal adhesions. Mol Biol Cell. 1999;10:3097–3112. doi: 10.1091/mbc.10.10.3097. [DOI] [PMC free article] [PubMed] [Google Scholar]
- Malkowicz SB, Wein AJ, Elbadawi A, Van Arsdalen K, Ruggieri MR, Levin RM. Acute biochemical and functional alterations in the partially obstructed rabbit urinary bladder. J Urol. 1986;136:1324–1329. doi: 10.1016/s0022-5347(17)45331-6. [DOI] [PubMed] [Google Scholar]
- Monson FC, Sun L, Wein AJ, Levin RM. Hyperplasia in the rabbit bladder urothelium following partial outlet obstruction: autoradiographic evidence. Mol Cell Biochem. 1995;152:167–173. doi: 10.1007/BF01076079. [DOI] [PubMed] [Google Scholar]
- Burkhard FC, Lemack GE, Zimmern PE, Lin VK, McConnell JD. Contractile protein expression in bladder smooth muscle is a marker of phenotypic modulation after outlet obstruction in the rabbit model. J Urol. 2001;165:963–967. [PubMed] [Google Scholar]
- Malmqvist U, Arner A, Uvelius B. Contractile and cytoskeletal proteins in smooth muscle during hypertrophy and its reversal. Am J Physiol. 1991;260:C1085–C1093. doi: 10.1152/ajpcell.1991.260.5.C1085. [DOI] [PubMed] [Google Scholar]
- Wang ZE, Gopalakurup SK, Levin RM, Chacko S. Expression of smooth muscle myosin isoforms in urinary bladder smooth muscle during hypertrophy and regression. Lab Invest. 1995;73:244–251. [PubMed] [Google Scholar]
- Yamashiro-Matsumura S, Matsumura F. Characterization of 83-kilodalton nonmuscle caldesmon from cultured rat cells: stimulation of actin binding of nonmuscle tropomyosin and periodic localization along microfilaments like tropomyosin. J Cell Biol. 1988;106:1973–1983. doi: 10.1083/jcb.106.6.1973. [DOI] [PMC free article] [PubMed] [Google Scholar]
- Kim YS, Wang Z, Levin RM, Chacko S. Alterations in the expression of the beta-cytoplasmic and the gamma-smooth muscle actins in hypertrophied urinary bladder smooth muscle. Mol Cell Biochem. 1994;131:115–124. doi: 10.1007/BF00925947. [DOI] [PubMed] [Google Scholar]


