Abstract
Alcohol consumption is a risk factor for chronic pancreatitis (CP), but the mechanism in humans remains obscure because prolonged alcohol consumption in most humans and animal models fails to produce alcoholic chronic pancreatitis (ACP). We hypothesize that the process leading to ACP is triggered by a sentinel acute pancreatitis (AP) event; this event causes recruitment of inflammatory cells, which initiates fibrosis driven by the anti-inflammatory response to recurrent AP and/or chronic oxidative stress. The aim was to determine whether chronic alcohol consumption accelerates fibrosis in response to cerulein-induced pancreatitis in the rat. Wistar male rats were pair-fed control (C) or 5% ethanol (E) Lieber-DeCarli liquid diets. Animals were studied without pancreatitis (P0), with cerulein pancreatitis induced once (P1), or with cerulein-induced pancreatitis weekly for 3 weeks (P3). AP markers, inflammation, and fibrosis were measured histologically, by gene expression profiling and protein expression. Macrophage infiltration was reduced in EP0 versus CP0 rats, but the pattern was reversed after AP. Microabscess, severe necrosis, and early calcification were only induced in the EP3 rats. Fibrosis was significantly induced in the EP3 rats versus EP1, CP1, and CP3 by histology, hydroxyproline content, and mRNA expression for collagen α1(1) and procollagen α2(1). Proinflammatory cytokine mRNAs were up-regulated shortly after induction of AP, while the anti-inflammatory cytokines (interleukin-10 and transforming growth factor-β) were strongly up-regulated later and in parallel with fibrogenesis, especially in the EP3 rats. Pancreatic fibrosis develops after repeated episodes of AP and is potentiated by alcohol. Expression of fibrosis-associated genes was associated with expression of anti-inflammatory cytokines in alcohol-fed rats.
Chronic alcohol consumption is a risk factor for chronic pancreatitis (CP) and is reported to be associated with CP in 50 to 70% of patients.1 Chronic alcohol consumption alone does not cause alcoholic chronic pancreatitis (ACP) because a small minority of heavy, chronic alcohol drinkers develop clinically recognized CP.2 The mechanisms linking alcohol consumption to CP are complex and poorly understood, especially because sufficient animal models were previously not available.3 The fundamental pathological alterations seen in ACP include inflammation and fibrosis with progressive loss of normal parenchyma.1 Several pathogenic and mechanistic hypotheses for the origin of ACP have been proposed,1,4–7 but remain either unproven or inadequate in explaining the clinical features.
Recurrent acute pancreatitis (RAP) appears to precede the development of CP in some humans.8 In chronic alcoholics with CP, approximately two-thirds previously developed RAP 1 to 19 years before development of pancreatic calcification and fibrosis.9,10 The most compelling clinical evidence that RAP leads to CP comes from patients with hereditary pancreatitis who often have gain-of-function mutations in the cationic trypsin gene (PRSS1).11,12 Loss of trypsin regulation leads to acute pancreatitis (AP), RAP, and finally to CP with all of the pathological features of ACP.
Histological examination of pancreatic tissue from patients with CP reveals inflammatory cells and extensive fibrosis. We hypothesize that the process causing a chronic alcoholic individual to begin to develop CP requires an initiating factor such as an attack of AP to recruit inflammatory cells, especially monocytes/macrophages, which then provide the cytokine signals to direct the subsequent inflammatory and healing (scarring) responses, including regulation of pancreatic stellate cells (PSCs).13 Together, these resident inflammatory cells are likely to play key roles in driving fibrosis and causing the development of CP in both humans and experimental animals.3,14–18
In previous experimental animal studies, chronic alcohol exposure at very high ethanol doses induced minimal morphological changes typically seen in ACP patients.19–21 Even though CP does not develop in alcohol-fed rats, ultrastructure studies have shown significant mitochondrial damage22 while biochemical analysis has demonstrated ongoing metabolic and oxidative stress. The metabolic stress is likely aggravated by exocrine hypersecretion in response to food and exogenous CCK stimulation seen in animals chronically fed alcohol.23,24 Rats that are chronically fed alcohol have an increased sensitivity to AP induced by CCK.25 Cerulein, an amphibian peptide that acts on the CCK receptors, is widely used to elicit AP by hyperstimulation of exocrine pancreas in rats and mice. The pancreatitis induced by cerulein is characterized by edema, increased serum levels of pancreatic enzymes, inflammation, and in some cases, necrosis.20 A potential link between AP and CP, which is characterized in part by fibrosis, has been seen in mice with repeated administration of cerulein plus infusion of transforming growth factor (TGF)-β.26
Based on the above observations, we hypothesize that development of CP requires 1) susceptibility factors for AP; 2) an initiating factor to activate the immune system, and 3) progression factors that drive the pro- and anti-inflammatory systems toward acinar cell destruction and fibrosis. Alcohol could act as factors 1 and 3, but this model would require initiating factors such as AP. Although genetic factors could also play roles such as susceptibility or modifying factors, the fundamental role of alcohol in this process must be demonstrated. Therefore, series of experiments were designed to test the role of alcohol in an animal model of RAP.
Materials and Methods
Animals
All animal protocols were approved by the University of Pittsburgh’s Institutional Animal Care and Use Committee and the Institutional Animal Care and Use Committee of the VA Medical Center of Pittsburgh. All rats were housed individually in hanging wire cages. The animal room was maintained at 22 to 23°C with lights on from 7 a.m. to 7 p.m.
Animal Models
Alcohol Models
Male Wistar rats (Harlan Sprague-Dawley, Indianapolis, IN) weighing 200 to 225 g at the beginning of the experiment were allowed to acclimate to the new environment for 1 week with free access to laboratory rat chow (RMH3000; Prolab, St. Louis, MO) and tap water. After 1 week, rats were paired by matching body weights and then fed either an isocaloric control or ethanol-containing liquid diet. The control diet provides 0% and ethanol diet provides 36% of total calories (6.375% v/v) from ethanol, as previously described by Lieber and DeCarli.27 The ethanol concentration was gradually increased from 0 to 36% of total calories during the first 9 days and the full dose alcohol and control diets were maintained throughout the entire experimental period.
Pilot Study (Time Course of Cerulein-Pancreatitis in Control Diet-Fed Rats)
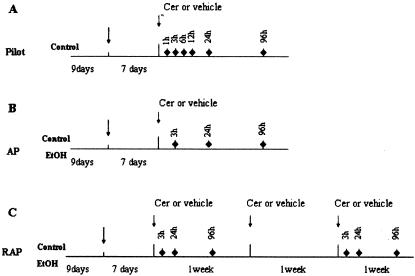
The duration of alcohol feeding needed for rats to adapt physiologically was investigated. Most changes were present by 7 days of full dose of alcohol feeding.28 To determine an effective time interval for repeated cerulein administration, we studied control-fed rats with a single episode of pancreatitis. After 2 weeks of control liquid diet feeding, rats were given cerulein treatments to induce pancreatitis (Figure 1). Pancreatitis was induced by four hourly intraperitoneal injections of cerulein at the dose of 20 μg/kg after an overnight fast. Saline injection under the same condition served as a vehicle control. Rats were then sacrificed at 1, 3, 6, 12, 24, 48, and 96 hours after the last injection by an overdose of Nembutal. Blood was collected for measuring serum amylase and ethanol concentration (Sigma Diagnostic alcohol kit, catalogue number 332-B; Sigma, St. Louis, MO), the pancreas was quickly removed, and the wet pancreas weight was measured. A small piece of pancreas was embedded in OCT for morphological studies. The rest was snap-frozen in liquid nitrogen and stored at −80°C for RNA and protein extraction.
Figure 1.
Time frame of experimental design. Nine days, ramp time for gradually increasing ethanol concentration in ethanol diet-fed group. Cer, cerulein. ♦, Selected sacrifice time for that group of rats.
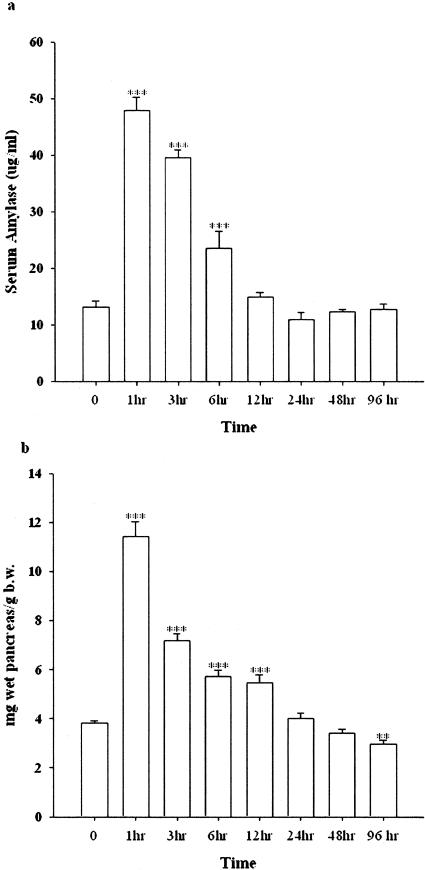
Peritoneal administration of cerulein at the dose of 20 μg/kg hourly for 4 hours in the control-fed rats elicited a typical experimental AP. The serum amylase increased as early as 1 hour, and persistently increased at 3 and 6 hours after the final injection. The edema was also developed at 1 hour after the final injection and paralleled the increment of serum amylase (Figure 2a). Quantitatively, the ratio of pancreas wet weight per body weight was significantly increased at the time points of 1, 3, 6, and 12 hours after the last injection as compared to the vehicle-treated rats (Figure 2b). The inflammatory cells, including neutrophils, macrophages, and lymphocytes, began to migrate into the pancreatic parenchyma 3 hours after the final injection (data not shown). At 24 hours, numerous infiltrating cells were already observed in the parenchyma followed by a gradual decline. Therefore, the measurements in subsequent experiments were done at 3, 24, and 96 hours after the final injection of cerulein.
Figure 2.
The alteration of serum amylase and pancreas wet weight versus body weight induced by cerulein in control-fed rats (pilot study). a: Alteration of serum amylase. b: Pancreas wet weight versus body weight. **, P < 0.01; ***, P < 0.001, as compared to the values in the vehicle group.
Experimental Protocols
One Episode of Cerulein Pancreatitis (P1)
One week after alcohol-fed rats began to receive a full dose (36%) of ethanol in their diet, cerulein or saline was administered in these pair-fed rats (control/alcohol) as described above. Rats were sacrificed at 3, 24, and 96 hours after the final injection based on the results of the pilot studies (Figure 1B).
Recurrent Acute Pancreatitis (P3)
Rats received the same protocol for cerulein or saline treatment used for P1 except that it was given weekly for 3 weeks. Rats were sacrificed at the same time points after the last cerulein injections as in P1 (Figure 1C).
Evaluation of Pancreatitis
The liquid diet intake was monitored daily and the body weight gain throughout the experimental period was measured weekly. The severity of pancreatitis was determined using multiple parameters. Edema was measured by comparing the ratio of the wet weight of the pancreas to rat body weight. The serum amylase levels were measured by the method of Jung.29 Blood ethanol concentration was measured by using the analyzing kit from Sigma (catalog no: 332B). Histology was done on frozen pancreas samples after they were embedded in the OCT, and sectioned at 10 μm at −20°C. Tissue sections were fixed in 10% formalin and stained with hematoxylin and eosin stain. The inflammatory cell infiltration was determined by MPO (myeloperoxidase) stain in whole mount pancreas as previously described,30 and further characterized by ED2 immunohistochemical stain (1:100; Serotec, Raleigh, NC) and immunoblotting. Collagen deposits in the pancreas were visualized after Gomory’s one-step Trichrome stains (Catalog no. HT10-5-16, Sigma) and Sirius Red stain. The quantitative measurement of hydroxyproline in the pancreas was also performed by using the method of Woëssner.31 To observe the correlation between collagen deposition and inflammatory cells, immunohistochemical detection of α-smooth muscle cell actin (α-SMA, marker of PSCs and myofibroblasts, α-SMA 1:50; DAKO, Carpinteria, CA) or desmin-positive cells (1:100; Santa Cruz Biotechnology, Santa Cruz, CA) as well as immunoblotting were performed. The immunohistochemical stain was performed according to the manufacture’s instructions. The visualization of the immunological reactions were performed by using the Vector VIP kit for HRP or Vector Blue kit for ALP (Vector Laboratories, Burlingame, CA). Normal horse/donkey IgG was used as a negative control. Some slides were slightly counterstained with methyl green.
Western Blot Analysis
Based on the morphological studies from the pilot experiments, fibrosis was most evident at 96 hours after the last injection of cerulein, and therefore, protein measurements were performed at this time point. Protein was extracted from the pancreas after RNA extraction using Tri reagent (Sigma). The concentration of the purified proteins was measured by using the protein quantification kit (Bio-Rad Inc., Richmond, CA) based on the method of Lowry and colleagues.32 Five μg of protein from each sample was then separated by 7.5, 10.0, or 12.5% sodium dodecyl sulfate-polyacrylamide gel electrophoresis at 120 V using minicell gel apparatus (Bio-Rad Inc.). The separated proteins were then electrophoretically transferred to polyvinylidene difluoride membrane (Immobilon P; Millipore, Bedford, MA) for 30 minutes at 10 V using the semidry transfer module from Bio-Rad Inc. Nonspecific binding was blocked by a 2-hour incubation of the blot in 5% nonfat dry milk in Tris-buffered saline (TBS, pH 7.5). Blots were then incubated overnight with the primary antibodies at 4°C in antibody buffer containing 5% nonfat dry milk in TBST (0.05% v/v Tween 20 in TBS), washed three times with TBST, then incubated for 1 hour with a peroxidase-conjugated secondary antibody in the antibody buffer. After washing, the blots were developed for visualization using an enhanced chemiluminescence detection kit (ECL Western detection system; Amersham, Arlington Heights, IL). The primary antibodies and their titers were as follows: ED 1, 1:500, and ED 2, 1:800, (Serotec Ltd., Kidlington, Oxford, UK) and α-SMA, 1:200 (DAKO).
Determination of Hydroxyproline Level in Pancreas
The content of hydroxyproline in the pancreata were measured according to the method of Woëssner.31 The level of the hydroxyproline was calculated by using a standard curve from the pure l-hydroxyproline (Sigma) and expressed as ng hydroxyproline per 1 μg of total pancreatic protein.
Gene Expression Profile of Pro- and Anti-Inflammatory Cytokines, Extracellular Matrix Markers
RNA Extraction
Immediately after rats were sacrificed, total RNA was isolated from pancreas using Tri reagent (Sigma). The extracted RNA was then digested with RNase-free DNase I (Promega, Madison, WI). Integrity of RNA was verified by ethidium bromide staining of rRNA bands on denaturing agarose gel.
Gene Expression Profile Defined by Microarray
We evaluated the gene expression profile using the microarray technique. The glass microarray slide, which includes 5535 Oligos (Pan Rat 5K Oligo microarray; MWG-Biotech, Inc., High Point, NC), was hybridized with a probe that was made from the repeated cerulein-treated rats (P3) in the 24-hour groups after the last injection of cerulein according to the manufacturer’s instruction. The hybridization signals were analyzed and compared between the EP3 and CP3 group. Twenty μg of total RNA from five pancreata in the EP3 group (a total of 100 μg) were pooled to generate the probe for EP3 rats. Likewise, 20 μg of total RNA from five pancreata in the CP3 group were also pooled to generate the probe for CP3 rats. RNA was then reverse-transcribed into Cy3- or Cy5-labeled cDNA. The RNA was annealed with 1 μg of Oligo d(T15-20) primer for 10 minutes at 65°C, then incubated for 2 hours at 39°C with 200 μ of SuperScript II, 5 mmol/L dA/G/TTP, and 1 mmol/L Cy3 (control group) or Cy5 (alcohol-fed group)-labeled dCTP in a 40-μl reaction volume. The labeled cDNA was then purified with Qiagen polymerase chain reaction (PCR) product purification kit (Qiagen, Valencia, CA) and combined as one probe, and applied to the array, covered with a 22-mm2 glass coverslip, and placed in a sealed chamber. The nonspecific binding was blocked by incubation with 5% bovine serum albumin for 45 minutes at room temperature, followed by hybridization at 42°C overnight. The slides were then washed in three consecutive washes of decreasing ionic strength (2×, 1×, and 0.5× standard saline citrate, 0.1% sodium dodecyl sulfate).
After washing, the slides were scanned at 10-μm resolution to detect Cy3 (control group) and Cy5 (alcohol-fed group) fluorescence by using the microarray scanner from Biodiscovery (model GM18; Biodiscovery Inc., Los Angeles, CA, through the University of Pittsburgh Genomic and Proteomic Core Laboratories). Both Cy3 and Cy5 channels were simultaneously scanned with independent lasers. The area surrounding each element’s image was used to calculate a local background that was subtracted from the total element signal (ImaGene version 4.2, Biodiscovery, Inc.). Background-subtracted element signals were used to calculate Cy3:Cy5 ratios. The ration of the average of the resulting total Cy3 and Cy5 signal were used to normalize or balance the specific signals for each element. Analysis was performed by using Biodiscovery GeneSight software (version 3.0). The reliability of the array experiments was assessed by selection of several genes using real-time quantitative PCR (such as MCP-1, M3, collagen α chain, hypoxia-induced factors, and so forth), and published literature on cerulein-induced pancreatitis or Lieber-DeCarli alcohol-fed rats (such as CYP2E1,33 heat shock protein,34 and so forth), as well as our previous observations.35–37
Quantization of mRNA Expression by Real-Time Quantitative PCR
Based on the pilot experiments, the altered expression level of RNA was assessed at 3 and 24 hours after the final injection of cerulein. Total RNA (0.5 μg) was reverse-transcribed according to the manufacturer’s recommendations (Invitrogen, Baltimore, MD). RNA was combined with 5 μmol/L random hexamer, 250 μ Superscript II, 40 μ RNase inhibitor (Perkin-Elmer, Foster City, CA), 7.5 mmol/L MgCl2, and 1 mmol/L deoxynucleotide triphosphate (dNTP) per 100 μl of reaction volume. The mixture was then cycled through 10 minutes at 25°C, 45 minutes at 48°C, and 5 minutes at 95°C in a thermal cycler. Negative control (no RNA in the reverse transcription) was included in every run of reverse transcription.
The primers were designed using Primer Express software (version 1.5) from Perkin-Elmer Applied Biosystems, Foster City, CA. The efficiency of amplification of the primers was analyzed by separation on 1.2% agarose gel and only the primers with a single PCR product were used for further study. The sequences are summarized in Table 1. Gene quantification was performed on the ABI Prism 7700 sequence detection system (Perkin-Elmer Applied Biosystems). Quantitative PCR were performed with SYBR Green core reagent (Perkin-Elmer Bioapplied Biosystems), 2.5 μl cDNA products, 250 nmol/L gene-specific primer, 1.25 U AmpliTaq Gold DNA polymerase, 200 μmol/L dNTP, as well as 0.5 U AmpErase UNG in a final volume of 25 μl. Thermal cycling conditions were as follows: 2 minutes at 50°C, 12 minutes at 95°C, followed by 45 repeats of 15 seconds at 95°C, and 1 minute at 60°C. Each sample was also amplified with 18S and GAPDH primer as an internal control. Data collection was performed during each annealing phase. In each run, a negative control (distilled water), and an RNA sample without the reverse transcription step as well as a negative control for reverse transcription were included. Each reaction was performed in triplicate in a 96-well optical reaction plate (Perkin-Elmer Applied Biosystems). All reactions were performed under the same conditions and the sizes of all amplify reaction from the real-time PCR were rechecked on an agarose gel. Results were analyzed using the ABI sequence detection System (version 1.5) software. All values were normalized to the levels of the housekeeping genes 18S rRNA, and expressed as multifold change compared to control liquid diet-fed rats.
Table 1.
Primer Sequences for Real-Time PCR
| Primer name | Gene location | Access no. | Sequences (5′—3′)
|
|
|---|---|---|---|---|
| Forward | Reverse | |||
| 18S | 557–706 | M11188 | gag gcc ctg taa ttg gaa tga gtc | tcc caa gat cca act acg agc ttt |
| Collagen α1(1) | 4179–4245 | Z78279 | tcg att cac cta cag cac gc | gac tgt ctt gcc cca agt tcc |
| Fibronectin | 3431–3552 | NM_019143 | cca aag cca ccg gag tct t | ctt gaa gcc aat cct tgg agc |
| GAPDH | 194–263 | NM_017008 | atg gca cag tca agg ctg aga | cgc tcc tgg aag atg gtg at |
| HIF-1α | 1164–1234 | AF057308 | tct gag gac acg agc tgc c | gct gga gct agc aga gtc agg |
| HIF-3α | 715–786 | AJ277827 | ggc ctt tct cag tcg cca c | cca gca act tct gca atc ctc |
| IL-10 | 1053–1133 | X60675 | cca ggt tgc tcc ttc cat ga | cga gac tgg aag tgg ttg cag |
| IL-12 | 189–263 | S82489 | aga tgc tgg cca ata cac ctg | tcc ttc ttg tgg agc agc aga |
| MCP-1 | 222–286 | M57441 | tga gac cag cag cct ttg c | aga tct gcc ggt ttc tct tgg |
| MIP-1α | 126–192 | U22414 | cga agt ctt ctc agc gcc at | ttg ccg tcc ata gga gaa gc |
| Procollagen α2(1) | 3636–3699 | AF121217 | cca acc tgt caa cac ccc a | cca gac atg ctt gtt ggc c |
| RANTES | 167–236 | NM031116 | gca agt gct cca acc ttg c | ttc tct ggg ttg gca cac ac |
| TGF-β1 | 967–1032 | NM_021578 | gct gct gac ccc cac tga t | cac tgc cgg aca act cca g |
Statistical Analysis
All data were expressed as the mean ± SEM. Each group contained four to seven rats. The comparisons of different treatments were performed by using analysis of variance and posthoc tests (StatView 4.5; Abacus Concepts Inc., Berkeley, CA). Differences were considered significant at P < 0.05.
Results
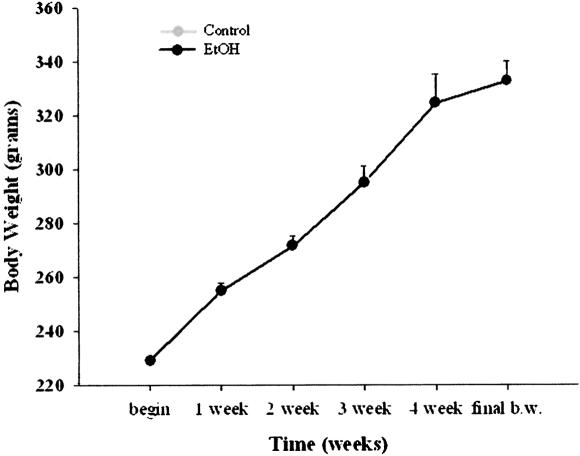
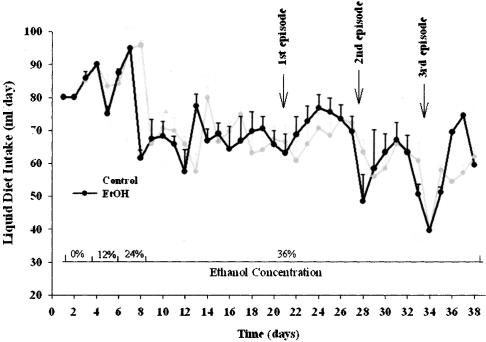
A total of 104 Wistar male rats were used for this study. The rats tolerated the Lieber-DeCarli ethanol diet and repeated cerulein treatments with no rats dying during the experiments. The body weight gain in rats fed the ethanol diet with or without cerulein treatment (2.8 to 3.2 g/day) were similar to that in rats fed the chow diets (Figure 3). The average alcohol intake in ethanol-fed alone and ethanol plus cerulein was 12.76 versus 12.91 ml/kg/day of ethanol (P > N.S., Figure 4), as previously noted in alcohol-fed alone rats.38,39 The blood ethanol concentrations fluctuated within the range of 146 to 253 mg/dl.
Figure 3.
Body weight gain throughout the experimental period.
Figure 4.
The daily average intake of control and alcohol-liquid diets consumed by control-fed and alcohol-fed rats (ml/day/rat). First, second, and third episode, demonstrated the four injections of the cerulein at that specific day.
Serum Amylase
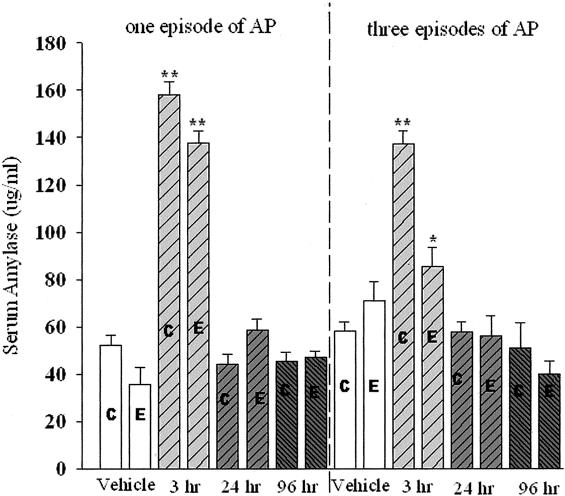
The serum amylase was significantly increased at 3 hours after the final injection of cerulein in EP1, CP1, EP3, and CP3 rats (Figure 5). Amylase levels significantly increased in EP3 rats demonstrating active injury (P < 0.05, note that the lower amylase levels in alcohol-fed rats could also reflect altered expression of the amylase gene compared to protease genes as opposed to less injury).
Figure 5.
Comparison of one episode and three episodes of cerulein pancreatitis on serum amylase levels. C, Control diet-fed rats; E, alcohol liquid diet-fed rats. *, P < 0.05; **, P < 0.01, as compared to the respective vehicle-treated group.
Edema
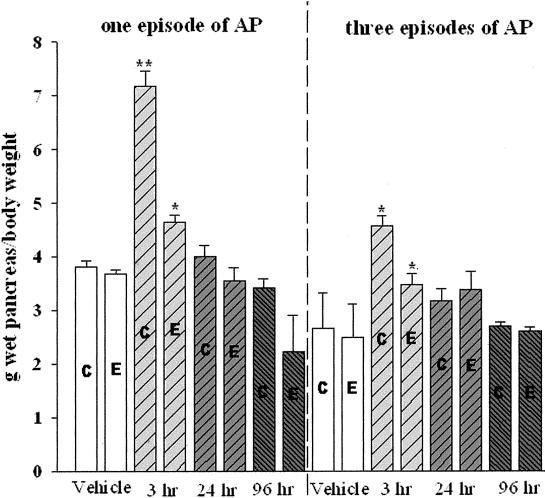
In P1 pancreatic edema in alcohol-fed rats was significantly increased as compared to the vehicle-treated rats in terms of pancreas wet weight per body weight at 3 hours after the final injection (P < 0.05). However, the amplitude of the increment is much smaller than that in cerulein-treated control-fed rats (Figure 6). In P3 the repeated cerulein treatments induced only moderate pancreatic edema in both control- and alcohol-fed rats as compared to their corresponding vehicle-treated rats. However, the pancreatic edema was far less severe than that in one-cerulein treatment rats.
Figure 6.
Comparison of one episode and three episodes of cerulein pancreatitis on pancreas wet weight versus body weight. C, Control diet-fed rats; E, alcohol-liquid diet-fed rats. *, P < 0.05; **, P < 0.01, as compared to their corresponding vehicle-treated group (control-fed cerulein/control-fed vehicle, alcohol-fed cerulein/alcohol-fed vehicle).
Histology
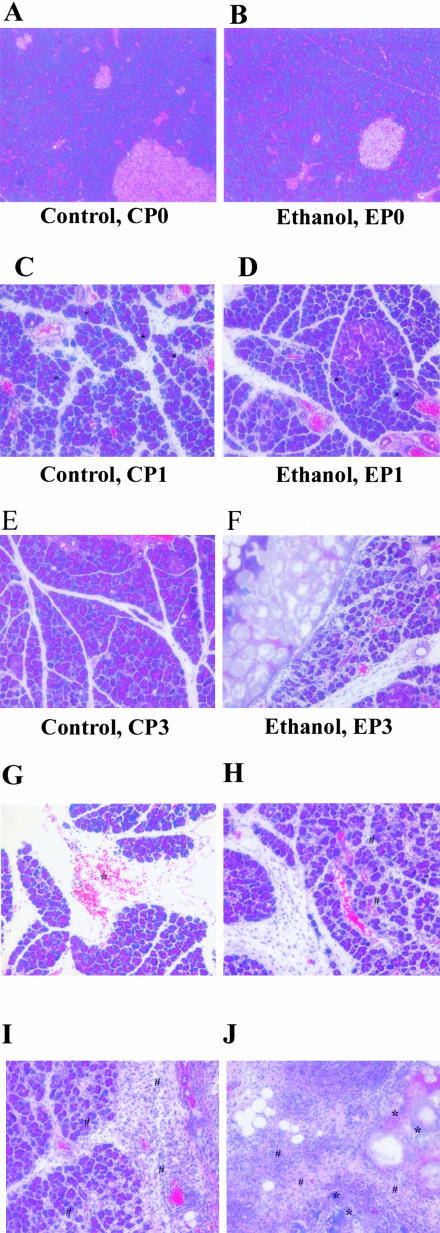
As illustrated in Figure 7A, no histological change was found in the pancreas of control liquid diet-fed rats with vehicle treatment. Pancreatic pathological changes were minimal in rats fed the ethanol diet alone with vehicle treatment (Figure 7B) after 1 and 4 weeks of feeding as previously reported.38,40,41 Likewise, there is no difference in terms of extracellular matrix deposition between alcohol versus control liquid diet-fed rats (Figure 7).
Figure 7.
Representative pancreatic tissue sections from vehicle-treated control-fed rats (A, CP0); vehicle-treated alcohol-fed rats (B, EP0); 24-hours one episode of cerulein pancreatitis control-fed rats (C, CP1) (*, typical vacuolization in acinar cells); 24-hours one episode of cerulein pancreatitis alcohol-fed rats (D, EP1) (*, typical vacuolization in acinar cells); 96-hours three episodes cerulein pancreatitis control-fed rats (E, CP3); 96-hours three episodes cerulein pancreatitis alcohol-fed rats (F, EP3). G–J: Findings in EP3 rats. G: Hemorrhage (labeled as *); H: white blood cell infiltration (labeled as #) and acinar cell necrosis; I: severe white blood cell infiltration around the necrosis and calcification; and J: calcification (labeled as *) and early fibrosis (labeled as #) in parenchyma of pancreas in EP3 rats. H&E stain. Original magnifications, ×200.
P1
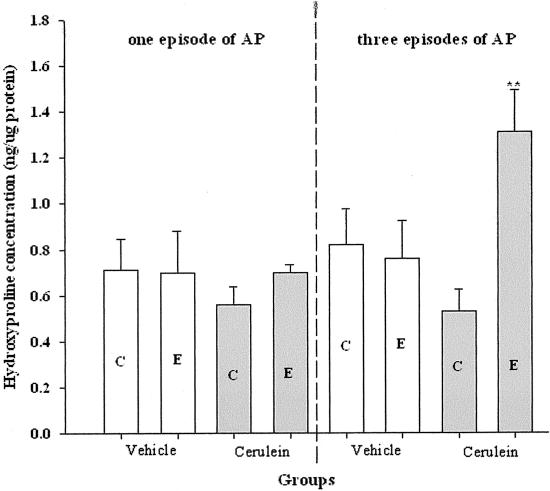
A single episode of cerulein pancreatitis did not induce any significant increase in the deposition of extracellular matrix in pancreatic parenchyma (Figure 7C) or pancreatic hydroxyproline level in vehicle- and ethanol-fed rats (Figure 8). However, as demonstrated in Figure 7C, vacuolization was more severe in the pancreata of control-fed rats as compared to alcohol-fed rats (Figure 7D).
Figure 8.
The alterations of pancreatic hydroxyproline levels at 96 hours after the last injection in vehicle-treated, one or three episodes cerulein pancreatitis. C, Control-fed group; E, alcohol-fed group. **, P < 0.01, as compared to the vehicle-treated group.
P3
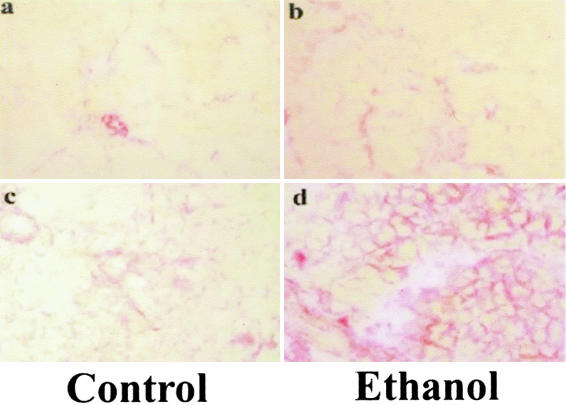
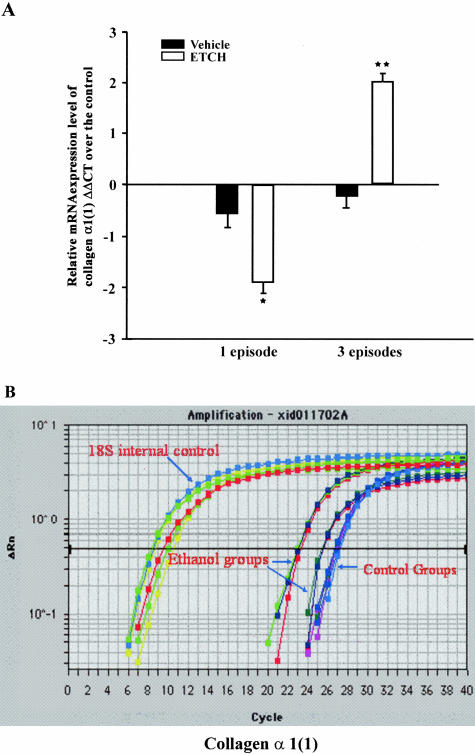
By 96 hours after the last cerulein injection in control rats (CP3), the altered pancreatic structure induced by the repeated cerulein treatments demonstrated rapid recovery, including intralobular septa and pancreatic lobules (Figure 7E). At this time point, the inflammatory cells were resolving and the necrotic acinar cells were replaced by normal acinar cells (Figure 7E). However, in alcohol-fed rats (EP3), patchy and severe inflammation persisted throughout the parenchyma in all rats (Figure 7F). These alterations included hemorrhage, microabscess, and acinar cell necrosis, as well as severe white blood cell infiltration (Figure 7; G to J). Calcification appeared in areas of presumed necrosis with early fibrosis being evident within these areas. Microabscess, severe necrosis, and early calcification were only seen in EP3 rats. The intralobular septa were abnormally expanded and with occasional pancreatic lobules split. Sirius Red staining revealed new connective tissue around the duct system and near acinar cells (Figure 9). Furthermore, pancreatic hydroxyproline level was dramatically increased at 96 hours in alcohol-fed rats (EP3, Figure 8) as compared to CP1, EP1, and CP3 rats. Real-time quantitative PCR revealed significant up-regulation of collagen α1(1) and fibronectin in EP3 rats (Table 2 and Figure 10). Western blot analysis also revealed a clear parallel increase of collagen type 1 at protein levels (data not shown).
Figure 9.
Representative tissue sections stained by Sirius Red. a: Control vehicle-treated group (CP0); b: ethanol vehicle-treated group (EP0); c: 96-hours three episodes of cerulein pancreatitis in control-fed group (CP3); and d: 96-hours three episodes of cerulein pancreatitis in alcohol-fed group (EP3). Sirius Red stain. Original magnifications, ×100.
Table 2.
List of the Main Genes Altered by Recurrent Cerulein-Induced Pancreatitis in Chronic Alcohol-Fed Rats
| Cy3/Cy5 signal | Accession No. | Gene names | |
|---|---|---|---|
| Apoptosis | |||
| Up-regulated | 498.1 | u72349 | Bcl-xbeta |
| 46.9 | u34932 | Fos-related antigen; FRA | |
| 23.4 | u40188 | Neuronal cell death-related gene in neuron-7 (DN-7); induced upon programmed cell death in neuronally differentiated PC12 cells | |
| 19.4 | u09793 | p21 (c-Ki-ras) | |
| 10.3 | s76513 | bcl-x = apoptosis inhibitor (protooncogene) (ovary, mRNA Partial, 726 (nt); apoptosis inhibitor | |
| 7.7 | l41275 | p21 protein (cip1) gene | |
| 6.9 | af136282 | Apoptotic death agonist BID (BID) | |
| 6.3 | af243515 | BCL2/adenovirus E1B 19 kd-interacting protein 3 (Bnip3); nuclear mitochondrial product; BNIP3; NIP3; pro-apoptotic mitochondrial | |
| 2.9 | af222733 | DEAD box protein 1 (Ddx1) partial cds | |
| 2.8 | u12187 | Ras-related protein (rad); ras-related protein | |
| Down-regulated | −3.3 | af239739 | Death-up-regulated gene (DUG) |
| −2.8 | ay029163 | BCL2L10 (Bcl2l10); Boo, Diva | |
| Cell growth and differentiation | |||
| Up-regulated | 109.7 | af002281 | Alpha-actinin-2 associated LIM protein; ALP |
| 99.5 | m74295 | rhoB gene | |
| 94.3 | af271786 | Fibroblast growth factor 13 (Fgf13) | |
| 85.9 | af036255 | RING finger protein; contains B-box, coiled-coil, ABP repeat, B-propeller, WD repeat, RBCC domain | |
| 79.0 | l13619 | Growth response protein (CL-6); insulin-induced | |
| 63.3 | af205717 | Tetraspan protein LRTM4 (LRTM4) | |
| 46.0 | af172174 | Urotensin II precursor | |
| 44.4 | x54806 | Cytokeratin type I (3′ end) | |
| 43.3 | s70803 | Clone p10.15 product (osteosarcoma ROS17/2.8, 737 (nt); | |
| 38.9 | u47673 | Sodium-cotransporter rkST1 partial cds; member of the SGLT1-transporter-family | |
| 37.8 | j03886 | Skeletal muscle myosin light chain kinase; skeletal muscle light chain kinase (E.C. 2.7.1.37) | |
| 34.4 | u61748 | Clone 9–32 (Rk9–32), dynein heavy chain (Dnchc2) partial cds; overlaps with GenBank accession no. D26495; molecular motor | |
| 33.3 | j02713 | Mast cell protease-like gene, 5′ end; homologue | |
| 32.7 | l09120 | Calpain II 80 kd subunit | |
| 27.1 | af028784 | Glial fibrillary acidic proteins alpha and delta (GFAP) gene, alternatively spliced products; intermediate filament; alternatively spliced | |
| 26.4 | m84685 | Muscle regulatory factor (MRF4) gene | |
| 26.0 | af272661 | Alpha 4 type V collagen; collagen alpha chain | |
| 24.3 | u46034 | Stromelysin 3 | |
| 22.6 | s54212 | Ciliary neurotrophic factor receptor alpha component (brain, 1332 (nt)) | |
| 22.6 | d14014 | Cyclin D1 | |
| 18.8 | af177694 | Protocadherin-T2 (pcdh-T2) partial cds; protocadherin gamma family member | |
| 16.3 | ab020022 | Neuronal differentiation-related; neuronal differentiation-related gene | |
| 16.5 | m83177 | Amyloid P component (SAP) | |
| 16.3 | ab020022 | Neuronal differentiation-related; neuronal differentiation-related gene | |
| 12.6 | l35271 | AML1 | |
| 12.2 | af014827 | Vascular endothelial growth factor D (VEGF-D) | |
| 10.6 | u66470 | Cell growth regulator rCGR11 | |
| 7.8 | m76535 | Gap junction structural protein, connexin (CXN-40) gene | |
| 6.3 | m92074 | Troponin I | |
| 5.9 | af016503 | Procollagen C-proteinase enhancer protein (PCPE) | |
| 5.9 | af178086 | Kidney-specific membrane protein NX-17 | |
| 5.9 | d83348 | Long-type PB-cadherin | |
| 5.9 | u05784 | Microtubule-associated proteins 1A and 1B light chain 3 subunit | |
| 5.7 | af077338 | Myosin-binding protein H; MyBP-H | |
| 3.4 | af311311 | P116RIP; Rho-interacting protein; similar to Mus musculus p116Rip | |
| Down-regulated | −2.2 | af236054 | Liver regeneration-related protein 1 |
| −2.4 | af277717 | Fibroblast growth factor receptor 3 (Fgfr3) | |
| −3.7 | af324043 | Claudin-11; tight junction protein | |
| −4.0 | u11031 | Neural cell adhesion molecule BIG-1 protein (BIG-1) | |
| −588.3 | m93005 | Guanylin; precursor | |
| (Table continues) |
Table 2.
Continued
| Cy3/Cy5 signal | Accession No. | Gene names | |
|---|---|---|---|
| Inflammation | |||
| Up-regulated | 124.1 | af182508 | Pre-T cell receptor alpha-type chain partial cds |
| 64.7 | x00336 | Interferon-alpha 1 (IFN-alpha1) | |
| 58.8 | af286344 | Immunoglobulin 4G6 light chain variable region partial cds | |
| 38.8 | d87840 | Madcam 1 | |
| 37.9 | m23885 | T-cell receptor beta-chain mRNA V-region (V-J-C), clone CRTB29; T-cell receptor beta chain precursor | |
| 32.1 | af118854 | Immune suppressor factor J6B7-like protein partial cds | |
| 13.9 | af113922 | MHC class II antigen B beta chain (RT1.Bbeta) gene, partial cds | |
| 13.1 | af015718 | Interleukin-15 alternative-splice product (IL-15); lacks 16 amino acids compared to normal product | |
| 11.9 | aj277828 | Hypoxia-inducible factor 2 alpha (Hif-2a gene) | |
| 10.1 | m57441 | Chemoattractant protein-1 (MCP-1) | |
| 9.7 | m87786 | (Hybridoma YTH655) immunoglobulin light chain variable region, complementarity-determining regions partial cds; anti-CD2 (T11; LFA-2) variable region; putative | |
| 5.7 | af187860 | Hsp70-binding protein HspBP; rat HspBP; HspBP1 isoform | |
| 3.4 | u90448 | CXC chemokine LIX | |
| Down-regulated | −16.2 | m87634 | BF-1 |
| −9.9 | af091576 | Isolate HFL-VN1 olfactory receptor partial cds | |
| −7.3 | d86642 | FK506-binding protein 12.6 | |
| Metabolism | |||
| Up-regulated | 64.0 | af038870 | Betaine homocysteine methyltransferase (BHMT) |
| 53.6 | l36250 | (Clone 71) triosephosphate isomerase | |
| 47.6 | l34821 | Succinate-semialdehyde dehydrogenase (SSADH) 3′ end | |
| 34.9 | af061442 | Cytochrome P450 2E1 | |
| 27.1 | k03248 | Phosphoenolpyruvate carboxykinase (GTP) gene, exons 9 and 10 and complete cds; phosphoenolpyruvate carboxykinase | |
| 26.9 | u23769 | CLP36 (clp36) | |
| 25.5 | af017393 | Cytochrome P4502F4 (CYP4502F4) | |
| 24.9 | u02096 | Fatty acid binding protein | |
| 24.8 | l14284 | N-acetylglucosaminyltransferase V | |
| 22.0 | af100154 | Kynurenine aminotransferase/glutamine transaminase K (Kat) gene | |
| 21.1 | u23146 | Mitogenic regulation SSeCKS (322) gene; Src suppressed C kinase substrate | |
| 20.4 | d00575 | Pituitary glycoprotein hormone alpha-subunit precursor | |
| 17.2 | u77583 | Casein kinase I alpha L (CKIaL) | |
| 16.8 | m22631 | Alpha-propionyl-CoA carboxylase; alpha-propionyl-CoA carboxylase (EC 6.4.1.3) | |
| 16.3 | j05210 | ATP citrate-lyase | |
| 16.8 | m22631 | Alpha-propionyl-CoA carboxylase; alpha-propionyl-CoA carboxylase (EC 6.4.1.3) | |
| 16.3 | j05210 | ATP citrate-lyase | |
| 12.5 | u57042 | Adenosine kinase | |
| 9.1 | x76988 | Gal beta 1,3 galNAc alpha 2,3-sialyltransferase | |
| 8.8 | d13121 | ATP synthase subunit e | |
| 6.5 | m29249 | 3-Hydroxy-3-methylglutaryl coenzyme A reductase gene, partial cds | |
| 4.8 | af006617 | Microsomal stress 70 protein ATPase core (Stch); similar to HSP70 | |
| 3.8 | m88592 | Peroxisome proliferator-activated receptor (PPAR) | |
| 3.0 | m15893 | Pancreatic lysophospholipase; lysophospholipase precursor | |
| 2.8 | u39943 | Cytochrome P450 monooxygenase (CYP2J3); hemoprotein; arachidonic acid epoxygenase and omega-1 hydroxylase | |
| Down-regulated | −16.7 | af163318 | Putative N-acetyltransferase Camello 1 (cml1) |
| −53.4 | s61804 | O6-methylguanine-DNA methyltransferase [liver, 812 nt]; | |
| −70.1 | m67465 | 3-beta-hydroxysteroid dehydrogenase/delta-5-delta-4-ene-isomerase; 3-beta-hydroxysteroi | |
| −107.8 | m61112 | Delta-3,delta-2-enoyl-CoA isomerase | |
| Transcription factors | |||
| Up-regulated | 50.8 | af199334 | NIM2 (Nim2) |
| 50.6 | l01702 | Protein-tryosine-phosphatase (LRP) | |
| 35.6 | u17013 | Transcription factor Oct1 (Oct1) partial cds; based on comparisons with Oct1 from other species, this cDNA is probably missing the region encoding 114–115 | |
| 20.3 | u41845 | Nuclear pore complex protein Nup50 (Nup50) | |
| 19.6 | af181251 | Lung Kruppel-like factor (Lklf) gene; zinc finger transcription factor; similar to mouse LKLF | |
| (Table continues) |
Table 2.
Continued
| Cy3/Cy5 signal | Accession No. | Gene names | |
|---|---|---|---|
| 14.6 | af246634 | I-Kappa-B-beta; IkB-b; IkB protein family member; inhibitor of NF-kappa B; may account for persistent activation of NF-kappa B; regulated by | |
| 13.1 | aj007467 | Putative zinc-finger protein, partial | |
| 6.9 | af107843 | TATA element modulatory factor; similar to Homo sapiens TATA element modulatory factor | |
| 5.7 | u35365 | Proto-oncogene FYN (p59fyn) | |
| 5.2 | ab003091 | IRF-2, partial cds | |
| 4.6 | j03823 | Mas oncogene; mas oncogene encoded protein | |
| 4.6 | u37101 | Granulocyte colony-stimulating factor | |
| 4.1 | af042499 | Smad7; Mad homolog | |
| 3.7 | x91810 | Stat3 protein; single, polypeptide chain; needs to form homo- or heterodimers for specific DNA-binding | |
| 3.2 | u17837 | Zinc finger protein RIZ | |
| Signal transduction | |||
| Up-regulated | |||
| 37.5 | l18948 | Intracellular calcium-binding protein (MRP14) | |
| 35.6 | af016247 | RTK40 homolog (tyro10); tyrosine kinase | |
| 32.9 | u16802 | Ca2+-dependent activator protein (CAPS); similar to C elegans Unc-31; calcium-dependent activator protein for secretion; calcium-dependent | |
| 24.7 | l08494 | GABA-A receptor alpha-5 subunit gene | |
| 23.7 | ab017656 | Muscarinic receptor m3 | |
| 23.5 | d13126 | Neural visinin-like Ca2+-binding protein type 3 (NVP-3); NVP-3 | |
| 22.7 | af076619 | Molecular adapter rGrb14 (Grb14); signal transduction protein; Grb7 family member; binds the insulin receptor | |
| 20.1 | l25264 | G-protein-coupled muscarinic potassium channel (GIRK1) | |
| 16.2 | af000300 | Lyn A tyrosine kinase (LynA); Src-family protein tyrosine kinase | |
| 16.2 | af000300 | Lyn A tyrosine kinase (LynA); Src-family protein tyrosine kinase | |
| 15.0 | af001423 | N-methyl-d-aspartate receptor NMDAR2A subunit; NMDA receptor NMDAR2A subunit | |
| 13.7 | af040750 | G protein-coupled receptor kinase 6, splice variant C (GRK6); GRK6C | |
| 12.5 | af135265 | Large-conductance calcium-activated potassium channel (slo); maxi-k channel isoform | |
| 6.2 | l08610 | Alpha-1B adrenergic receptor gene, exon 2 and complete cds | |
| 5.6 | u39875 | EF-hand Ca2+-binding protein p22 | |
| Miscellaneous | |||
| Up-regulated | |||
| 67.0 | u62315 | Alpha-globin (GloA) gene; minor gene | |
| 57.9 | af135839 | Homeodomain protein RX (Rx) | |
| 51.3 | af168795 | Schlafen-4 (SLFN-4) | |
| 40.8 | af227145 | Candidate taste receptor T2R8; G protein-coupled receptor | |
| 39.0 | m64385 | Olfactory protein | |
| 34.4 | d37885 | Choline kinase R2, partial cds | |
| 31.9 | ab048823 | KCNK3b TASK1 splice bvariant (TASK1b) |
Figure 10.
The relative mRNA expression levels of collagen-α1(1) in vehicle-treated and cerulein-induced pancreatitis in both one and three episodes pancreatitis groups. a: The mRNA expression levels relative to the 18s RNA internal control, The bar represents the values of the mRNA expression in the ethanol-fed rats as compared to the respective control-fed rats. *, P < 0.05; **, P < 0.01, as compared to the values in the vehicle-treated groups; B: the real-time amplification plots of collagen-α1(1) and 18s RNA.
Cellular Infiltration
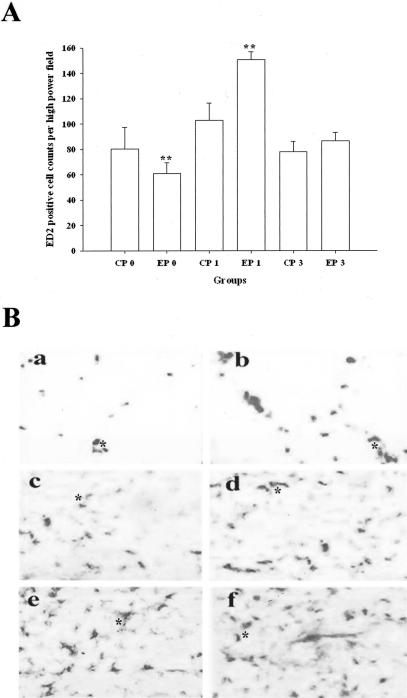
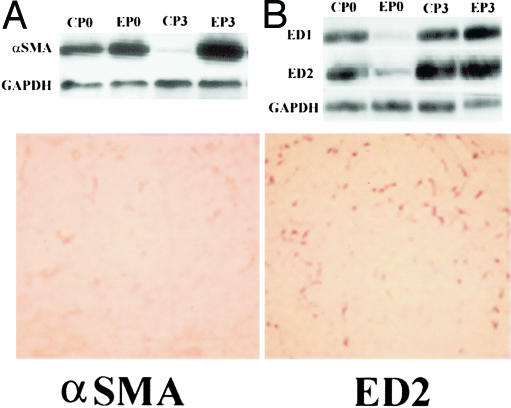
In P1, in contrast to the edema, the inflammatory cell infiltrations into pancreatic parenchyma were more severe in alcohol-fed rats than that in control-fed rats (Figure 11 and Figure 7, H and I). In P3 the inflammation induced by the repeated cerulein treatment in pancreata in control-fed rats resolved by 96 hours after the last injection. However, inflammation in EP3 rats was more severe than CP3 rats at 24 hours and persisted until 96 hours. ED2-positive cells (resident macrophages) were mainly distributed along the interlobular/intralobular septa and acinar cells within necrotic regions. The increase in ED2 was confirmed with Western immunoblot (Figure 12).
Figure 11.
Alteration of macrophage infiltration in pancreas of control- and alcohol-fed rats. a: The relative changes of resident macrophages (ED2-immunoreactive positive cells) counting per high-power field in control-fed rats. **, P < 0.01, as compared to the values of the corresponding control diet-fed groups. B: Representative tissue sections stained by ED2 immunohistochemical technique. a: Vehicle-treated control-fed group (CP0); b: vehicle-treated alcohol-fed group (EP0); c: 24-hours one episode of cerulein-treated control-fed rats (CP1); d: 24-hours one episode of cerulein-treated alcohol-fed rats (EP1); e: 24-hours three episodes cerulein-treated control-fed rats (CP3); and f: 24-hours three episodes cerulein-treated alcohol-fed rats (EP3). *, Resident macrophages. ED2 immunohistochemical stain. Original magnifications, ×100.
Figure 12.
Comparison of the distribution of α-SMA immune-reactive positive cells with ED2 immune-reactive positive cells in pancreas of one episode of pancreatitis in alcohol-fed rats on consecutive tissue sections at 24-hour group. Left: α-SMA immunoblots (top) and α-SMA immunochemical stain (bottom). Right: ED1 and ED2 immunoblots (top) and ED2 immunochemical stain (bottom). α-SMA and ED2 immunohistochemical stain. Original magnifications, ×100.
Pancreatic Stellate Cells
In control-fed rats, the repeated cerulein treatment activated α-SMA-positive cells in the septa of pancreata during the early period of the inflammation with a peak ∼24 hours after the final injection. However, in alcohol-fed rats, numerous α-SMA-positive cells were still present in the interstitium around acini and necrotic region, intralobular ducts, as well as patched fibrogenetic areas 96 hours after the final injection (Figure 12). The α-SMA immunoblots further supported this observation (Figure 12).
Microarray Analysis
Microarray analysis showed that significant alterations of multiple genes were evident in the EP3 rats. As summarized in Table 2, of the 5535 genes that were selected for this microarray, the repeated cerulein treatments up-regulated ∼2.98% of the genes more than 10-fold, and 8.1% more than twofold in alcohol-fed rats compared to control rats. Of the genes 0.6% were down-regulated twofold and 1.25% of the genes were more than onefold down-regulated as compared to control rats (Table 2). The genes identified by the microarray technique mainly belong to five different categories: 1) apoptosis; 2) ethanol metabolism and oxidative stress; 3) fibrogenesis and extracellular matrix; 4) chemokines, cytokines, and growth factors; and 5) transcription factors. In addition, one-third of the up-regulated genes have been reported to be associated with the development of cerulein-induced pancreatitis or expressed in liver, pancreas, or other tissues from the Lieber-DeCarli alcohol-fed rats. In particular, genes associated with fibrosis that were up-regulated in EP3 rats included: troponin I, vascular endothelial growth factor D (VEGF-D), α4 type V collagen, fibroblast growth factor 13, muscle regulatory factor (MRF4) gene, stromelysin 3, procollagen C-proteinase enhancer protein, and some other adhesion molecules, with each increasing 6- to 94-fold, respectively. Other alterations are summarized in Table 2.
Alterations of Pro- and Anti-Inflammatory Cytokines
Microarray analysis demonstrated that several key cytokines are significantly up-regulated in EP3 ethanol diet-fed rats. This was confirmed by real-time quantitative PCR. The expression levels of the proinflammatory cytokines including MCP-1, MIP-1, RANTES, as well as anti-inflammatory cytokines including TGF-β, interleukin (IL)-10, and IL-12 are summarized in Table 3.
Table 3.
Alterations of Relative Expression Levels in Alcohol-Fed Rats as Compared to Control-Fed Rats (ΔΔCT: Difference of the Thresholds for PCR Amplifications in Alcohol-Fed Rats Versus Control-Fed Rats) Determined by Real-Time Quantitative PCR*
| Primer pairs | 1 Episode
|
3 Episodes
|
||||||
|---|---|---|---|---|---|---|---|---|
| 3 Hour
|
24 Hour
|
3 Hour
|
24 Hour
|
|||||
| ΔΔCT | P value | ΔΔCT | P value | ΔΔCT | P value | ΔΔCT | P value | |
| HIF-1α | −0.57 | 0.0023 | 3.63 | <0.0001 | −0.30 | 0.0849 | −1.11 | 0.0001 |
| HIF-3α | −0.95 | 0.0519 | 1.80 | <0.0001 | 0.57 | 0.2406 | 2.73 | 0.0001 |
| MIP-1α | −0.96 | 0.0158 | −0.14 | 0.5454 | 1.97 | <0.0001 | 1.9 | <0.0001 |
| MCP-1α | −1.13 | 0.0024 | 2.36 | 0.0064 | 1.38 | 0.0078 | 1.14 | 0.001 |
| RANTES | −5.73 | <0.0001 | −0.10 | 0.7571 | 0.53 | 0.0008 | −0.28 | 0.2137 |
| TGF-β1 | −2.66 | 0.0001 | 4.75 | 0.0057 | −0.32 | 0.1560 | 2.21 | 0.0012 |
| IL-10 | −1.13 | 0.0061 | 0.91 | 0.0159 | −0.95 | 0.0024 | 1.24 | 0.0260 |
| IL-12 | −4.74 | <0.0001 | 0.44 | 0.4390 | −0.57 | 0.5867 | 0.77 | 0.0558 |
| Collagen α1(1) | −3.68 | <0.0001 | 4.51 | 0.0002 | −1.26 | 0.0005 | 2.80 | 0.0003 |
| Procollagen α2(1) | −3.12 | <0.0001 | 3.61 | 0.0128 | −1.12 | <0.0001 | 3.34 | <0.0001 |
| Fibronectin | −1.42 | 0.0045 | 5.43 | 0.0006 | −1.04 | 0.0005 | 2.70 | <0.0001 |
Negative value means a down regulation of mRNA expression in pancreas of alcohol-fed rats as compared to the expression levels in those in control-fed rats.
Discussion
One of the major limitations in understanding chronic alcoholic pancreatitis has been the lack of an appropriate animal model. We hypothesized that development of most forms of CP required several sequential factors.42 These factors could be broadly classified as susceptibility factors, initiating factors, and progression factors. The current studies demonstrate that the key features of ACP are reproduced in the rat with chronic alcohol plus RAP. Neither alcohol alone, nor three episodes of recurrent pancreatitis alone are sufficient to cause CP. These findings, when combined with previous studies, are consistent with the hypothesis that alcohol is both a susceptibility factor and a progression factor, but ACP requires an initiation factor, such as an AP event42 and additional progression factors such as RAP.
The current model allows us to investigate the mechanisms leading to collagen and fibronectin expression and deposition in the EP3 rats. Four major observations were made. First, alcohol feeding alone (EP0) was associated with a marked reduction in immunocytes and evidence of inflammation (Figures 7 and 11). Second, the immune response to an initial episode of AP in the alcohol-fed rats (EP1) was exaggerated compared to controls (CP1), even though the injury was less (see macrophage count and ED2 stain in Figure 11, and proinflammatory cytokine responses of EP1 versus CP1 rats in Table 3, amylase and edema in Figures 5 and 6). Third, the severity of cerulein-induced pancreatic injury was diminished after the initial episode of active pancreatitis (reduced amylase levels and edema in CP3 versus CP1 and EP3 versus EP1, Figures 5 and 6) and was associated with an increase in anti-inflammatory cytokines. Finally, the anti-inflammatory cytokine response, inflammatory cell infiltrate, stellate cell activation, and markers of fibrosis were markedly elevated only in the rats with both RAP and continued alcohol exposure (eg, Figure 12). Each of these observations provides important insights into the pathogenesis of ACP.
Inflammatory Response to Alcohol Ingestion Alone
Chronic alcohol exposure alone modestly increased serine protease mRNA expression and enzyme content as well as decreased amylase mRNA and enzyme content.43–47 Chronic alcohol exposure injures the mitochondria in acinar cells, increases markers of metabolic stress, and delays pancreatic exocrine secretion.24,36,46,48 Chronic alcohol exposure also alters neurohormonal control mechanisms by altering receptors, voltage-gated ion channels, and signal-transduction pathways.7 Thus, chronic alcohol consumption drives metabolic and oxidative stress in acinar cells. However, alcohol at all but extreme doses does not lead to either acute or chronic pancreatitis.20,40,41,49 The reduction in tissue macrophage and cell number during chronic alcohol feeding likely reflects general suppression of inflammation in the naive pancreas and may explain why progression to CP is not seen without AP.
Inflammatory mechanisms are central in modulating the severity of AP and development of CP. In both human CP and experimental CP models, a series of inflammatory mediators have been identified that may play a key role in the CP process.16,50,51 In ACP, T lymphocytes are frequently found in the pancreas of individual patient, with up-regulation of the MHC I and MHC II.52 The T-cell population in the pancreas of patients with ACP consists of CD4+ and activated CD8+ cells, and to a less degree of CD 56+ cells.53 These cells are generally cytotoxic and may lead to continual damage of the pancreas. Macrophages represent approximately another one third of the infiltrated cells in CP.50 As demonstrated here, macrophage infiltration, peaked at 24 hours, and remained elevated through the subsequent experimental time points. Of note, macrophages appeared to cluster near areas where fibrosis developed. This finding was consistent with the observation that CD68+/CCR5 cells (ie, macrophages) were prominent in the fibrotic parenchyma of pancreas in CP patients.18 These macrophages appear to be active because cytokines associated with macrophage activity were up-regulated in the pancreas of CP patients. Macrophages and their role in modulating the persistence of pro- and anti-inflammatory responses, including stellate cells,54 suggest that they play an important role in the development of ACP.
Alcohol as a Susceptibility Factor for AP
In vitro experiments also demonstrated that pancreata isolated from rats fed alcohol for 9 to 12 months were more susceptible to cerulein-induced activation of trypsinogen and chymotrypsinogen than pancreata from the pair-fed control rats.41 CCK plus ethanol could produce sixfold higher zymogen conversion than that induced by CCK alone.55 In chronic alcohol-fed rats, CCK-8 infusion causes AP at concentrations lower than required for control rats.20 The current study demonstrated that the severity of pancreatitis in alcohol-fed rats is greater than controls in terms of cytokine release, inflammatory cell infiltration and the activity of the macrophages, although amylase levels are similar. Together, these studies suggest that alcohol increases the risk of developing episodes of AP and contributing to severity.
Recurrent Acute Pancreatitis Is Associated with Production of Pro- and Anti-Inflammatory Cytokines
We studied the changes in the inflammatory response to cerulein stimulation between initial episode (P1) and three-episode (P3) pancreatitis in alcohol- and control-fed rats. The proinflammatory cytokines include macrophage inhibitory protein (MIP1α), tumor necrosis factor (TNF)-α, monocyte chemotactic protein (MCP-1α), and the cytokine regulated on activation, normal T-expressed and secreted (RANTES). The anti-inflammatory factors include TGF-β, IL-10, and HIF-1α. A single episode of cerulein treatment in alcohol-fed rats significantly up-regulated expression of MCP-1α, RANTES, and TNF-α. The repeated cerulein treatments in alcohol-fed rats (EP3) triggered much higher levels of TNF-α, MCP-1α, and RANTES. The increased TNF-α level persisted even 96 hours after the final cerulein injection. The observation of continuously increased TNF-α and MIP-1α supports a major role for active macrophages in initiating pancreatitis.
The cytokine profile in recurrent pancreatitis differs from the profile of a single episode by the up-regulation of TGF-β and IL-10, which are potent anti-inflammatory cytokines released by macrophages. These cytokines may limit the severity of AP (decrease amylase, edema, and inflammatory cell infiltration), but drive fibrosis through acting on PSC.56,57 The effect of an alcohol background on the inflammatory responses (EP3 versus CP3) was most striking with respect to TGF-β, IL-10, MIP-1α, and HIF-3α release, as well as to the degree of macrophage infiltration. These factors are strongly linked with the marked increase in fibrosis-associated proteins seen in the EP3 rats versus other conditions.
One episode of cerulein pancreatitis in rats only transiently increased expression of TGF-β.58 The repeated cerulein treatments in alcohol-fed rats maintained elevated TGF-β throughout the experimental period at both mRNA and protein levels. The time course of the increased TGF-β parallels the development of fibrosis.56,59,60 When TGF-β is given to mice during repeated episodes of cerulein pancreatitis, the pancreas responds with enhanced matrix deposition and fibrosis as seen in CP.26,61 In the current study, repeated cerulein treatments caused a sustained elevation of TGF-β, although the peak levels in the subsequent acute attack decreased (in parallel with less severe proinflammatory response to injury).
Only Alcohol Plus RAP Produce Significant Fibrosis
Pancreatic fibrosis may develop as intralobular, perilobular, and a mixture of both intralobular and perilobular fibrosis.62,63 Both subtypes of fibrosis were seen in the current model with a predominance of intralobular septal fibrosis. Both trichrome and Sirius Red staining revealed the presence of collagen fibers around acinar cells, and between pancreatic lobules (Figure 5). Histological evidence paralleled increased extracellular matrix expression at mRNA and protein levels. In contrast, minimal morphological changes in the pancreas were identified in the rats fed ethanol alone, and a few changes were seen in CP1 and EP1 rats, even at 96 hours. However, with repeated cerulein treatments in alcohol-fed rats (EP3), a robust, patchy pattern of collagen deposition developed that was similar to early human ACP. Therefore, chronic alcohol feeding combined with repeated cerulein treatment results in a model of ACP that parallels the major aspects of the human disease.
Acknowledgments
We thank the Center for Human Genetics and Integrative Biology, University of Pittsburgh, for conducting real-time quantitative PCR and scan of the microarray slides; and Dr. Christopher Hanck for his comments on the manuscript.
Footnotes
Address reprint requests to David C. Whitcomb, M.D., Ph.D., UPMC Presbyterian, Mezzanine Level 2, C-Wing, 200 Lothrop St., Pittsburgh, PA 15213. E-mail: whitcomb@pitt.edu.
Supported by the Veteran’s Administration (merit review awards to D.C.W., P.K.E.) and the National Institutes of Health (grant R01 AA10855 to D.C.W.).
Current address for D.G. is Huntington Medical Group, PC, Huntington Station, NY.
References
- Etemad B, Whitcomb DC. Chronic pancreatitis: diagnosis, classification, and new genetic developments. Gastroenterology. 2001;120:682–707. doi: 10.1053/gast.2001.22586. [DOI] [PubMed] [Google Scholar]
- Lankisch PG, Lowenfels AB, Maisonneuve P. What is the risk of alcoholic pancreatitis in heavy drinkers? Pancreas. 2002;25:411–412. doi: 10.1097/00006676-200211000-00015. [DOI] [PubMed] [Google Scholar]
- Schneider A, Whitcomb DC, Singer MV. Animal models in alcoholic pancreatitis—what can we learn? Pancreatology. 2002;2:189–203. doi: 10.1159/000058033. [DOI] [PubMed] [Google Scholar]
- Gronroos JM, Aho HJ, Nevalainen TJ. Cholinergic hypothesis of alcoholic pancreatitis. Dig Dis. 1992;10:38–45. doi: 10.1159/000171342. [DOI] [PubMed] [Google Scholar]
- Korsten MA, Wilson JS, Haber PS. An overview of extrapancreatic factors in the pathogenesis of alcoholic pancreatitis. Alcohol Alcohol. 1994;2:S377–S384. [PubMed] [Google Scholar]
- Pitchumoni CS. Evaluation of etiological hypotheses and a study of early lesions in alcoholic pancreatitis. Alcohol Alcohol. 1994;2:S359–S363. [PubMed] [Google Scholar]
- Niebergall-Roth E, Harder H, Singer MV. A review: acute and chronic effects of ethanol and alcoholic beverages on the pancreatic exocrine secretion in vivo and in vitro. Alcohol Clin Exp Res. 1998;22:1570–1583. doi: 10.1111/j.1530-0277.1998.tb03951.x. [DOI] [PubMed] [Google Scholar]
- Kloppel G. Progression from acute to chronic pancreatitis. A pathologist’s view. Surg Clin North Am. 1999;79:801–814. doi: 10.1016/s0039-6109(05)70044-x. [DOI] [PubMed] [Google Scholar]
- Ammann RW, Buehler H, Bruehlmann W, Kehl O, Muench R, Stamm B. Acute (nonprogressive) alcoholic pancreatitis: prospective longitudinal study of 144 patients with recurrent alcoholic pancreatitis. Pancreas. 1986;1:195–203. [PubMed] [Google Scholar]
- Ammann RW, Muellhaupt B, Meyenberger C, Heitz PU. Alcoholic nonprogressive chronic pancreatitis: prospective long-term study of a large cohort with alcoholic acute pancreatitis (1976–1992). Pancreas. 1994;9:365–373. [PubMed] [Google Scholar]
- Whitcomb DC, Gorry MC, Preston RA, Furey W, Sossenheimer MJ, Ulrich CD, Martin SP, Gates LK, Amann ST, Toskes PP, Liddle R, McGrath K, Uomo G, Post JC, Ehrlich GD. Hereditary pancreatitis is caused by a mutation in the cationic trypsinogen gene. Nat Genet. 1996;14:141–145. doi: 10.1038/ng1096-141. [DOI] [PubMed] [Google Scholar]
- Gorry MC, Gabbaizedeh D, Furey W, Gates LK, Preston RA, Aston CE, Zhang Y, Ulrich C, Ehrlich GD, Whitcomb DC. Mutations in the cationic trypsinogen gene are associated with recurrent acute and chronic pancreatitis. Gastroenterology. 1997;113:1063–1068. doi: 10.1053/gast.1997.v113.pm9322498. [DOI] [PubMed] [Google Scholar]
- Whitcomb DC. Hereditary pancreatitis: new insights into acute and chronic pancreatitis. Gut. 1999;45:317–322. doi: 10.1136/gut.45.3.317. [DOI] [PMC free article] [PubMed] [Google Scholar]
- Gukovskaya AS, Vaquero E, Zaninovic V, Gorelick FS, Lusis AJ, Brennan ML, Holland S, Pandol SJ. Neutrophils and NADPH oxidase mediate intrapancreatic trypsin activation in murine experimental acute pancreatitis. Gastroenterology. 2002;122:974–984. doi: 10.1053/gast.2002.32409. [DOI] [PubMed] [Google Scholar]
- Demols A, Le Moine O, Desalle F, Quertinmont E, Van Laethem JL, Deviere J. CD4(+)T cells play an important role in acute experimental pancreatitis in mice. Gastroenterology. 2000;118:582–590. doi: 10.1016/s0016-5085(00)70265-4. [DOI] [PubMed] [Google Scholar]
- Ockenga J, Jacobs R, Kemper A, Benschop RJ, Schmidt RE, Manns MP. Lymphocyte subsets and cellular immunity in patients with chronic pancreatitis. Digestion. 2000;62:14–21. doi: 10.1159/000007772. [DOI] [PubMed] [Google Scholar]
- Hanck C, Rossol S, Singer MV. Immunological changes of mild acute pancreatitis in late-stage alcoholic chronic pancreatitis. Dig Dis Sci. 1999;44:1768–1773. doi: 10.1023/a:1018822101845. [DOI] [PubMed] [Google Scholar]
- Goecke H, Forssmann U, Uguccioni M, Friess H, Conejo-Garcia JR, Zimmermann A, Baggiolini M, Buchler MW. Macrophages infiltrating the tissue in chronic pancreatitis express the chemokine receptor CCR5. Surgery. 2000;128:806–814. doi: 10.1067/msy.2000.108613. [DOI] [PubMed] [Google Scholar]
- Koko V, Todorovic V, Nikolic JA, Glisic R, Cakic M, Lackovic V, Petronijevic L, Stojkovic M, Varagic J, Janic B. Rat pancreatic B-cells after chronic alcohol feeding. A morphometric and fine structural study. Histol Histopathol. 1995;10:325–337. [PubMed] [Google Scholar]
- Pandol SJ, Periskic S, Gukovsky I, Zaninovic V, Jung Y, Zong Y, Solomon TE, Gukovskaya AS, Tsukamoto H. Ethanol diet increases the sensitivity of rats to pancreatitis induced by cholecystokinin octapeptide. Gastroenterology. 1999;117:706–716. doi: 10.1016/s0016-5085(99)70465-8. [DOI] [PubMed] [Google Scholar]
- Tsukamoto H, Towner SJ, Yu GS, French SW. Potentiation of ethanol-induced pancreatic injury by dietary fat. Induction of chronic pancreatitis by alcohol in rats. Am J Pathol. 1988;131:246–257. [PMC free article] [PubMed] [Google Scholar]
- Li HS, Zhang JY, Thompson BS, Deng XY, Ford ME, Wood PG, Stolz DB, Eagon PK, Whitcomb DC. Rat mitochondrial ATP synthase ATP5G3: cloning and upregulation in pancreas after chronic ethanol feeding. Physiol Genomics. 2001;6:91–98. doi: 10.1152/physiolgenomics.2001.6.2.91. [DOI] [PubMed] [Google Scholar]
- Norton ID, Apte MV, Lux O, Haber PS, Pirola RC, Wilson JS. Chronic ethanol administration causes oxidative stress in the rat pancreas. J Lab Clin Med. 1998;131:442–446. doi: 10.1016/s0022-2143(98)90145-7. [DOI] [PubMed] [Google Scholar]
- Deng X, Wood PG, Eagon PK, Whitcomb DC. Chronic alcohol ingestion alters neurohormonal control of the rat pancreas. Pancreas. 1997;15:432. [Google Scholar]
- Lampel M, Kern HF. Acute interstitial pancreatitis in the rat induced by excessive doses of a pancreatic secretagogue. Virchows Arch A, Pathological Anat Histol. 1977;373:97–117. doi: 10.1007/BF00432156. [DOI] [PubMed] [Google Scholar]
- Van Laethem JL, Robberecht P, Resibois A, Deviere J. Transforming growth factor beta promotes development of fibrosis after repeated courses of acute pancreatitis in mice. Gastroenterology. 1996;110:576–582. doi: 10.1053/gast.1996.v110.pm8566606. [DOI] [PubMed] [Google Scholar]
- Lieber CS, DeCarli LM. Liquid diet technique of ethanol administration: 1989 update. Alcohol Alcohol. 1989;24:197–211. [PubMed] [Google Scholar]
- Deng X, Wood PG, Eagon PK, Whitcomb DC: Rapid adaptation of pancreatic exocrine function to short term alcohol feeding in rats. Pancreatology (in press) [DOI] [PubMed] [Google Scholar]
- Jung DH. Preparation and application of procion yellow starch for amylase assay. Clin Chem Acta. 1980;100:7–10. doi: 10.1016/0009-8981(80)90179-5. [DOI] [PubMed] [Google Scholar]
- Kalff JC, Schwarz NT, Walgenbach KJ, Schraut WH, Bauer AJ. Leukocytes of the intestinal muscularis: their phenotype and isolation. J Leukocyte Biol. 1998;63:683–691. doi: 10.1002/jlb.63.6.683. [DOI] [PubMed] [Google Scholar]
- Woessner JF., Jr The determination of hydroxyproline in tissue and protein samples containing small proportions of imino acids. Arch Biochem Biophys. 1961;93:440–447. doi: 10.1016/0003-9861(61)90291-0. [DOI] [PubMed] [Google Scholar]
- Lowry OH, Rosebrough NJ, Farr AL, Randall RJ. Protein measurement with the Folin phenol reagent. J Biol Chem. 1951;193:265–275. [PubMed] [Google Scholar]
- Nieto N, Friedman SL, Greenwel P, Cederbaum AI. CYP2E1-mediated oxidative stress induces collagen type I expression in rat hepatic stellate cells. Hepatology. 1999;30:987–996. doi: 10.1002/hep.510300433. [DOI] [PubMed] [Google Scholar]
- Strowski MZ, Sparmann G, Weber H, Fiedler F, Printz H, Jonas L, Goke B, Wagner AC. Caerulein pancreatitis increases mRNA but reduces protein levels of rat pancreatic heat shock proteins. Am J Physiol. 1997;273:G937–G945. doi: 10.1152/ajpgi.1997.273.4.G937. [DOI] [PubMed] [Google Scholar]
- Li H, Zhang J, Deng X, Thompson BS, Wood PG, Eagon PK, Whitcomb DC. Altered pancreatic gene expression in alcohol-fed rats using microarray analysis of stress and detoxification genes. Gastroenterology. 2001;120:A33. [Google Scholar]
- Li HS, Deng XY, Thompson BS, Zhang JY, Wood PG, Eagon PK, Whitcomb DC. Chronic ethanol consumption induces gene expression of pancreatic monitor peptide, but not SPINK1/PSTI-56, in rats. Pancreas. 2001;23:117–124. doi: 10.1097/00006676-200108000-00001. [DOI] [PubMed] [Google Scholar]
- Deng X, Elm MS, Eagon PK, Whitcomb DC. Altered expression of M3 and CCK-A receptors in pancreas with alcohol and cerulein hyper-stimulation. Pancreas. 2002;25:425. [Google Scholar]
- Singh M, LaSure MM, Bockman DE. Pancreatic acinar cell function and morphology in rats chronically fed an ethanol diet. Gastroenterology. 1982;82:425–434. [PubMed] [Google Scholar]
- Deng X, Wood PG, Eagon PK, Whitcomb DC. Chronic alcohol-induced alterations in the pancreatic secretory control mechanisms. Dig Dis Sci. 2004;45:805–819. doi: 10.1023/b:ddas.0000030093.25897.61. [DOI] [PubMed] [Google Scholar]
- Gronroos JM, Aho HJ, Nevalainen TJ. Effects of chronic alcohol intake and secretory stimulation on sodium taurocholate-induced pancreatic necrosis in the rat. J Surg Res. 1989;47:360–364. doi: 10.1016/0022-4804(89)90148-0. [DOI] [PubMed] [Google Scholar]
- Ponnappa BC, Marciniak R, Schneider T, Hoek JB, Rubin E. Ethanol consumption and susceptibility of the pancreas to cerulein-induced pancreatitis. Pancreas. 1997;14:150–157. doi: 10.1097/00006676-199703000-00007. [DOI] [PubMed] [Google Scholar]
- Schneider A, Whitcomb DC. Hereditary pancreatitis: a model for inflammatory diseases of the pancreas. Best Practice Res Clin Gastroenterol. 2002;16:347–363. doi: 10.1053/bega.2002.0311. [DOI] [PubMed] [Google Scholar]
- Steer ML, Glazer G, Manabe T. Direct effects of ethanol on exocrine secretion from the in vitro rabbit pancreas. Dig Dis Sci. 1979;24:769–774. doi: 10.1007/BF01317210. [DOI] [PubMed] [Google Scholar]
- Perkins PS, Rutherford RE, Pandol SJ. Effect of chronic ethanol feeding on digestive enzyme synthesis and mRNA content in rat pancreas. Pancreas. 1995;10:14–21. doi: 10.1097/00006676-199501000-00002. [DOI] [PubMed] [Google Scholar]
- Apte M, Norton I, Haber P, Applegate T, Korsten M, McCaughan G, Pirola R, Wilson J. The effect of ethanol on pancreatic enzymes—a dietary artifact? Biochim Biophys Acta. 1998;1379:314–324. doi: 10.1016/s0304-4165(97)00109-8. [DOI] [PubMed] [Google Scholar]
- Schmidt DN, Pandol SJ. Differing effects of ethanol on in vitro stimulated pancreatic enzyme secretion in ethanol-fed and control rats. Pancreas. 1990;5:27–36. doi: 10.1097/00006676-199001000-00004. [DOI] [PubMed] [Google Scholar]
- Solomon N, Solomon TE, Jacobson ED, Shanbour LL. Direct effects of alcohol on in vivo and in vitro exocrine pancreatic secretion and metabolism. Am J Dig Dis. 1974;19:253–260. doi: 10.1007/BF01072542. [DOI] [PubMed] [Google Scholar]
- Hirano H, Shimosegawa T, Meguro T, Shiga N, Koizumi M, Toyota T. Effects of ethanol on meal-stimulated secretion of pancreatic polypeptide and cholecystokinin: comparison of healthy volunteers, heavy drinkers, and patients with chronic pancreatitis. J Gastroenterol. 1996;31:86–93. doi: 10.1007/BF01211192. [DOI] [PubMed] [Google Scholar]
- Kono H, Nakagami M, Rusyn I, Connor HD, Stefanovic B, Brenner DA, Mason RP, Arteel GE, Thurman RG. Development of an animal model of chronic alcohol-induced pancreatitis in the rat. Am J Physiol. 2001;280:G1178–G1186. doi: 10.1152/ajpgi.2001.280.6.G1178. [DOI] [PubMed] [Google Scholar]
- Emmrich J, Weber I, Nausch M, Sparmann G, Koch K, Seyfarth M, Lohr M, Liebe S. Immunohistochemical characterization of the pancreatic cellular infiltrate in normal pancreas, chronic pancreatitis and pancreatic carcinoma. Digestion. 1998;59:192–198. doi: 10.1159/000007488. [DOI] [PubMed] [Google Scholar]
- Sparmann G, Behrend S, Merkord J, Kleine HD, Graser E, Ritter T, Liebe S, Emmrich J. Cytokine mRNA levels and lymphocyte infiltration in pancreatic tissue during experimental chronic pancreatitis induced by dibutyltin dichloride. Dig Dis Sci. 2001;46:1647–1656. doi: 10.1023/a:1010689117772. [DOI] [PubMed] [Google Scholar]
- Cavallini G, Frulloni L. Autoimmunity and chronic pancreatitis: a concealed relationship. J Pancreas. 2001;2:61–68. [PubMed] [Google Scholar]
- Hunger RE, Mueller C, Z’Graggen K, Friess H, Buchler MW. Cytotoxic cells are activated in cellular infiltrates of alcoholic chronic pancreatitis. Gastroenterology. 1997;112:1656–1663. doi: 10.1016/s0016-5085(97)70048-9. [DOI] [PubMed] [Google Scholar]
- Apte MV, Haber PS, Darby SJ, Rodgers SC, McCaughan GW, Korsten MA, Pirola RC, Wilson JS. Pancreatic stellate cells are activated by proinflammatory cytokines: implications for pancreatic fibrogenesis. Gut. 1999;44:534–541. doi: 10.1136/gut.44.4.534. [DOI] [PMC free article] [PubMed] [Google Scholar]
- Katz M, Carangelo R, Miller LJ, Gorelick F. Effect of ethanol on cholecystokinin-stimulated zymogen conversion in pancreatic acinar cells. Am J Physiol. 1996;270:G171–G175. doi: 10.1152/ajpgi.1996.270.1.G171. [DOI] [PubMed] [Google Scholar]
- Muller-Pillasch F, Menke A, Yamaguchi H, Elsasser HP, Bachem M, Adler G, Gress TM. TGFbeta and the extracellular matrix in pancreatitis. Hepato-Gastroenterol. 1999;46:2751–2756. [PubMed] [Google Scholar]
- Rongione AJ, Kusske AM, Kwan K, Ashley SW, Reber HA, McFadden DW. Interleukin 10 reduces the severity of acute pancreatitis in rats. Gastroenterology. 1997;112:960–967. doi: 10.1053/gast.1997.v112.pm9041259. [DOI] [PubMed] [Google Scholar]
- Riesle E, Friess H, Zhao L, Wagner M, Uhl W, Baczako K, Gold LI, Korc M, Buchler MW. Increased expression of transforming growth factor beta s after acute oedematous pancreatitis in rats suggests a role in pancreatic repair. Gut. 1997;40:73–79. doi: 10.1136/gut.40.1.73. [DOI] [PMC free article] [PubMed] [Google Scholar]
- Kato Y, Inoue H, Fujiyama Y, Bamba T. Morphological identification of and collagen synthesis by periacinar fibroblastoid cells cultured from isolated rat pancreatic acini. J Gastroenterol. 1996;31:565–571. doi: 10.1007/BF02355058. [DOI] [PubMed] [Google Scholar]
- Apte MV, Haber PS, Applegate TL, Norton ID, McCaughan GW, Korsten MA, Pirola RC, Wilson JS. Periacinar stellate shaped cells in rat pancreas: identification, isolation, and culture. Gut. 1998;43:128–133. doi: 10.1136/gut.43.1.128. [DOI] [PMC free article] [PubMed] [Google Scholar]
- Menke A, Yamaguchi H, Gress TM, Adler G. Extracellular matrix is reduced by inhibition of transforming growth factor beta1 in pancreatitis in the rat. Gastroenterology. 1997;113:295–303. doi: 10.1016/s0016-5085(97)70107-0. [DOI] [PubMed] [Google Scholar]
- Kennedy RH, Bockman DE, Uscanga L, Choux R, Grimaud JA, Sarles H. Pancreatic extracellular matrix alterations in chronic pancreatitis. Pancreas. 1987;2:61–72. doi: 10.1097/00006676-198701000-00010. [DOI] [PubMed] [Google Scholar]
- Ammann RW, Heitz PU, Kloppel G. The “two-hit” pathogenetic concept of chronic pancreatitis. Int J Pancreatol. 1999;25:251. [PubMed] [Google Scholar]


