Abstract
The inflammatory response is a protective process of the body to counteract xenobiotic penetration and injury, although in disease this response can become deregulated. There are endogenous biochemical pathways that operate in the host to keep inflammation under control. Here we demonstrate that the counterregulator annexin 1 (AnxA1) is critical for controlling experimental endotoxemia. Lipopolysaccharide (LPS) markedly activated the AnxA1 gene in epithelial cells, neutrophils, and peritoneal, mesenteric, and alveolar macrophages—cell types known to function in ex-perimental endotoxemia. Administration of LPS to AnxA1-deficient mice produced a toxic response characterized by organ injury and lethality within 48 hours, a phenotype rescued by exogenous application of low doses of the protein. In the absence of AnxA1, LPS generated a deregulated cellular and cytokine response with a marked degree of leukocyte adhesion in the microcirculation. Analysis of LPS receptor expression in AnxA1-null macrophages indicated an aberrant expression of Toll-like receptor 4. In conclusion, this study has detailed cellular and biochemical alterations associated with AnxA1 gene deletion and highlighted the impact of this protective circuit for the correct functioning of the homeostatic response to sublethal doses of LPS.
The systemic inflammatory response syndrome (SIRS) is characterized by a generalized activation of inflammatory processes normally activated in the host to counteract specific and localized inflammatory insults.1 Thus, cell activation at the site of the inflammatory insult or infection leads to release of cytokines and other proinflammatory mediators that ultimately produces a systemic response, the end-point of which is leukocyte infiltration into organs. If excessively activated, these cells produce oxygen-free radicals and other cytotoxic products leading to organ failure and possibly death.1,2
Despite this well accepted scenario, clinical trials of drugs aimed at blocking one or more specific proinflammatory mediators have failed to make an impact on the outcome of SIRS and other related pathologies, eg, shock. To explain this failure, an emerging concept proposes that the proinflammatory phase of SIRS might be required to trigger the endogenous protective mechanisms to restore homeostasis: the functional link between proinflammatory/detrimental versus anti-inflammatory/protective phases could explain the failure of therapies aiming simply to prevent or reduce the release and/or effects of proinflammatory mediators.1
Recent interest in the field of inflammation research has been boosted by the elucidation of mechanisms that operate in the host during the resolution phase of the inflammatory response, thereby assuring its strict time dependency and self-limiting nature.3 Whereas some of these mechanisms have been studied in models of acute resolving innate immune response3 it is unclear whether they impact on the more complex and altogether stronger inflammatory phenomena that are activated in SIRS or, experimentally, after administration of lipopolysaccharide (LPS).
One of the endogenous anti-inflammatory mediators active during the resolution phase of inflammation is the 37-kd protein annexin 1. Originally identified as a glucocorticoid-regulated protein, and termed lipocortin 1,4 cloning of the protein positioned it as the first member of a family of homologous proteins sharing the ability of binding acidic phospholipids in the presence of calcium ions.5 Human recombinant annexin 1 (hrANXA1) exerts an exquisite control on the process of leukocyte [predominantly neutrophil, polymorphonuclear leukocyte (PMN)] adhesion to the activated postcapillary endothelium of inflamed vascular beds.6 The proresolution effect of endogenous murine annexin 1 (AnxA1) is highlighted by the prolonged PMN recruitment observed in mice passively immunized against this protein.7 Coupled to recent report of a putative ANXA1 PMN receptor (that is shared with another anti-inflammatory mediator, the lipid lipoxin A4),8 it seems that the endogenous annexin 1 system could become fully operative within the microenvironment of an adherent PMN.9 Other cell types central to innate immunity and major sources of AnxA1 are epithelial cells and the macrophage,5 reported to be inhibitable by exogenous application of the protein.10,11 Conversely, absence of the AnxA1gene is associated with up-regulated cellular functions, often linked to a long-lasting degree of activation.12,13
In the present study we used AnxA1-null mice, recently shown to exhibit a stronger response in models of acute and chronic inflammation,14,15 to explore the protective role of this endogenous mediator in response to LPS administration. We report here an exquisite protective role for the protein because its absence sensitized mice to LPS-induced lethality. More importantly, using the LacZ gene as a reporter of mouse AnxA1 promoter activity,14 here we show for the first time that AnxA1 gene activation occurs in vivo in inflammatory cells and tissues concomitantly with the resolving phase of the inflammatory reaction.
Materials and Methods
Animals and Systemic Endotoxemia
Male wild-type littermate control and AnxA1-null mice (20 to 25 g body weight)14 were maintained on a standard chow pellet diet with tap water ad libitum. Animals were housed at a density of five animals per cage in a room with controlled lighting (lights on from 8:00 a.m. to 8:00 p.m.) in which the temperature was maintained at 21 to 23°C. Animal work was performed according to United Kingdom Home Office regulations (Guidance on the Operation of Animals, Scientific Procedures Act 1986).
Peritoneal and systemic inflammation was produced by injection of 10 mg/kg i.p. of Escherichia coli LPS (serotype 0111:B4, specific activity, >500,000 U/mg; Sigma-Aldrich Chemical Co., Poole, Dorset, UK). Control animals were injected intraperitoneally with an equal volume of phosphate-buffered saline (PBS). In survival studies, mice were monitored two times a day for up to 96 hours. A separate group of mice was treated with 10 ng of hrANXA1 given intraperitoneally together with LPS, and also at 6, 12, and 24 hours after LPS injection. For other investigations, 1-ml blood aliquots were taken under anesthesia and peritoneal cavities were washed with 3 ml of PBS containing 3 mmol/L ethylenediamine tetraacetic acid (EDTA); for tissue collection, hearts were perfused with 20 ml of PBS/EDTA, and fragments of trachea, lung, mesentery, and kidney were collected and processed as described below.
Biochemical Analyses
Cytokines
Aliquots of blood and peritoneal lavage fluids were centrifuged at 4000 or 400 × g for 10 minutes, respectively. Then, concentrations of tumor necrosis factor (TNF)-α, interleukin (IL)-6, and IL-10 of plasma samples or cell-free lavage fluids were measured using specific enzyme-linked immunosorbent assay kits purchased from R&D System (Abingdon, UK).
Blood Chemistry
Plasma samples were analyzed by a contract laboratory (Vetlab Services, Horsham, Sussex, UK). Liver integrity was assessed by measuring circulating aspartate aminotransferase and alanine aminotransferase (their presence being indicative of hepatocyte injury). Renal function was assessed by measuring serum levels of creatinine (an indicator of reduced glomerular filtration rate, and hence, renal failure), whereas plasma lipase served as an indicator of pancreas injury.
Cellular Analyses
Macrophage Signaling
Toll-like receptor 4 (TLR4) expression in peritoneal macrophages incubated with 1 μg/ml of LPS was determined by reverse transcriptase (RT)-polymerase chain reaction (PCR) analysis. Total RNA was extracted from peritoneal macrophages with classical protocols and used for first-strand cDNA synthesis with oligo-dT primers (Invitrogen, Paisley, UK) and AMV reverse transcriptase (Invitrogen) according to the manufacturer’s protocol. Semiquantitative reverse-transcriptase PCR was performed by using the primer set 5′-GCAATGTCTCTGGCAGGTGTA-3′ and 5′-CAAGGGATAAGAACGCTGAGA-3′ for TLR4, 5′-CAAGGGATAAGAACGCTGAGA-3′ and 5′-TGCAATCCTGTGGC-ATCCATGAAAC-3′ for β-actin and 30 to 34 cycles with 1 U of Taq polymerase (Promega). For each condition, twofold serial dilutions of cDNA equivalents obtained from the same number of cells were used. All PCR reactions were separated by 1% agarose gel in 1× TRIS acetic acid EDTA and were visualized by ethidium bromide staining. Cytokine contents in cell-free supernatants were determined by enzyme-linked immunosorbent assay (R&D System).
Cell Quantification
Peritoneal cell numbers were determined after 1:10 dilution of lavage fluid aliquots in Turk’s solution, by differential counting in a Neubauer chamber with a ×40 objective in a light microscope (Nikon, Tokyo, Japan). Circulating leukocyte numbers were obtained in a similar manner.
CD11b Expression on Circulating Leukocytes
A recently described whole blood protocol16 was used to monitor leukocyte CD11b expression, a marker of the activation state of circulating cells.
Histological Analyses
Peritoneal and blood cells as well as fragments of lung, mesentery, liver, and kidney were fixed in 4% paraformaldehyde, 0.5% glutaraldehyde, and 0.1 mol/L sodium phosphate buffer, pH 7.4, for 2 hours at 4°C. After, the fragments were washed in the same buffer, dehydrated through a graded series of ethanol, and embedded in LR Gold resin (London Resin Co., Reading, Berkshire, UK). Samples were then cut on an ultramicrotome (Reichert Ultracut; Leica, Vienna, Austria) and placed on glass slides for subsequent analysis.
Annexin-1 Gene Expression by X-Gal Stain
AnxA1-null mice have a LacZ gene encapsulated into the targeting construct14 to measure gene expression, cells and tissues from AnxA1-null mice were stained with the histochemical X-Gal technique. In the presence of β-galactosidase, this staining produces a characteristic Prussian blue color. Samples were fixed in 4% paraformaldehyde, 0.1 mol/L phosphate buffer, pH 7.3, for 1 hour at 4°C and washed with a rinse solution (0.1 mol/L phosphate buffer, pH 8, 2 mmol/L MgCl2, 0.1% Triton X-100), three times for 30 minutes each. Samples were stained overnight at 37°C using X-Gal staining solution (5 mmol/L potassium ferricyanide and 5 mmol/L potassium ferrocyanide in rinse buffer plus 1 mg/ml β-galactosidase in dimethylformamide). Fragments were then washed in PBS at room temperature and postfixed in 4% paraformaldehyde before embedding in LR Gold resin.
Data Handing and Statistical Analysis
Leukocyte counts are reported as mean ± SEM of n mice per group. Quantification of cell numbers in the tissue samples was performed with a ×40 objective counting cells in 100-μm2 areas (analyzing at least 10 distinct sections per animal). Densitometric analysis for X-Gal staining used an arbitrary scale ranging from 0 to 255 units. Statistical differences between groups were determined by analysis of variance followed, if significant, by the Bonferroni test. Survival data were analyzed by the Fisher’s exact test. In all cases a P value less than 0.05 was taken as significant.
Results
Annexin 1 Gene Activation
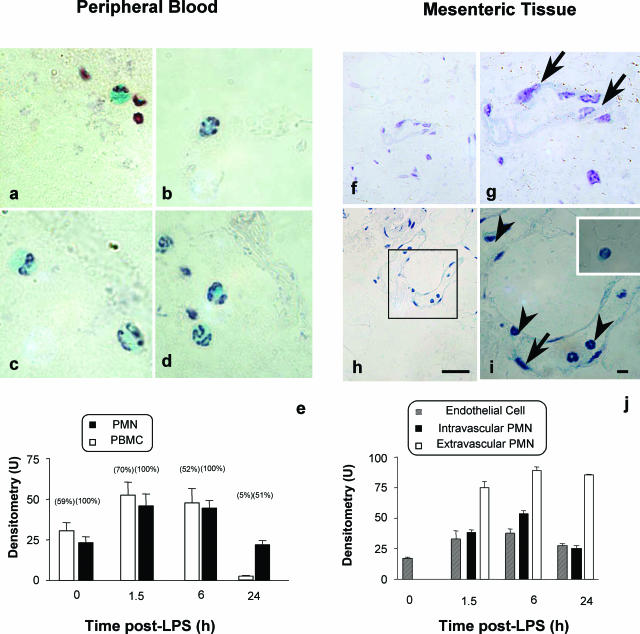
In the initial part of the study we monitored the temporal and spatial AnxA1 gene promoter activation. In resting conditions all circulating PMNs were positive for LacZ as visibly shown in Figure 1, a to d, whereas a lower percentage (∼60%) of monocytes and lymphocytes were also positive. However, LPS treatment induced a time-dependent increase (almost double) of X-Gal staining in blood PMNs in response to LPS at both 1.5 and 6 hours after treatment, with values returning to basal by 24 hours (cumulative data shown in Figure 1e). By this time point only ∼50% of circulating PMNs were positive, indicating, possibly, that bone marrow-derived PMNs might exhibit less AnxA1 gene promoter activity (Figure 1e). Circulating mononuclear cells also displayed transient increases in X-Gal staining, again with a rebound at 24 hours (Figure 1e).
Figure 1.
The AnxA1 gene is activated in blood and extravasating leukocytes. LacZ staining: AnxA1-null mice received 10 mg/kg of LPS intraperitoneally at time 0. At different time points after LPS, blood aliquots or mesenteric tissue were collected and samples processed for the X-Gal staining, with hematoxylin counterstaining, as described in the Materials and Methods. Blood cell analysis: a and b: monocyte (a) and neutrophil (b) staining at time 0; c and d: cells at 6 hours after LPS. Mesenteric tissue analysis: f and g: marginal staining in the endothelial cell layer (arrows) at time 0; h and i: example of intravascular leukocytes (arrowheads) adherent to the endothelial cells (arrow) and both were LacZ-positive (6 hours after LPS). Inset: Staining of a transmigrated leukocyte. e and j: The cumulative values from densitometric analysis for circulating blood cells, respectively. Numbers in brackets refer to the percentage of X-Gal-positive stain for each cell type. Data are mean ± SEM of five mice per group. *P < 0.05 versus corresponding littermate group values. Scale bars, 10 μm.
Tissue activation of AnxA1 gene promoter was monitored in the mesentery microcirculation. Whereas no major changes in endothelial X-Gal were detected up to 24 hours after LPS, the extent of staining in adherent PMNs reflected the values measured in other blood cells (Figure 1, compare e with j). In contrast, significantly higher expression (between 75 and 100 U) was measured in extravasated PMNs when compared to adherent (Figure 1j) or circulating (Figure 1e) cells (P < 0.05). This is visually shown in Figure 1, h and i, with control reactions being reported in Figure 1, f and g.
The same colorimetric reaction was used to monitor the AnxA1 gene promoter response in selected organs. Figure 2 reports data for the 6-hour time point. In the kidney glomerulum, mesangial cells were marginally positive for AnxA1 in control sections (Figure 2A), whereas, after LPS injection, X-Gal-positive staining could be detected in extravasated PMNs (Figure 2B). Similar, although to a more modest degree, was the response in the liver. The response in the lung was more intense. Control lung sections displayed X-Gal staining in the alveolar macrophage and the bronchial epithelium (Figure 2; F to H), and this was markedly up-regulated after LPS treatment, this time including also the extravasated PMNs (Figure 2; I to K). Table 1 reports the time course for X-Gal staining in selected organs and cells.
Figure 2.
Analysis of AnxA1 gene activation in representative organs. AnxA1-null mice received 10 mg/kg of LPS intraperitoneally at time 0 and organs were harvested at the 6-hour time point. Samples were processed for the X-Gal staining, and hematoxylin counterstaining, as described in the Materials and Methods. A and B: Kidney section showing AnxA1 gene expression on the glomerulum (arrows) before (A) and after (B) LPS. C: Liver section showing that in untreated mice hepatocytes were negative to X-Gal stain, whereas in D, after LPS administration, some hepatocytes and extravasated leukocytes displayed mild staining. F: In control lungs, epithelial cells and the alveolar macrophages (arrow) were positive for X-Gal staining. I: After LPS administration, marked coloration was obtained in the terminal bronchiole epithelium; J and K: in the bronchi, some adherent leukocytes (arrowhead) and alveolar macrophages (arrow) were also positive. Scale bars, 10 μm.
Table 1.
Annexin 1 Promoter Gene Activation in Mouse Organs during Endotoxemia
| Organ | Localization | Basal | Time after LPS (hours)
|
||
|---|---|---|---|---|---|
| 1.5 | 6 | 24 | |||
| Lung | Epithelium | 61 ± 9 | 29 ± 3* | 108 ± 9* | 37 ± 3 |
| Alveolar macrophage | 55 ± 4 | 60 ± 4 | 85 ± 9* | 52 ± 10 | |
| Intravascular leukocyte | 0 | 53 ± 3 | 61 ± 4 | 55 ± 5 | |
| Extravasated leukocyte | 0 | 0 | 105 ± 5 | 78 ± 3 | |
| Trachea | Epithelium | 33 ± 3 | 36 ± 3 | 37 ± 3 | 210 ± 11* |
| Kidney | Glomerulum | 22 ± 5 | 50 ± 3* | 47 ± 3* | 37 ± 5 |
| Liver | Hepatocytes | 0 | 25 ± 1 | 30 ± 3 | 38 ± 3 |
AnxA1-null mice received 10 mg/kg i.p. LPS at time 0, and organs were collected at the reported time points. Histological preparations and X-Gal staining were done as described in the Materials and Methods section. Values (densitometric units) are mean ± SEM of 10 tissue sections analyzed from five mice per group.
P < 0.05 versus time 0.
LPS-Induced Lethality
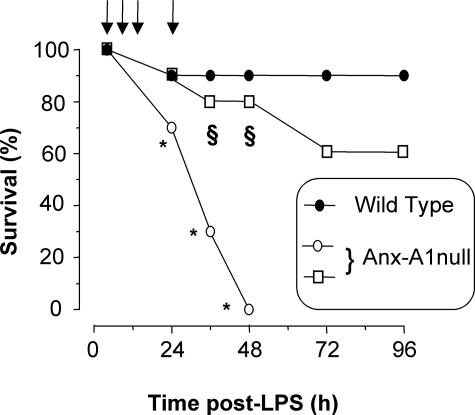
Treatment of mice with 10 mg/kg of LPS induced early clinical signs of SIRS, including lethargy, pyloerection, diarrhea, and tachypnea, which yielded little mortality (1 mouse of 10; Figure 3). In contrast, a high rate of mortality was observed in AnxA1-null mice, which was evident from 24 hours and reached 100% mortality by 48 hours. Application of hrANXA1 (10 ng given four times in the first 24 hours for a total of 40 ng or 1.08 pmol per mouse) restored most of the wild-type phenotype such that only three mice died and in a delayed manner (not significant versus wild-type values). Subsequent investigations were predominantly restricted to the first 24 hours after LPS, ie, when mortality of AnxA1-null mice begun.
Figure 3.
Modulation of mouse survival by AnxA1. Wild-type and AnxA1-null mice received 10 mg/kg of LPS intraperitoneally at time 0 and survival rate was monitored at 12-hour intervals up to 96 hours after LPS. A group of AnxA1-null mice was rescued by receiving 10 ng of hrANXA1 at time 0, 4, 8, and 24 hours (arrows) after LPS (□). Results are cumulated from three experiments with a total of 20 mice per group. *P < 0.01 versus corresponding wild-type value. §P < 0.05 versus AnxA1-null alone.
Plasma level markers of kidney, liver, and pancreas toxicity were not changed, or only mildly modified, in wild-type mice up to 24 hours after LPS (Figure 4; a to d). The only exception was liver alanine aminotransferase, which was transiently augmented at 6 hours after LPS (P < 0.05 versus time 0 values) (Figure 4c). In AnxA1-null mice basal values were identical to those measured in wild-type mice, however profoundly different kinetics were observed after LPS treatment. At the 24-hour time point all four markers under analysis were higher in the AnxA1-null mice, both respect to time 0 values and the correspondent values in wild-type mice (Figure 4).
Figure 4.
Serum markers of organ injury. Wild-type and AnxA1-null mice received 10 mg/kg of LPS intraperitoneally at time 0. Blood was collected at the reported time points and specific markers for kidney (creatinine), liver (aspartate aminotransferase, AST; alanine aminotransferase, ALT), and pancreas (lipase) injury determined. Data are mean ± SEM from five mice per genotype per time point. *P < 0.05 versus corresponding wild-type group values.
Cytokine and Cellular Profiles
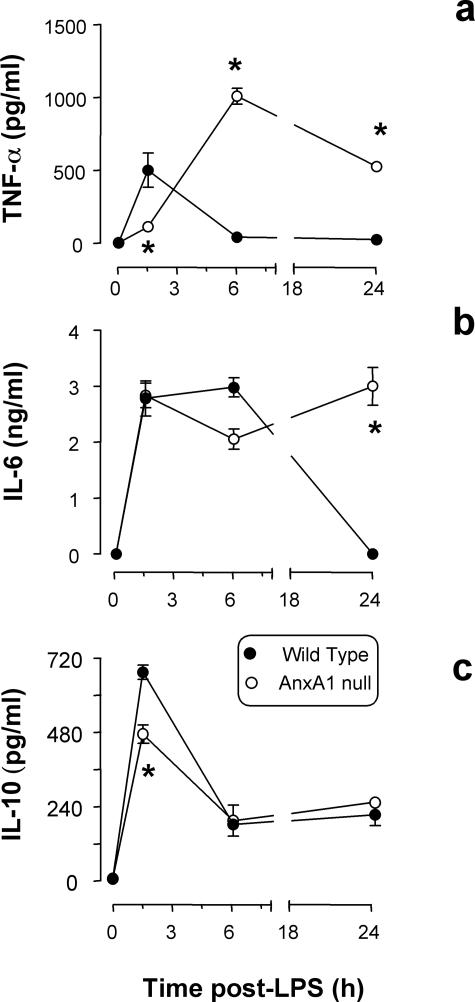
Figure 3 illustrates the values obtained for plasma cytokine contents. In wild-type mice, LPS provoked the expected transient increase in plasma TNF-α17 (Figure 5a), followed by changes in IL-6 and IL-10 (Figure 5, b and c). In AnxA1-null mice the cytokine response was delayed and did not resolve within the time frame under analysis. For instance, high TNF-α levels were measured at both 6 and 24 hours after LPS (Figure 5a). In the absence of endogenous AnxA1, the IL-6 response was equally protracted (24 hours after LPS, Figure 5b).
Figure 5.
Serum cytokine levels. Wild-type and AnxA1-null mice received 10 mg/kg of LPS intraperitoneally at time 0. Blood was collected at the reported time points and serum concentration of TNF-α (a), IL-6 (b), and IL-10 (c) determined. Results are from 10 mice per group. *P < 0.05 versus corresponding wild-type group values.
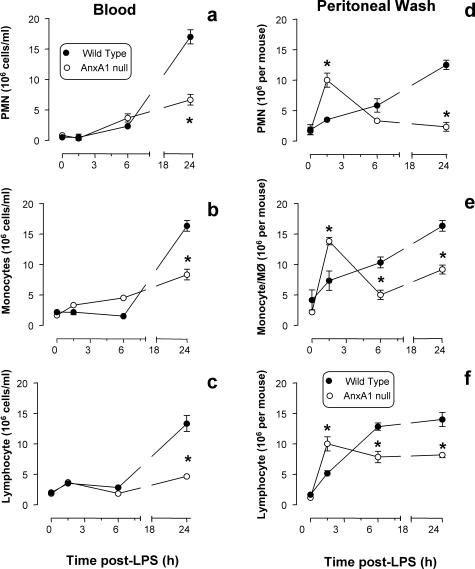
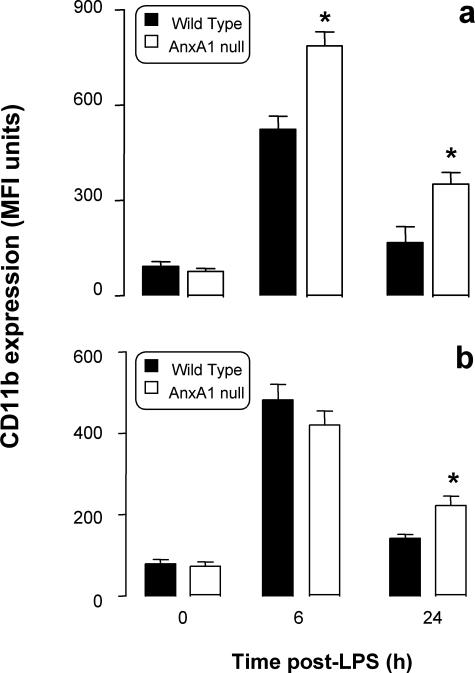
Similarly to cytokine release, profiles of cell trafficking were markedly altered in AnxA1-null mice. In wild-type mice, peritoneal leukocyte occurred with slow kinetics (Figure 6; d to f), and this local response was followed by blood leukocytosis, maximal at 24 hours (Figure 6; a to c). Different were the results obtained in AnxA1-null mice. Whereas no significant differences in resident peritoneal cells were detected, LPS injection provoked an intense and rapid influx of PMNs, monocytes, and lymphocytes (Figure 6; d to f); however after a peak at 1.5 hours, cellular trafficking ceased, probably with the exception of the lymphocytes (Figure 6f). Cell values at 24 hours were significantly lower than those measured in wild-type mice (Figure 6; d to f) possibly because of a less intense leukocytosis (Figure 6; a to c). Blood PMN counts were reduced by more than 50% in AnxA1-null mice at 24 hours after LPS (Figure 4a), and similar decreases were also measured for monocyte (Figure 6b) and lymphocyte counts (Figure 6c). Besides alteration in blood cell counts, AnxA1 cells displayed a significantly higher degree of activation in response to LPS, as assessed by CD11b expression (Figure 7). In wild-type mice LPS activated circulating PMNs (Figure 7a) and monocytes (Figure 7b), and in AnxA1-null mice this response was more marked and lasted longer (Figure 7).
Figure 6.
Kinetics of blood leukocytosis and peritoneal cell influx. Wild-type and AnxA1-null mice received 10 mg/kg of LPS intraperitoneally at time 0. At different time points after LPS, blood was collected and peritoneal cavities washed for quantification of neutrophil, monocyte, and lymphocyte values. Data are mean ± SEM from 10 mice per group. *P < 0.05 versus corresponding wild-type group values.
Figure 7.
CD11b expression on circulating leukocytes. Wild-type and AnxA1-null mice received 10 mg/kg of LPS intraperitoneally at time 0. At different time points after LPS, blood was collected and CD11 expression on PMNs (a) and monocytes (b) quantified by flow cytometry. Data are mean ± SEM from three experiments performed with two to three mice each. Basal CD11b expression was 98 ± 10 and 87 ± 8 median fluorescent units for wild-type and AnxA1-null PMNs, respectively, and 130 ± 10 and 120 ± 15 median fluorescent units of wild-type and AnxA1-null monocytes. *P < 0.05 versus corresponding wild-type group values.
Morphological Studies
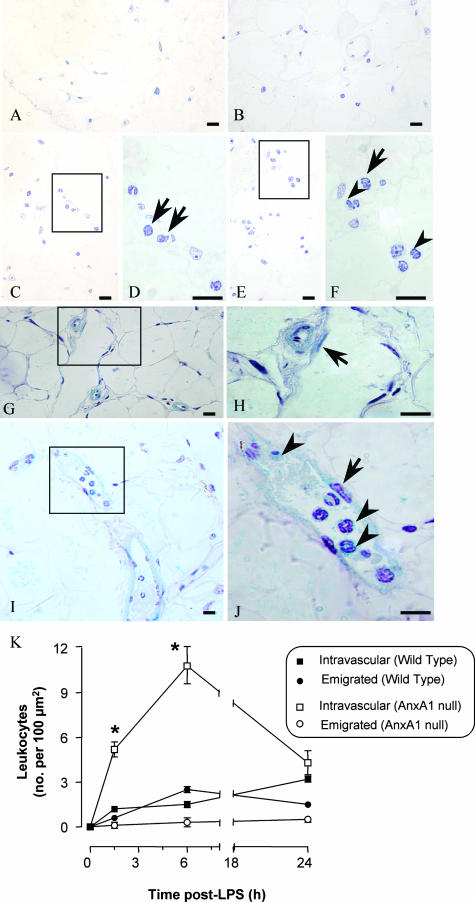
Cell counts in the mesenteric tissue indicated a marked degree of cell adhesion and emigration in the mesenteric microcirculation. LPS injection provoked cell influx in wild-type mice (Figure 8, C and D and E and F) whereas no blood cells were found in untreated mice (Figure 8, A and B). The same held true for AnxA1-null mice (Figure 8, G and J). Quantitative analysis of several mesenteric sections revealed a rapid and intense degree of leukocyte adhesion to the postcapillary venule endothelium of AnxA1-null mice (Figure 8K). This did not correspond to a higher degree of cell counts in the subendothelial matrix area. Deregulated leukocyte recruitment was also detected in the organs under analysis. Mice deficient in AnxA1 displayed a higher degree of leukocyte (predominantly PMNs at 1.5 to 6 hours, and monocytes at 24 hours) adhesion in kidney and lung microvessels with increments ranging from threefold to fivefold greater than the values measured in wild-type mice (Table 2). A similar phenomenon, although to a lower degree, was also observed in liver sinusoids (Table 2).
Figure 8.
Leukocyte infiltration into the mesenteric tissue. Wild-type and AnxA1-null mice received 10 mg/kg of LPS intraperitoneally at time 0. At different time points, mesenteries were collected and treated as described in the Materials and Methods (hematoxylin stain). A–F: Tissues from wild-type mice. A and B: Control tissue showing no leukocytes in the connective tissue; C–F: LPS-treated (6 hours) mesenteric tissue showing intravascular (arrows) and transmigrated leukocyte (arrowheads). G–J: AnxA1-null mice. G and H: Control sections with no leukocyte adhesion to the endothelial cells (arrow); I and J: marked degree of cell adhesion (arrowhead) to the endothelial vessels (arrow) as seen after LPS administration (6-hour time point). K: Semiquantitative analysis of the histological sections showing intravascular and extravascular leukocytes in wild-type mice and in AnxA1-null mice. Data are mean ± SEM from five mice per genotype per time point. *P < 0.05 versus corresponding wild-type group values. Scale bars, 10 μm.
Table 2.
Organ Infiltration of Blood-Borne Cells during Endotoxemia
| Organ/tissue | Genotype | Basal | Time after LPS (hours)
|
||
|---|---|---|---|---|---|
| 1.5 | 6 | 24 | |||
| Lung | Wild type | 0 | 9.3 ± 1.8 | 8.1 ± 1.7 | 10.4 ± 0.9 |
| AnxA1-null mice | 0 | 13.5 ± 1.5* | 7.6 ± 0.9 | 2.8 ± 0.5* | |
| Kidney | Wild type | 0 | 1.2 ± 0.5 | 1.5 ± 0.2 | 3.2 ± 0.2 |
| AnxA1-null mice | 0 | 1.1 ± 0.3 | 3.0 ± 1.3* | 0.8 ± 0.5* | |
| Liver | Wild type | 0 | 0.2 ± 0.2 | 0.2 ± 0.1 | 0.1 ± 0.1 |
| AnxA1-null mice | 0 | 0.6 ± 0.2* | 0.3 ± 0.1 | 0.1 ± 0.1 | |
Mice received 10 mg/kg i.p. LPS at time 0, and organs were collected at the reported time points. Histological preparations were done as described in the Materials and Methods section. Data (mean ± SEM) are reported as number of cells per 100 μm2 (1-μm sections) and are from five mice per group.
P < 0.05 versus respective wild-type group value.
Macrophage Activation
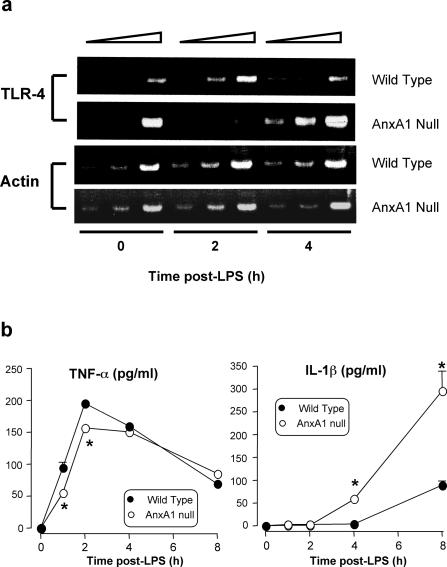
To correlate the increase in mortality of the AnxA1-null mice with the increased activation of inflammatory cells, we then monitored TLR4 mRNA expression in basal and LPS-activated macrophages. As shown in Figure 9a, in wild-type macrophages LPS provoked the expected TLR4 mRNA down-regulation that did not occur in AnxA1-null macrophages, since intense TLR4 mRNA was detected at 4 hours after stimulation. Interestingly, the profile of cytokine release mirrored the pattern of TLR4 expression, with a lower peak of TNF-α being measured early after LPS addition to AnxA1-null macrophages and an increased release of IL-1β at later time points (Figure 9b).
Figure 9.
TLR4 mRNA expression in peritoneal macrophages and in vitro cytokine release. Analysis of LPS-induced TLR4 expression and cytokine production in macrophages from wild-type and AnxA1-null mice. a: Analysis of TLR4 and β-actin expression by RT-PCR in peritoneal macrophages stimulated with LPS (concentration 1 μg/ml) up to 4 hours. At each time point twofold serial dilutions of cDNA equivalents obtained from the same number of cells were used (expressly, 0.5, 1, and 2 μg cDNA). b: TNF-α and IL-1 production profile of peritoneal macrophages collected from wild-type or AnxA1-null mice, and stimulated with LPS as in a. Values are mean ± SE of n = 3 to 4 independent determinations. *P < 0.05 versus corresponding wild-type group values.
Discussion
SIRS is a complex multiprocess response of the host caused by bacterial infection and experimentally reproduced by injecting LPS. Both local and systemic responses are then activated leading to a partially characterized cascade of events, including release of cytokines (of which TNF-α seems to be the most significant) and generalized activation of the microcirculation. Dysregulated leukocyte activation and recruitment then occurs leading to the first signs of organ injury that may be followed by multiple organ failure with consequent lethality.1,2 In terms of pathophysiological mechanisms, the initial hypothesis of the cytokine storm proposed that the intense local and systemic release of cytokines would lead to generalized and uncontrolled activation of inflammatory processes ultimately producing injurious effects.1 However, the markedly high cytokine levels measured experimentally after high-dose LPS injection are rarely seen in clinical syndrome of SIRS. More recently, the contrasting possibility that the cytokine storm could be protective by activating the host anti-inflammatory proresolving response has been proposed.1,18 This putative functional link between the initial proinflammatory phase leading to the anti-inflammatory/protective phase, is also reinforced by the fact that anti-cytokine therapy sometimes can worsen, rather than mitigate, SIRS outcome.19
Recent analysis of clinical data indicate that anti-cytokine therapy fails predominantly when the risk of death is ∼20 to 30% of the SIRS patient population.20 Interestingly, in this specific condition, which represents the majority of clinical cases, low-dose glucocorticoids are proven to be beneficial.21 Administration of low-dose glucocorticoids to humans22 and rodents23 has long been known to increase cell-associated annexin 1 protein contents in circulating leukocytes. Thus, here we set out to investigate the effect of AnxA1 gene deficiency in an experimental condition characterized by a low degree of mortality, produced experimentally by administering 10 mg/kg of LPS.
In this study we used genetically modified mice to reveal a pivotal role for the anti-inflammatory mediator AnxA1 after experimental endotoxemia. Thus, after LPS administration, the AnxA1 gene is switched on in a discreet and temporally regulated manner. This process is so important that in its absence a marked dysregulation of local and systemic inflammatory parameters occurs; in several organs, the intense cell activation within the microvasculature (evident by marked cell adhesion and gene activation in extravasated cells) that ensues is incompatible with survival. Importantly, this phenotype could be significantly rescued by systemic administration of small doses of hrANXA1.
In wild-type mice, LPS produced transient changes in plasma markers of organ injury as well as of specific cytokine levels, causing the classical early TNF-α response.17 Endogenous AnxA1 plays a major role in assuring the transient profile of this response since, its absence, prolonged and/or more marked elevation of these plasma proteins was measured. Markers of organ injuries were significantly higher in the AnxA1-null mice and this was paralleled by greater mortality. Recent studies have addressed the effects of endogenous AnxA1 on the specific responses associated with LPS treatment. Initially, the protective property of dexamethasone on LPS-induced hypotension and iNOS induction in the rat was partially reverted by anti-AnxA1 antisera.24 We have subsequently used a mouse model to demonstrate that administration of 1 mg/kg of LPS augmented tissue protein and mRNA expression of AnxA1.25 More recently, basal iNOS expression in the lung of AnxA1-null mice has been reported.14
Experimental endotoxemia is characterized by a marked degree of leukocyte activation within the vasculature associated with a characteristic reduction in white blood cell emigration. LPS produces PMN trapping in the lung and in other microvascular beds, as a result of the intravascular cell activation and the well-described phenomenon of cell stiffening.26,27 Once this marked intravascular activation takes place, it precludes white blood cell egress from the vessels into the tissue.28 This might be due, at least partially, to LPS signaling overriding the more discreet local directional signaling produced by leukocyte chemoattractants29 and may be an escape process evolved by bacteria to evade the host response. Indeed, a modest egress of blood-borne cells outside the mesenteric postcapillary venule was detected in both genotypes. AnxA1 deficiency produced even further dysregulation indicating its important counterregulatory role. In AnxA1-null mice, LPS produced rapid (90 minutes) cell extravasation into the peritoneal cavity that quickly subsided. This was in contrast to the slow and steadily increasing extravasation detected in wild-type mice, and was negatively mirrored by LPS white blood cell profiles in the blood. Interestingly, all white blood cell subtypes were affected by AnxA1 deficiency. Whereas a direct effect of the endogenous protein on PMN and mono-cyte profiles30,31 could be foreseen, it is less clear how AnxA1 could modulate lymphocytosis and lymphocyte recruitment.32
Besides cell count profiles, AnxA1 deficiency was associated with altered kinetics and activation state of circulating PMNs and monocytes, as determined by measuring plasma membrane CD11b levels. This effect is in line with the inhibitory properties of exogenously applied hrANXA1 on human and rodent PMN and monocyte activation,11,31 in some cases also demonstrated for glucocorticoids.33,34 Some studies have recently addressed the effects of AnxA1 gene deficiency on inflammatory cell activation. Regarding the resident macrophage, we have recently highlighted a stimulus-specific defect in phagocytosis.13 Moreover, lung fibroblasts prepared from AnxA1-null mice also exhibit higher susceptibility to activation.12
The final part of the study focused on two novel aspects addressing, on one hand, potential alterations in LPS molecular mechanism due to AnxA1 gene deficiency and, on the other hand, monitoring AnxA1 gene expression in a time and spatial manner. The majority of phenomena associated with experimental SIRS are due to LPS activation of TLR4;35 this is particularly true for PMN responses such as trapping in the lung and the defect in extravasation36 as well as macrophage activation.35,37 Macrophages taken from AnxA1-null mice had a dysregulated expression of TLR4 (but not TLR2 mRNA; F.D.A., unpublished observation). In particular, there was an evident lack of receptor mRNA down-regulation after exposure to LPS, a phenomenon described for mouse TLR4.37 The possible cell signaling consequences of this fact are still unclear, because preliminary experiments did not reveal specific changes in the degree of mitogen-activated protein kinase activation (unpublished data).
Finally, AnxA1 gene activation was monitored using the LacZ reporter gene14 and by performing histological determinations for X-Gal staining. The data obtained indicate the existence of a strict time and spatial relationship for expression of this homeostatic mediator. After intraperitoneal LPS, resident macrophages in the peritoneum are probably the first cells to strongly activate this gene, followed immediately after by the extravasated PMNs. Extravasated PMNs in the mesenteric subendothelial space had lighted on the AnxA1 gene more than intravascular PMNs adherent to the endothelial vessel wall. The same staining approach allowed us to monitor AnxA1 gene expression in circulating leukocytes, and the pattern observed (high expression in PMNs and monocytes, but less so in lymphocytes) is congruent with the protein expression data reported for human38 and mouse23 blood cells.
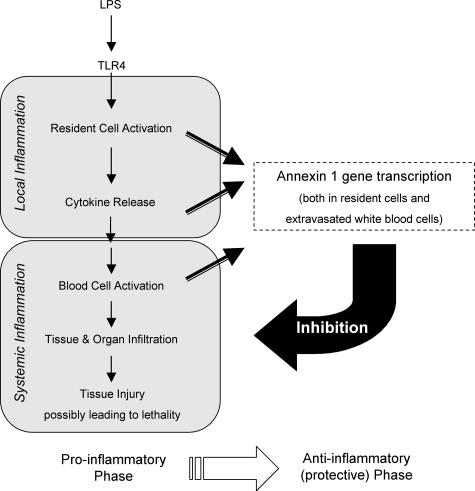
LPS injection caused distant organ AnxA1 gene activation: cells previously shown to express AnxA1 protein displayed higher basal AnxA1 gene activation and responded more intensively to LPS. In particular epithelial cells, PMNs, and macrophages (both peritoneal and alveolar) were strongly positive. There is ample literature that has studied, throughout the years, the pharmacological effects of this protein and its peptido-mimetics on specific responses of these cell types, both in vitro and in vivo.5 However, this is the first time that cellular AnxA1 gene expression could been monitored in a systematic manner during an on-going inflammatory response. The results obtained indicate that regular AnxA1 levels are required to achieve an appropriate activation of cells pivotal in the local and systemic response to LPS, these being the resident epithelial cells and the macrophages as well as circulating PMNs and monocytes. It is not surprising, then, that this mediator is a major homeostatic player in the complex phenomena that occur during a resolving systemic inflammatory response. Figure 10 reports the pathways activated by LPS, in a schematic manner, and shows how they could become deregulated by annexin 1 absence.
Figure 10.
Schematic representation of the events occurring in experimental endotoxemia. The model proposed indicates a functional link between the proinflammatory phase of the local and systemic response to LPS, and the activation of the protective/anti-inflammatory phase. Based on the results presented here, highlighted is AnxA1 activation in resident cells (macrophages and epithelial cells, for instance) as well as in extravasated PMNs, a phenomenon that follows a precise time dependency and is crucial for animal survival. See Discussion for more details.
Although more detailed investigations are warranted, this first study indicates an exquisite protective role for AnxA1 gene in experimental endotoxemia. The phenotype we reported here is reminiscent of recent clinical re-evaluations of sepsis treatment1,20 and suggests that these data could be relevant for designing new therapeutic interventions to control SIRS and related pathologies.
Footnotes
Address reprint requests to Mauro Perretti, The William Harvey Research Institute, Centre of Biochemical Pharmacology, Queen Mary School of Medicine and Dentistry, Charterhouse Square, London, EC1M 6BQ, UK. E-mail: m.perretti@qmul.ac.uk.
Supported by the Arthritis Research Campaign UK (senior fellowship 15755 to M.P.); Fundação de Amparo a Pesquisa do Estado de São Paulo (FAPESP), Brazil (03/11292-0 to S.M.O. and Ph.D. studentship 02/09920-0 to A.S.D.); Conselho Nacional de Desenvolvimento Científico e Tecnológico (CNPq), Brazil (300943/1994-6 to S.M.O.); Coordenação de Aperfeiçoamento de Pessoal de Nível Superior (CAPES), Brazil (Ph.D. sandwich studenship BEX0223/03-4 to A.S.D.); the Nuffield Foundation UK (Ph.D. studentship from Oliver Bird Fund to S.Y.); Wellcome Trust (principal research fellowship to R.J.F.), and the Medical Research Council UK (to F.D.A.).
This article has a related commentary, Am J Pathol 2005, 166:1581–1583, published in this issue.
References
- Hotchkiss RS, Karl IE. The pathophysiology and treatment of sepsis. N Engl J Med. 2003;348:138–150. doi: 10.1056/NEJMra021333. [DOI] [PubMed] [Google Scholar]
- Riedemann NC, Guo RF, Ward PA. Novel strategies for the treatment of sepsis. Nat Med. 2003;9:517–524. doi: 10.1038/nm0503-517. [DOI] [PubMed] [Google Scholar]
- Gilroy DW, Lawrence T, Perretti M, Rossi AG. Inflammatory resolution: new opportunities for drug discovery. Nat Rev Drug Discov. 2004;3:401–416. doi: 10.1038/nrd1383. [DOI] [PubMed] [Google Scholar]
- Flower RJ. Lipocortin and the mechanism of action of the glucocorticoids. Br J Pharmacol. 1988;94:987–1015. doi: 10.1111/j.1476-5381.1988.tb11614.x. [DOI] [PMC free article] [PubMed] [Google Scholar]
- Gerke V, Moss SE. Annexins: from structure to function. Physiol Rev. 2002;82:331–371. doi: 10.1152/physrev.00030.2001. [DOI] [PubMed] [Google Scholar]
- Lim LH, Solito E, Russo-Marie F, Flower RJ, Perretti M. Promoting detachment of neutrophils adherent to murine postcapillary venules to control inflammation: effect of lipocortin 1. Proc Natl Acad Sci USA. 1998;95:14535–14539. doi: 10.1073/pnas.95.24.14535. [DOI] [PMC free article] [PubMed] [Google Scholar]
- Perretti M, Croxtall JD, Wheller SK, Goulding NJ, Hannon R, Flower RJ. Mobilizing lipocortin 1 in adherent human leukocytes downregulates their transmigration. Nat Med. 1996;22:1259–1262. doi: 10.1038/nm1196-1259. [DOI] [PubMed] [Google Scholar]
- Perretti M, Chiang N, La M, Fierro IM, Marullo S, Getting SJ, Solito E, Serhan CN. Endogenous lipid- and peptide-derived anti-inflammatory pathways generated with glucocorticoid and aspirin treatment activate the lipoxin A4 receptor. Nat Med. 2002;8:1296–1302. doi: 10.1038/nm786. [DOI] [PMC free article] [PubMed] [Google Scholar]
- Damazo A, Paul-Clark MJ, Straus AH, Takahashi HK, Perretti M, Oliani SM. Analysis of annexin 1 expression in rat trachea: study of the mast cell heterogeneity. Annexins. 2004;1:12–18. [Google Scholar]
- Croxtall JD, Flower RJ. Lipocortin 1 mediates dexamethasone-induced growth arrest of the A549 lung adenocarcinoma cell line. Proc Natl Acad Sci USA. 1992;89:3571–3575. doi: 10.1073/pnas.89.8.3571. [DOI] [PMC free article] [PubMed] [Google Scholar]
- Maridonneau-Parini I, Errasfa M, Russo-Marie F. Inhibition of O2− generation by dexamethasone is mimicked by lipocortin I in alveolar macrophages. J Clin Invest. 1989;83:1936–1940. doi: 10.1172/JCI114101. [DOI] [PMC free article] [PubMed] [Google Scholar]
- Croxtall JD, Gilroy DW, Solito E, Choudhury Q, Ward BJ, Buckingham JC, Flower RJ. Attenuation of glucocorticoid functions in an Anx-A1−/− cell line. Biochem J. 2003;371:927–935. doi: 10.1042/BJ20021856. [DOI] [PMC free article] [PubMed] [Google Scholar]
- Yona S, Buckingham JC, Perretti M, Flower RJ. Stimulus-specific defect in the phagocytic pathways of annexin 1 null macrophages. Br J Pharmacol. 2004;142:890–898. doi: 10.1038/sj.bjp.0705858. [DOI] [PMC free article] [PubMed] [Google Scholar]
- Hannon R, Croxtall JD, Getting SJ, Roviezzo F, Yona S, Paul-Clark MJ, Gavins FN, Perretti M, Morris JF, Buckingham JC, Flower RJ. Aberrant inflammation and resistance to glucocorticoids in annexin 1−/− mouse. FASEB J. 2003;17:253–255. doi: 10.1096/fj.02-0239fje. [DOI] [PubMed] [Google Scholar]
- Yang YH, Morand EF, Getting SJ, Paul-Clark MJ, Liu DL, Yona S, Hannon R, Buckingham JC, Perretti M, Flower RJ. Modulation of inflammation and response to dexamethasone by annexin-1 in antigen-induced arthritis. Arthritis Rheum. 2004;50:976–984. doi: 10.1002/art.20201. [DOI] [PubMed] [Google Scholar]
- Gavins FN, Yona S, Kamal AM, Flower RJ, Perretti M. Leukocyte antiadhesive actions of annexin 1: ALXR- and FPR-related anti-inflammatory mechanisms. Blood. 2003;101:4140–4147. doi: 10.1182/blood-2002-11-3411. [DOI] [PubMed] [Google Scholar]
- Beutler B, Cerami A. Cachectin and tumour necrosis factor as two sides of the same biological coin. Nature. 1986;320:584–588. doi: 10.1038/320584a0. [DOI] [PubMed] [Google Scholar]
- Munford RS, Pugin J. Normal responses to injury prevent systemic inflammation and can be immunosuppressive. Am J Respir Crit Care Med. 2001;163:316–321. doi: 10.1164/ajrccm.163.2.2007102. [DOI] [PubMed] [Google Scholar]
- Fisher CJ, Jr, Agosti JM, Opal SM, Lowry SF, Balk RA, Sadoff JC, Abraham E, Schein RM, Benjamin E. Treatment of septic shock with the tumor necrosis factor receptor: Fc fusion protein. The Soluble TNF Receptor Sepsis Study Group. N Engl J Med. 1996;334:1697–1702. doi: 10.1056/NEJM199606273342603. [DOI] [PubMed] [Google Scholar]
- Eichacker PQ, Parent C, Kalil A, Esposito C, Cui X, Banks SM, Gerstenberger EP, Fitz Y, Danner RL, Natanson C. Risk and the efficacy of antiinflammatory agents: retrospective and confirmatory studies of sepsis. Am J Respir Crit Care Med. 2002;166:1197–1205. doi: 10.1164/rccm.200204-302OC. [DOI] [PubMed] [Google Scholar]
- Prigent H, Maxime V, Annane D. Clinical review: corticotherapy in sepsis. Crit Care. 2004;8:122–129. doi: 10.1186/cc2374. [DOI] [PMC free article] [PubMed] [Google Scholar]
- Goulding NJ, Godolphin JL, Sharland PR, Peers SH, Sampson M, Maddison PJ, Flower RJ. Anti-inflammatory lipocortin 1 production by peripheral blood leucocytes in response to hydrocortisone. Lancet. 1990;335:1416–1418. doi: 10.1016/0140-6736(90)91445-g. [DOI] [PubMed] [Google Scholar]
- Perretti M, Flower RJ. Measurement of lipocortin 1 levels in murine peripheral blood leukocytes by flow cytometry: modulation by glucocorticoids and inflammation. Br J Pharmacol. 1996;118:605–610. doi: 10.1111/j.1476-5381.1996.tb15444.x. [DOI] [PMC free article] [PubMed] [Google Scholar]
- Wu C-C, Croxtall JD, Perretti M, Bryant CE, Thiemermann C, Flower RJ, Vane JR. Lipocortin 1 mediates the inhibition by dexamethasone of the induction by endotoxin of nitric oxide synthase in the rat. Proc Natl Acad Sci USA. 1995;92:3473–3477. doi: 10.1073/pnas.92.8.3473. [DOI] [PMC free article] [PubMed] [Google Scholar]
- de Coupade C, Ajuebor MN, Russo-Marie F, Perretti M, Solito E. Cytokine modulation of liver annexin 1 expression during experimental endotoxemia. Am J Pathol. 2001;159:1435–1443. doi: 10.1016/S0002-9440(10)62530-8. [DOI] [PMC free article] [PubMed] [Google Scholar]
- Epstein FH. Tissue destruction by neutrophils. N Engl J Med. 1989;320:365–376. doi: 10.1056/NEJM198902093200606. [DOI] [PubMed] [Google Scholar]
- Wagner JG, Roth RA. Neutrophil migration during endotoxemia. J Leukoc Biol. 1999;66:10–24. doi: 10.1002/jlb.66.1.10. [DOI] [PubMed] [Google Scholar]
- Ferri LE, Pascual J, Seely AJ, Giannias B, Christou NV. Intra-abdominal sepsis attenuates local inflammation-mediated increases in microvascular permeability at remote sites in mice in vivo. Surgery. 2004;135:187–195. doi: 10.1016/j.surg.2003.08.009. [DOI] [PubMed] [Google Scholar]
- Heit B, Tavener S, Raharjo E, Kubes P. An intracellular signaling hierarchy determines direction of migration in opposing chemotactic gradients. J Cell Biol. 2002;159:91–102. doi: 10.1083/jcb.200202114. [DOI] [PMC free article] [PubMed] [Google Scholar]
- Bishop CR, Athens JW, Boggs DR, Warner HR, Cartwright GE, Wintrobe MM. Leukokinetic studies. XIII. A non-steady-state kinetic evaluation of the mechanism of cortisone-induced granulocytosis. J Clin Invest. 1968;47:249–260. doi: 10.1172/JCI105721. [DOI] [PMC free article] [PubMed] [Google Scholar]
- Zouki C, Ouellet S, Filep JG. The anti-inflammatory peptides, antiflammins, regulate the expression of adhesion molecules on human leukocytes and prevent neutrophil adhesion to endothelial cells. FASEB J. 2000;14:572–580. doi: 10.1096/fasebj.14.3.572. [DOI] [PubMed] [Google Scholar]
- Pitzalis C, Pipitone N, Bajocchi G, Hall M, Goulding N, Lee A, Kingsley G, Lanchbury J, Panay G. Corticosteroids inhibit lymphocyte binding to endothelium and intercellular adhesion: an additional mechanism for their anti-inflammatory and immunosuppressive effect. J Immunol. 1997;158:5007–5016. [PubMed] [Google Scholar]
- Filep JG, Delalandre A, Payette Y, Foldes-Filep E. Glucocorticoid receptor regulates expression of L-selectin and CD11/CD18 on human neutrophils. Circulation. 1997;96:295–301. doi: 10.1161/01.cir.96.1.295. [DOI] [PubMed] [Google Scholar]
- Lim LH, Flower RJ, Perretti M, Das AM. Glucocorticoid receptor activation reduces CD11b and CD49d levels on murine eosinophils: characterization and functional relevance. Am J Respir Cell Mol Biol. 2000;22:693–701. doi: 10.1165/ajrcmb.22.6.3890. [DOI] [PubMed] [Google Scholar]
- Poltorak A, He X, Smirnova I, Liu MY, Van Huffel C, Du X, Birdwell D, Alejos E, Silva M, Galanos C, Freudenberg M, Ricciardi-Castagnoli P, Layton B, Beutler B. Defective LPS signaling in C3H/HeJ and C57BL/10ScCr mice: mutations in Tlr4 gene. Science. 1998;282:2085–2088. doi: 10.1126/science.282.5396.2085. [DOI] [PubMed] [Google Scholar]
- Yipp BG, Andonegui G, Howlett CJ, Robbins SM, Hartung T, Ho M, Kubes P. Profound differences in leukocyte-endothelial cell responses to lipopolysaccharide versus lipoteichoic acid. J Immunol. 2002;168:4650–4658. doi: 10.4049/jimmunol.168.9.4650. [DOI] [PubMed] [Google Scholar]
- Nomura F, Akashi S, Sakao Y, Sato S, Kawai T, Matsumoto M, Nakanishi K, Kimoto M, Miyake K, Takeda K, Akira S. Cutting edge: endotoxin tolerance in mouse peritoneal macrophages correlates with down-regulation of surface toll-like receptor 4 expression. J Immunol. 2000;164:3476–3479. doi: 10.4049/jimmunol.164.7.3476. [DOI] [PubMed] [Google Scholar]
- Morand EF, Hutchinson P, Hargreaves A, Goulding NJ, Boyce NW, Holdsworth S. Detection of intracellular lipocortin 1 in human leukocyte subsets. Clin Immunol Immunopathol. 1995;76:195–202. doi: 10.1006/clin.1995.1115. [DOI] [PubMed] [Google Scholar]


