Abstract
Pathological alterations of renal function in insulin-dependent diabetes have been attributed to numerous factors, including adenosine. This study examined the expression levels of adenosine receptors (ARs) in the kidney of the streptozotocin-induced diabetic rat. In the diabetic kidney A1-AR mRNA levels increased 1.7- and 2.8-fold in cortex and medulla, respectively. This was accompanied by increased A1-AR protein levels in membranes of kidney cortex (1.5-fold) and medulla (threefold). A1-AR immunoreactivity increased strongly along medullar tubules especially in the collecting duct. The levels of A2a-AR mRNA increased twofold in diabetic kidney cortex but remained unchanged in medulla; however, A2a-AR protein levels increased more than threefold in cortex. Immunohistochemistry showed increased A2a-AR immunoreactivity in luminal membranes of cortical collecting ducts and in epithelial cells of preglomerular vessels. There were no significant changes in A2b-AR expression in diabetic kidney except in medullar membranes, where the receptor protein content decreased by 60%. A3-AR mRNA levels in diabetic kidney remained unchanged, but membrane-associated A3-AR protein levels increased by 70% in diabetic kidney cortex and decreased by 80% in medulla. These changes in ARs genes expression, receptor protein content, and cellular and tissue distribution, correspond to abnormalities characteristic of the diabetic kidney, suggesting involvement in pathogenesis of diabetic nephropathy.
Kidney disease is one of the leading hallmarks of human diabetes. It is characterized by persistent proteinuria, hypertension, and progressive loss of renal function.1 These changes are preceded by glomerular hyperfiltration, which is an early symptom in the development of diabetic nephropathy.2,3 Pathological changes of renal function in insulin-dependent diabetes have been attributed to numerous factors, including impaired action of angiotensin II, NO, prostaglandins, and adenosine.4–7 Adenosine in the kidney plays a broad regulatory role including modulation of renal blood flow, glomerular filtration rate, hormone and neurotransmitter release, transport function, and urine flow.8 Therefore, any changes in its action may significantly affect function of this organ.
Adenosine is formed both in the extra- and intracellular space and exerts its physiological effect by coupling to cell-surface receptors, namely A1, A2a, A2b, and A3.9 The affinity for adenosine varies between receptors; thus its activation depends on adenosine concentration. The level of adenosine depends on its metabolism and transport across plasma membranes. Our previous studies showed that, except for ENT2, the expression level of nucleoside transporters in kidney of diabetic rats was not altered.10 Moreover, the expression level of adenosine kinase in the diabetic kidney was greatly reduced, suggesting that the turnover of the adenosine-AMP metabolic cycle might be impaired under diabetic conditions.11
The present studies were designed to examine the expression level of adenosine receptors (ARs) in diabetic kidney. The results show zone-dependent alterations in expression level of ARs in diabetic kidney. These results may support the hypothesis on involvement of changes in ARs in diabetic kidney disease.
Materials and Methods
Experimental Diabetes
Diabetes was induced in Male Wistar rats (200 to 240 g) fed an Altromin C 1000 diet (Altromin GmbH, Lage, Germany) by a single intravenous injection of streptozotocin (STZ) at 75 mg/kg body weight. STZ was dissolved in 10 mmol/L citrate buffer, pH 4.5. Control rats (hereafter referred to as normal rats) were injected with citrate instead of STZ. On days 1, 5, 10, and 14 after STZ injection, blood glucose levels were measured from tail blood. Only rats with a glucose level of 20 to 30 mmol/L were used for subsequent experiments. To discriminate the impact of the diabetic milieu on AR expression levels from the possible direct effect of STZ, on day 10 after STZ treatment the rats were injected with insulin (long-acting, 10 U/kg) once a day for 4 days. During the insulin treatment blood glucose levels were measured from tail blood once a day. On day 14, rats (Table 1) anesthetized with Inactin (100 mg/kg of body weight) were killed by decapitation, and the kidneys were removed and cooled in 4°C saline.
Table 1.
Summary of Data Characterizing the Three Experimental Groups of Rats
| Parameter | Normal rats | Diabetic rats | Diabetic rats treated with insulin |
|---|---|---|---|
| Body weight (g) | 215 ± 8.2 | 183 ± 11.5* | 189 ± 14.0* |
| Kidney weight (g/100 g body wt) | 1.11 ± 0.13 | 1.25 ± 0.17 | 1.30 ± 0.15 |
| Blood glucose (mmol/L) | 6.1 ± 0.7 | 24.5 ± 2.8* | 7.8 ± 1.1 |
Values are mean + SD (for normal and STZ-treated rats, n = 15; for diabetic rats treated with insulin, n = 5).
P < 0.001 versus normal rats.
Tissue Sampling and RNA Extraction
The kidneys were placed on glass (chilled on ice), sliced, and dissected on cortex and medulla (medulla contained outer and inner strip) under a stereomicroscope. The separated tissue was frozen in liquid nitrogen. Typically, 15 minutes elapsed between kidney removal and immersion of separated kidney zones in liquid nitrogen. Total RNA was extracted from frozen tissues with the use of Total RNA Prep Plus kit (A&A Biotechnology, Gdansk, Poland) and stored at −80°C.
Real-Time Polymerase Chain Reaction (PCR) Analysis
The levels of AR transcripts were analyzed by real-time PCR performed in a Light Cycler 2.0 (Roche, Mannheim, Germany) using the Light Cycler DNA SYBR Green I kit. The reaction mixture contained 2 μl of Master Mix, 1 pmol of each primer (Table 2), and 1 μl of cDNA. As negative controls water and yeast tRNA were run with every PCR assay. To provide a control for quantitation of the PCR products, melting curve analysis was performed. The ratio of β-actin and AR was calculated for each sample. Analysis of the data was done using Light Cycler software 4.0.
Table 2.
Sequences of Primers Used in Real-Time PCR
| Entity | GenBank accession number | Primers | Amplified fragment (bp) |
|---|---|---|---|
| A1 | GI:8392860 | CAACTTCTTCGTCTGGGTGCTGC | 404 |
| CTTCATCGATGGGAGGCTTAGGC | |||
| A2a | GI:19923696 | CATCTTCTCCCACAGCAATCC | 420 |
| GGGGCAAACTCTGAAGACCATG | |||
| A2b | GI:8392863 | GCTGCTGCCCTGTGAAGTGTC | 397 |
| AAGTCCCGGTTCCTGTAGGCA | |||
| A3 | GI:6978452 | GCTGTTGGGGTGCTGGTCATAC | 401 |
| ATGACAACCAGGGGGATGAGGA | |||
| β-Actin | GI:424775962 | GAAATCGTGCGTGACATTAAG | 511 |
| CTAGAAGCATTTGCGGTGGA |
Preparation of Protein Extracts
The appropriate tissue was thawed, minced with razor blade, and homogenized in 3 vol of 50 mmol/L Tris-HCl, pH 7.2, 1 mmol/L dithiothreitol, 0.2 mmol/L Pefabloc SC, and 5 μmol/L leupeptin in a glass homogenizer with a power-driven Teflon pestle. The homogenate was centrifuged at 1000 × g for 15 minutes. The resulting supernatant was collected and centrifuged at 50,000 × g for 45 minutes. The resulting supernatant was stored at −20°C as the cytosolic fraction. The sediment from the 50,000 × g centrifugation was washed twice by suspension in homogenization buffer. The pellet was finally suspended in homogenization buffer containing 0.2% Triton X-100 and homogenized. The resulting suspension was used as the membrane fraction. The purity of obtained fractions was assessed based on measurements of marker enzymes. Recovery of lactate dehydrogenase activity in the cytosolic fraction was 85 to 90% as compared to the whole homogenate. The activity of alkaline phosphatase in the membrane fraction was enriched 5.5-fold. The enrichment factor for lactate dehydrogenase activity in the membrane fraction was in the range of 0.1- to 0.2-fold.
Enzyme Assays
The phosphohydrolase and adenosine deaminase (ADA) activities were measured spectrophotometrically with 100 μmol/L AMP as substrate according to a previously described procedure.12 All enzyme assays were done under conditions in which the product formation was linear with time and with the amount of added protein. The enzyme activities were measured at 25°C. The activity of ecto 5′-nucleotidase (ecto 5′-NT) was calculated by subtracting those rates measured in the presence of 0.1 μmol/L α,β-methylene adenosine diphosphonate (AOPCP), which is a specific inhibitor of ecto 5′-NT,13,14 from those measured in the absence of AOPCP. The phosphohydrolase activity measured in the presence of 0.1 μmol/L AOPCP was considered as nonspecific.
Western Blot Analysis
Protein levels of ARs were examined by immunoblotting. An equivalent amount of protein from tissue extracts was mixed with loading buffer, boiled for 3 minutes, and subjected to 12% sodium dodecyl sulfate (SDS)-polyacrylamide gel electrophoresis (PAGE). The separated proteins were electrophoretically transferred to Immobilon polyvinylidene difluoride transfer membrane (Millipore Sp. z.o.o., Warsaw, Poland). The membrane was incubated at 4°C (overnight) with 3% bovine serum albumin in Tris-buffered saline. The membrane was then cut horizontally at the appropriate position (based on positions of prestained molecular mass markers) and incubated with appropriate primary antibodies for 6 hours. After being washed with Tris-buffered saline, membrane was incubated with alkaline phosphatase-conjugated secondary antibodies. Membrane-bound antibodies were visualized with 5-bromo-4-chloro-3-indoyl phosphate and nitro blue tetrazolium. The developed bands were quantified by using the Gel Doc 2000 system, and relative amounts (normalized to reference protein) were compared using the computer program Quantity One. The 14-3-3 protein was used as a reference protein for Western blots performed on cytosolic fractions. Up to 14 days after STZ administration the level of the 28-kd band of p14-3-3 remained unchanged in diabetic kidney compared to normal kidney (not shown). For blots performed on whole homogenates and membrane fractions, β-actin was used as reference protein. Primary rabbit polyclonal antibodies to A1-AR (A-268), and blocking peptide for A-268 were from Sigma-Aldrich Sp. z o.o. (Poznan, Poland). Rabbit polyclonal antibody to A2b-AR (AB1589P) and blocking peptide were from Chemicon Int. (Temecula, CA). Goat polyclonal antibodies to β-actin (1–19), A2a-AR (R-18), A3-AR (C-17), p14.3.3 (K-19), and corresponding blocking peptides were from Santa Cruz Biotechnology, Inc. (Santa Cruz, CA).
Immunohistochemistry
The sections (4 μm) of formalin-fixed, paraffin-embedded renal samples were deparaffinized in xylene and rehydrated in graded ethanols. Endogenous peroxidase was blocked by incubation of the sections in 3% hydrogen peroxide. To improve antibody penetration the samples were treated for 10 minutes by microwaves. The sections were then incubated for 1 hour with the primary antibody diluted in phosphate-buffered saline (PBS) containing 1% bovine serum albumin. The polyclonal anti-A1-AR and anti A2a-AR antibodies were diluted 1:1000 and 1:200, respectively. After washes in PBS, the sections were treated with the visualization LSAB2 Kit (DakoCytomation, Glostrup, Denmark) according to the manufacturer’s procedure. This kit (K0675) contained the biotinylated secondary antibodies, peroxidase-conjugated streptavidin and the AEC chromogenic substrate. The tissues were counterstained with Mayer’s hematoxylin. Microscopic observations were performed with a standard Olympus BX50 light microscope.
Statistical Analysis
The statistical analysis was performed using the Statistica 5PL statistical package (StatSoft). Statistical significance was determined using the t-test. P values less than 0.05 were considered as significant.
Results
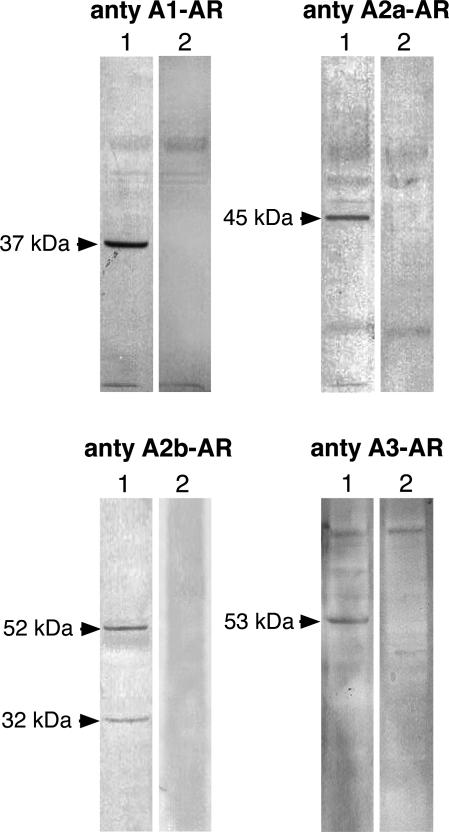
The AR protein levels in kidney extracts were analyzed by Western blot. The specificity of used antibodies was examined by using blocking peptides (immunogens). The data presented in Figure 1 indicate that antibody to A1-AR, A2a-AR, A2b-AR, A3-AR recognized in kidney homogenates the protein band of 37, 45, 52/32, and 53 kd, respectively. In the presence of adequate blocking peptide there was no staining of these bands; therefore, we assumed that these protein bands represent the respective ARs.
Figure 1.
The protein bands recognized by antibodies to ARs in rat kidney homogenates. Kidney homogenates were prepared and the equivalent of 50 μg (for analysis of A1-AR and A2b-AR) or 80 μg (for analysis of A2a-AR and A3-AR) protein was subjected to Western blot analysis (lane 1) as described in Materials and Methods. On lane 2 blots performed in the presence of respective blocking peptides are shown.
Expression Level of Adenosine A1 Receptor (A1-AR)
To evaluate the impact of diabetes on expression level of ARs in rat kidney, we examined the AR mRNA and protein levels in kidneys of normal and STZ-induced diabetic rats. The changes in AR mRNA level were evaluated based on results from real-time PCR performed on cDNA transcribed from RNA isolated from whole kidney and kidney cortex and medulla (Table 2).
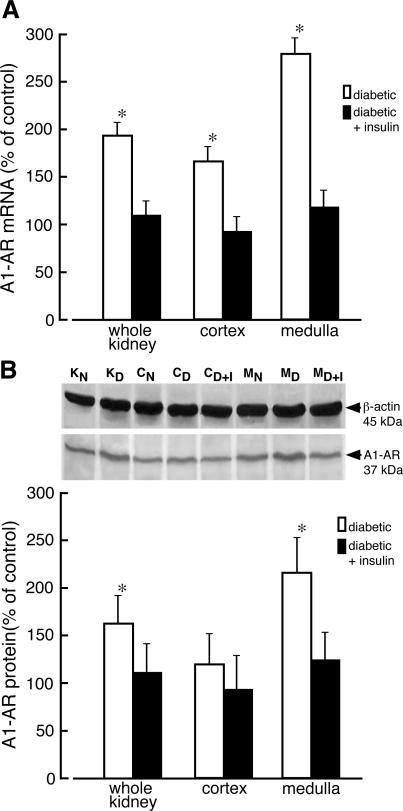
On day 10 after STZ administration, there was a significant increase in the mRNA level of A1-AR in diabetic kidney (Figure 2A). In diabetic animals the level of A1-AR mRNA was raised 1.7- and 2.8-fold in kidney cortex and medulla, respectively. Administration of insulin to diabetic rats for 4 days resulted in normalization of A1-AR mRNA levels (Figure 2A). The increase of A1-AR mRNA level was accompanied by elevated receptor protein level. Immunoblot analysis indicated that the protein level of A1-AR (37-kd protein band) increased in homogenates of whole diabetic kidney and kidney medulla 1.5- and 2.1-fold, respectively. A slight increase of A1-AR protein in homogenates of diabetic kidney cortex was also observed, but it did not reach statistical significance. Treatment of diabetic rats with insulin resulted in normalization of the A1-AR protein level (Figure 2B).
Figure 2.
Changes of adenosine A1 receptor mRNA and protein levels in kidney of diabetic rat. A: Total RNA was extracted from whole normal kidney (KN), whole diabetic kidney (KD), normal kidney cortex (CN), diabetic kidney cortex (CD), kidney cortex prepared from diabetic rats receiving insulin for 4 days (CD+I), normal kidney medulla (MN), diabetic kidney medulla (MD), and kidney medulla prepared from diabetic rats receiving insulin for 4 days (MD+I). The level of adenosine A1 receptor (A1-AR) mRNA was analyzed as described in Materials and Methods. The results normalized to β-actin are presented as percentage of A1-AR mRNA measured in normal (control) tissues + SD of at least five experiments. *P < 0.05 relative to control. B: Homogenates were prepared from analyzed tissues and the equivalent of 50 μg of protein was subjected to Western blot analysis. The presented blot is representative of those obtained in three independent experiments. β-Actin was used as a reference protein. The quantified results of Western blot are presented as percentage of A1-AR/β-actin ratio measured in normal (control) tissues + SD of at least three experiments. *P < 0.05 relative to control.
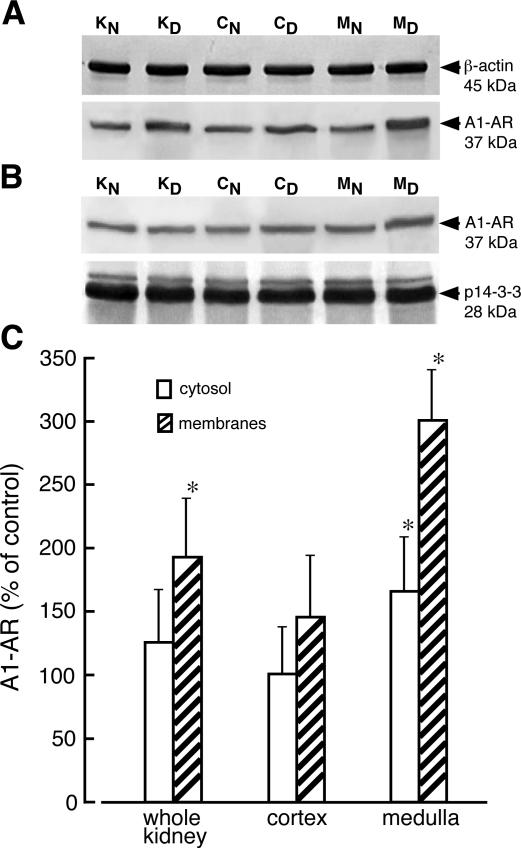
ARs belong to the seven-transmembrane (7TM) receptor family, whose regulation includes internalization into acidic endosomes followed by either return to the cell surface or degradation.15,16 Therefore, a lack of alteration of receptor protein content in tissue homogenate does not necessarily indicate unchanged receptor levels in plasma membranes. To assess the cellular distribution of AR, we performed immunoblot analysis on cytosolic and membrane fractions obtained from whole kidney and kidney zones. Examination of the membrane fractions from kidney cortex and medulla indicated that the level of A1-AR protein increased threefold in the membranes from medulla of diabetic kidney whereas only a 50% increase in receptor protein was seen in membranes from kidney cortex (Figure 3). The protein level of A1-AR rose by 60% in cytosolic fraction from diabetic kidney medulla, but no increase was seen in the cytosol of diabetic kidney cortex.
Figure 3.
Cellular distribution of adenosine A1 receptor in normal and diabetic kidney. Membrane (A) and cytosolic (B) fractions from whole normal kidney (KN), whole diabetic kidney (KD), normal kidney cortex (CN), diabetic kidney cortex (CD), normal kidney medulla (MN), and diabetic kidney medulla (MD) were prepared as described in Materials and Methods. The proteins (30 μg and 40 μg of membrane and cytosolic protein, respectively) were separated on 12% SDS-PAGE and immunoblotted with appropriate antibodies. The blots were scanned and quantified. C: The quantified results normalized to appropriate reference protein are presented as percentage of A1-AR/(reference protein) measured in normal (control) tissues + SD of three experiments. *P < 0.05 relative to control.
Expression Level of Adenosine A2a Receptor (A2a-AR)
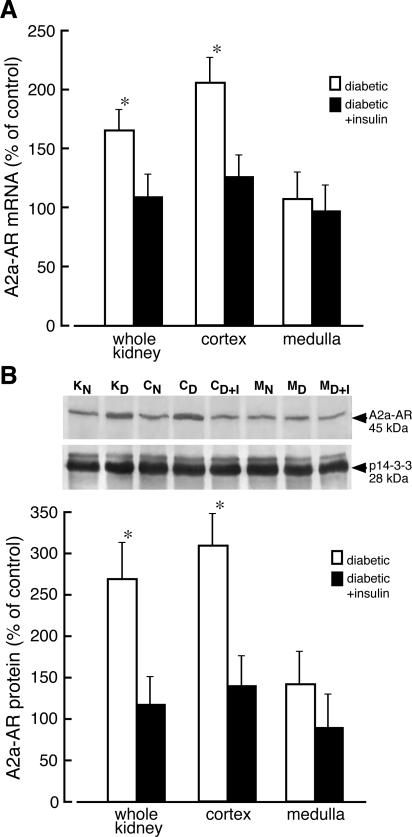
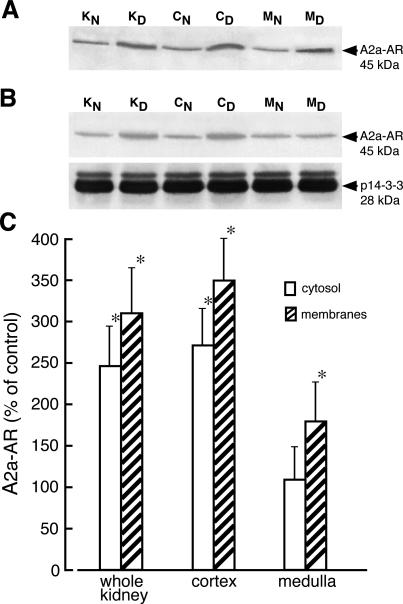
Evaluation of A2a-AR mRNA levels in the kidney of diabetic rats indicated that levels of this mRNA increased twofold in cortex but remained unchanged in kidney medulla. The level of A2a mRNA in kidney of diabetic rat treated with insulin for 4 days was not different from that determined in kidney of normal rat (Figure 4A). Staining of renal samples with the anti-A2a antibody gave rise to a single 45-kd dominant band (Figure 1). The amount of A2a-AR protein (45-kd band) increased greater than threefold in homogenates of diabetic kidney cortex but did not change in homogenates of medulla. Elevated (2.6-fold) protein levels of A2a-AR was also detected in homogenates from whole diabetic kidneys. Administration of insulin to diabetic rats resulted in normalization of A2a-AR protein levels (Figure 4B). In membrane and cytosolic fractions prepared from diabetic kidney cortex, the protein levels of A2a-AR increased 3.5- and 2.7-fold, respectively (Figure 5) whereas in the medulla the level of A2a-AR protein increased by 75% in membranes and did not change in cytosolic fraction.
Figure 4.
Adenosine A2a receptor mRNA and protein levels in kidney of normal and diabetic rat. A: Total RNA was extracted from whole normal kidney (KN), whole diabetic kidney (KD), normal kidney cortex (CN), diabetic kidney cortex (CD), kidney cortex prepared from diabetic rats receiving insulin for 4 days (CD+I), normal kidney medulla (MN), diabetic kidney medulla (MD), and kidney medulla prepared from diabetic rats receiving insulin for 4 days (MD+I). The level of adenosine A2a receptor (A2a-AR) mRNA was analyzed as described in Materials and Methods. The results normalized to β-actin are presented as percentage of A2a-AR mRNA measured in normal (control) tissues + SD of at least five experiments. *P < 0.05 relative to control. B: Homogenates were prepared from analyzed tissues, and the equivalent of 80 μg of protein was subjected to Western blot analysis. The presented blot is representative of those obtained in three independent experiments. Protein p14-3-3 was used as a reference. The blots were scanned and quantified. The quantified results normalized to protein p14-3-3 are presented as percentage of A2a-AR/p14-3-3 measured in normal (control) tissues + SD of three experiments. *P < 0.05 relative to control.
Figure 5.
Cellular distribution of adenosine A2a receptor in normal and diabetic kidney. Membrane (A) and cytosolic (B) fractions from whole normal kidney (KN), whole diabetic kidney (KD), normal kidney cortex (CN), diabetic kidney cortex (CD), normal kidney medulla (MN), and diabetic kidney medulla (MD) were prepared as described in Materials and Methods. The proteins (50 μg and 70 μg of membrane and cytosolic protein, respectively) were separated on 12% SDS-PAGE and immunoblotted with appropriate antibodies. The blots were scanned and quantified. C: The quantified results normalized to 14-3-3 protein (for cytosol) are presented as percentage of A2a-AR/p14-3-3 measured in normal (control) tissues + SD of at least four experiments. For membrane fraction the absolute intensities of A2a-AR bands were compared. *P < 0.05 relative to control.
Expression Level of Adenosine A2b Receptor (A2b-AR)
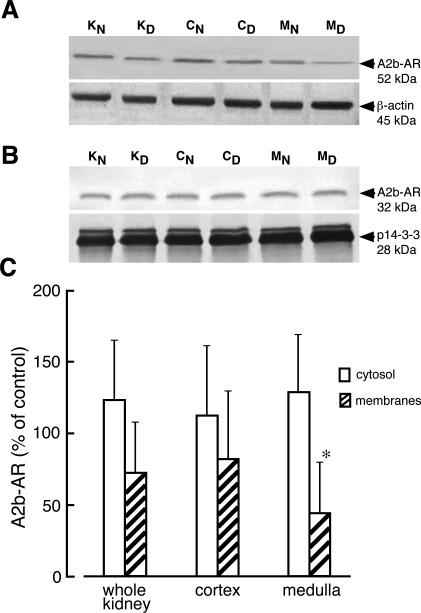
Comparison of A2b-AR mRNA levels in kidneys of normal and diabetic rats indicated slightly increased levels of this mRNA in diabetic kidney (Figure 6). Western blot analysis performed on whole homogenates showed two protein bands (52 kd and 32 kd) that reacted with anti-A2b antibody (Figure 1). We did not observe any significant alteration of A2b-AR protein levels (52- and 32-kd bands) in homogenates of whole diabetic kidney, cortex, or medulla (Figure 6). Immunoblot analysis performed on kidney cytosolic fractions showed that anti-A2b antibody recognized only the 32-kd protein band whereas in membrane fractions only 52-kd protein band was stained by this antibody (Figure 7). Evaluation of A2b-AR protein in cytosolic and membrane fractions of diabetic kidney zones revealed no changes in A2b-AR protein levels in cytosolic fractions and decreased A2b-AR levels in membranes, but the decrease in A2b-AR protein was statistically significant only in membranes of medulla (Figure 7).
Figure 6.
Adenosine A2b receptor mRNA and protein levels in kidney of normal and diabetic rat. A: Total RNA was extracted from whole normal kidney (KN), whole diabetic kidney (KD), normal kidney cortex (CN), diabetic kidney cortex (CD), kidney cortex prepared from diabetic rats receiving insulin for 4 days (CD+I), normal kidney medulla (MN), diabetic kidney medulla (MD), and kidney medulla prepared from diabetic rats receiving insulin for 4 days (MD+I). The level of adenosine A2b receptor (A2b-AR) mRNA was analyzed as described in Materials and Methods. The results normalized to β-actin are presented as percentage of A2b-AR mRNA measured in normal (control) tissues + SD of at least four experiments. *P < 0.05 relative to control. B: Homogenates were prepared from analyzed tissues, and the equivalent of 50 μg of protein was subjected to Western blot analysis. The presented blot is representative of those obtained in three independent experiments. β-Actin was used as a reference protein. The quantified results of Western blot are presented as percentage of A2b-AR/β-actin ratio measured in normal (control) tissues + SD of at least three experiments. *P < 0.05 relative to control.
Figure 7.
Cellular distribution of adenosine A2b receptor in normal and diabetic kidney. Membrane (A) and cytosolic (B) fractions from whole normal kidney (KN), whole diabetic kidney (KD), normal kidney cortex (CN), diabetic kidney cortex (CD), normal kidney medulla (MN), and diabetic kidney medulla (MD) were prepared as described in Materials and Methods. The proteins (30 μg and 40 μg of membrane and cytosolic protein, respectively) were separated on 12% SDS-PAGE and immunoblotted with appropriate antibodies. The blots were scanned and quantified. C: The quantified results normalized to appropriate reference protein are presented as percentage of A2b-AR/(reference protein) measured in normal (control) tissues + SD of at least three experiments. *P < 0.05 relative to control.
Expression Level of Adenosine A3 Receptor (A3-AR)
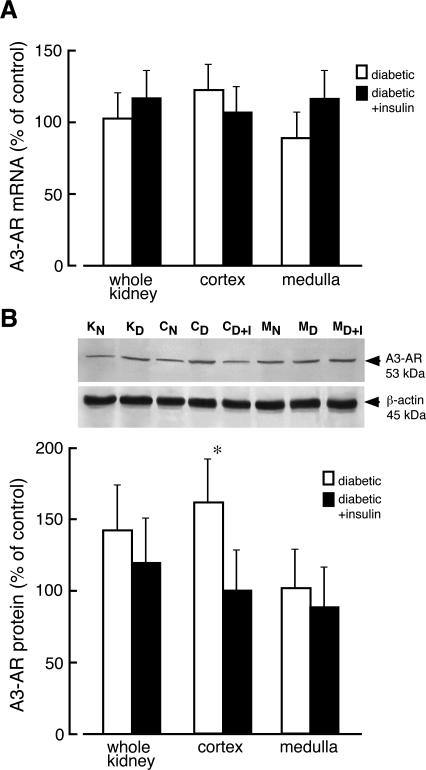
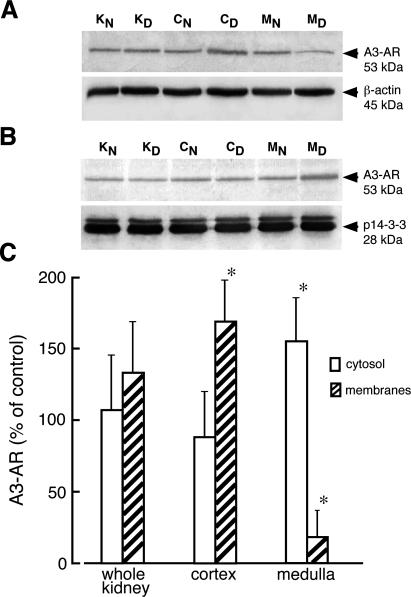
The levels of mRNA for A3-AR in diabetic kidney and its zones were unchanged compared to kidney of normal rats (Figure 8A). Western blot analysis of kidney extracts showed that the anti-A3 receptor antibody recognized only one 53-kd protein band (Figure 1). A slight but not statistically significant increase of the A3-AR protein levels was visible in homogenates of whole diabetic kidney whereas the increase in A3-AR protein in cortex of diabetic kidney was statistically significant (Figure 8B). The protein levels of A3-AR in kidney isolated from diabetic rat treated with insulin for 4 days was not significantly different from that determined in kidney of normal rat. Immunoblot analyses performed on cytosolic and membrane fractions indicated that the amount of A3-AR protein increased by 70% and decreased by 80% in membranes prepared from diabetic kidney cortex and medulla, respectively (Figure 9). The decrease in A3-AR protein content in membranes of diabetic medulla was accompanied by a 50% increase of the receptor protein level in cytosolic fraction. In the cortex of diabetic kidney, the levels of A3-AR in cytosolic fraction decreased by 25%, but this change was not statistically significant.
Figure 8.
Adenosine A3 receptor mRNA and protein levels in kidney of normal and diabetic rat. A: Total RNA was extracted from whole normal kidney (KN), whole diabetic kidney (KD), normal kidney cortex (CN), diabetic kidney cortex (CD), kidney cortex prepared from diabetic rats receiving insulin for 4 days (CD+I), normal kidney medulla (MN), diabetic kidney medulla (MD), and kidney medulla prepared from diabetic rats receiving insulin for 4 days (MD+I). The level of adenosine A3 receptor (A3-AR) mRNA was analyzed as described in Materials and Methods. The results normalized to β-actin are presented as percentage of A3-AR mRNA measured in normal (control) tissues + SD of at least five experiments. B: Homogenates were prepared from analyzed tissues, and the equivalent of 80 μg of protein was subjected to Western blot analysis. The presented blot is representative of those obtained in three independent experiments. β-Actin was used as a reference protein. The quantified results of Western blot are presented as percentage of A3-AR/β-actin ratio measured in normal (control) tissues + SD of at least three experiments. *P < 0.05 relative to control.
Figure 9.
Cellular distribution of adenosine A3 receptor in normal and diabetic kidney. Membrane (A) and cytosolic (B) fractions from whole normal kidney (KN), whole diabetic kidney (KD), normal kidney cortex (CN), diabetic kidney cortex (CD), normal kidney medulla (MN), and diabetic kidney medulla (MD) were prepared as described in Materials and Methods. The proteins (50 μg and 70 μg of membrane and cytosolic protein, respectively) were separated on 12% SDS-PAGE and immunoblotted with appropriate antibodies. The blots were scanned and quantified. C: The quantified results normalized to appropriate reference protein are presented as percentage of A3-AR/(reference protein) measured in normal (control) tissues + SD of at least three experiments. *P < 0.05 relative to control.
ARs Immunohistochemistry
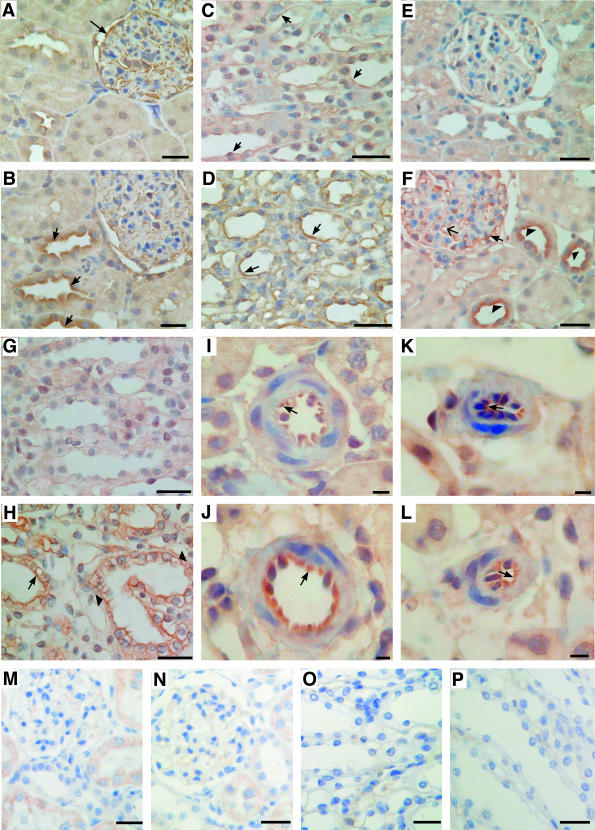
The pattern of AR distribution in kidneys from normal and STZ-induced diabetic rats was examined on 4-μm-thick sections. The quality of commercially available antibodies allowed us to investigate the A1 and A2a receptors only. In sections of normal kidney cortex, the A1-AR immunostaining was observed in epithelial cells of glomeruli, and there was also weak A1-AR labeling of luminal membranes in distal convoluted tubules (Figure 10). The A1-AR labeling of glomeruli decreased slightly in diabetic kidney concomitant with increased A1-AR immunoreactivity of distal convoluted tubules (Figure 10B). Medullar tubules of normal kidney showed weak A1-AR staining of luminal membranes whereas in diabetic kidney the A1-AR immunoreactivity increased strongly along medullar tubules especially in the collecting duct and the thick ascending loop of Henle (Figure 10D). We did not observe any significant changes in A1-AR labeling of preglomerular and postglomerular vessels in diabetic kidney (not shown).
Figure 10.
Expression of A1 and A2a ARs in normal and diabetic kidney. Immunohistochemistry in serial sections of normal (A, C, E, G, I, K, M–P) and diabetic (B, D, F, H, J, L) kidney was performed as described in Materials and Methods. Kidney tissues were stained with antibodies to rat A1 (A–D, M, O) and rat A2a (E–L, N, P) AR. Immunochemistry performed in the presence of A1-AR and A2a-AR blocking peptides is presented in M and O and N and P, respectively. In normal kidney expression of A1-AR was visible in glomerular epithelial cells (A, arrow) and in epithelial cells of medullar tubules (C, arrows). In diabetic kidney A1-AR was up-regulated in epithelial cells of cortical distal convoluted tubules (B, arrow) and medullar tubules (D, arrows). B: Decreased expression of A1-AR was observed in diabetic glomeruli. The expression of A2a AR was barely visible in serial sections of normal kidney cortex (E) and medulla (G) whereas in diabetic kidney cortex (F) A2a-AR was up-regulated in epithelial cells of glomeruli (arrow), in glomerular capillary loops (arrow with a simple wide arrowhead), and in apical membranes of epithelial cells of distal convoluted tubules (arrowhead). H: Immunostaining for A2a-AR was also increased both in luminal (arrow) and basolateral (arrowhead) membranes of epithelial cells of diabetic medullar tubules. J: The A2a-AR staining was also increased in epithelial cells of preglomerular vessels of diabetic kidney (arrow). K and L: Only weak A2a-AR labeling of postglomerular vessels was visible (arrow). Scale bars: 50 μm (A–H, M–P); 10 μm (I–L).
In normal kidney A2a-AR immunoreactivity was very weak in both kidney cortex and medulla (Figure 10, E and G). The expression pattern of A2a-AR in diabetic kidney changed significantly compared to normal kidney. Immunohistochemistry performed on sections of diabetic kidney cortex showed strong A2a-AR staining in luminal membranes of the cortical collecting duct (Figure 10F). There was also a significant increase in A2a-AR immunostaining of glomerular epithelial cells and in glomerular capillary loops. Increased A2a-AR labeling was also observed in medullar tubules of diabetic kidney, although principal cells of collecting tubules exhibited both the luminal and basolateral A2a-AR immunoreactivity (Figure 10H). Density of A2a-AR on epithelial cells of preglomerular vessels increased significantly in diabetic kidney whereas postglomerular vessels showed no changes or mode increases in A2a-AR labeling (Figure 10, J and L).
ADA and 5′-Nucleotidase (5′-NT) Activities in Kidney Membranes
The degree of AR activation depends on adenosine concentration in the nearest vicinity of the receptor. On the other hand extracellular concentration of adenosine depends on transport processes and metabolism. Our previous experiments showed that the expression level of nucleoside transporters in diabetic kidney was not changed.10 It is assumed that 5′-NT-mediated AMP hydrolysis is the primary source of adenosine in the kidney.17 Our measurements showed that activity of ecto 5′-NT increased 4.5-fold in medullar membranes of diabetic kidney whereas activity of this enzyme measured in cortex membranes increased only 40%, which was not statistically significant (Table 3). However, the nonspecific phosphohydrolase activity increased twofold both in cortex and medullar membranes of diabetic kidney. Recently, co-localization of ADA and A1-AR on the surface of epithelial cells was reported.18 Our investigation showed that ADA activity associated with membranes increased 1.6-fold in cortex and 2.7-fold in medulla of diabetic kidney (Table 3). Changes in 5′-NT and ADA activity were observed only in the membrane fraction of diabetic kidney but not in cytosol.11
Table 3.
The Nonspecific Phosphohydrolase, Ecto 5′-Nucleotidase (Ecto 5′-NT), and Adenosine Deaminase (ADA) Activities in Kidney Membrane Fractions
| Enzyme | Normal kidney (nmol/minute/mg)
|
Diabetic kidney (nmol/minute/mg)
|
||
|---|---|---|---|---|
| Cortex | Medulla | Cortex | Medulla | |
| Nonspecific phosphohydrolases | 55.3 ± 13.2 | 29.3 ± 9.7 | 106.9 ± 18.9* | 59.7 ± 15.7* |
| Ecto 5′-NT | 39.5 ± 9.1 | 6.1 ± 2.2 | 57.1 ± 14.2 | 27.3 ± 8.5* |
| ADA | 17.2 ± 3.5 | 7.4 ± 2.6 | 26.7 ± 5.1* | 19.8 ± 4.3* |
The enzymatic activities were assayed in kidney membrane fractions of normal and diabetic rats in the presence of 100 μmol/L AMP as described in Materials and Methods. The values are mean + SD (n = 7).
P < 0.05 versus normal rats.
Discussion
In this study we evaluated the impact of early STZ-induced diabetes on ARs in rat kidney. The data presented here shows complex changes occurring at the level of gene expression, receptor protein content, and cellular and tissue distribution. Some of these alterations, as discussed below, correspond to abnormalities characteristic of the diabetic nephropathy.
The observed increases in expression of A1-AR in medulla of diabetic kidney, especially in the collecting duct, are in line with enhanced tubular sodium reabsorption noted in clinical and experimental diabetes. Early stages of diabetic nephropathy are associated with increased absolute proximal sodium reabsorption, decreased fractional sodium reabsorption, and increased urinary sodium excretion.19,20 Additionally, it has been reported that stimulation of A1-AR decreases the transtubular voltage in thick ascending limb,21 reduces sodium and chloride absorption in the loop of Henle,22,23 and decreases sodium absorption in the inner medullary collecting duct.24 These data suggest that altered sodium handling in diabetic kidney may be related to overexpression of A1-AR in the medullar tubules of diabetic kidney. Another characteristic feature of the diabetic kidney includes its inability to concentrate urine despite elevated plasma vasopressin levels.21 Patients with acquired diabetes mellitus display reversible resistance to arginine vasopressin (AVP).25 Evidence from experiments on STZ-induced diabetic rats indicates that the density of the renal V2 receptor and the affinity of the receptor for AVP are not altered in diabetic kidney.26 However, AVP-induced increases in osmotic water permeability and cAMP accumulation in rat inner medullary collecting duct have been reported to be inhibited by A1-AR activation.24 Therefore, AVP resistance might be related to increased density of A1-AR in the collecting duct of diabetic kidney.
Investigation into the possible impact of altered AR expression levels on the diabetic kidney function raises the question of adenosine origin in diabetic kidney. In the kidney multiple pathways exist to produce extracellular adenosine. Previously, we have demonstrated that the activity of adenosine kinase, which is considered a very sensitive control point for adenosine levels in the cell, is significantly decreased in diabetic kidney.11 This suggests that the turnover of the AMP-adenosine metabolic cycle might be impaired in diabetic kidney leading to local increases in adenosine concentration. This assumption is supported by experiments indicating that in the kidney of diabetic rats adenosine levels were not altered in the artery but increased significantly in plasma of the renal vein.27 Extracellular cAMP was recently proposed to be a significant source of adenosine in the kidney.28 Experiments on cells isolated from collecting ducts showed that stimulation of adenylyl cyclase leads to increases in extracellular concentration of cAMP, which was effectively converted to AMP and adenosine.29 Our data indicate that in kidney of diabetic rat the activity of ecto 5′-NT increased 4.5-fold in medullar membranes (Table 3) whereas the overall nonspecific dephosphorylating potential of the kidney membrane fraction rose twofold (Table 3).
Hyperfiltration is a leading hallmark of early diabetes resulting in progressive diabetic nephropathy. The hemodynamic phenotype of early diabetes has been attributed to abnormalities of renal vessels and glomerular vasculature. Several factors such as altered function of calcium and potassium channels, lack of insulin action, elevated levels of atrial natriuretic peptide and locally produced renal angiotensin have been implicated in the afferent arteriolar dilation and efferent arteriolar constriction observed in the early state of diabetes, contributing to glomerular hyperfiltration.30 The data presented in this report show increased expression of A2a-AR in the cortex of diabetic kidney.
Immunohistochemistry analysis revealed that A2a receptor levels increased significantly in glomeruli and in renal preglomerular arteries whereas in postglomerular vessels only modest increases in the density of A2a-AR were visible. This was accompanied by a lack of significant changes in the density of A1-AR in renal vessels. Such a distribution pattern of ARs in diabetic kidney is in accordance with data from micropuncture studies that indicate reduced resistance of afferent arterioles in diabetic rats31 and from videometric measurements that show increased diameter of afferent arterioles in kidneys from diabetic rats.32 On the other hand, the hypersensitivity of renal vasculature to vasoconstrictive action of adenosine was observed in diabetic rats.33 This phenomenon may be related to observations in our study of increased levels of A3-AR in plasma membranes of the diabetic kidney cortex. It has been demonstrated that stimulation of A3-AR in vascular smooth muscle cells decreases cAMP levels.34 Moreover, it appears that the A3-AR expression levels are critical for adenosine’s effect on cellular cAMP levels.35 It is difficult to assess the impact of changes in renal A3-AR distribution on the diabetic kidney because the function of this receptor in the kidney remains enigmatic. Altered vasoconstriction in response to administration of contrast media is a major adverse event in patients with impaired renal function. In particular, patients with diabetes mellitus are highly vulnerable to a prolonged decrease of renal blood flow.36 It has been demonstrated that administration of adenosine A1-selective antagonists in both animals and humans restores renal blood flow and prevents contrast media-induced acute renal failure.37 Moreover, involvement of A3-AR in ischemia-induced renal failure has been reported recently.38 This study showed that an A3-AR antagonist given before renal ischemia protected renal function whereas an A3-AR agonist significantly worsened renal ischemic-reperfusion injury. Furthermore, it appears that A3-AR activation must be coupled with an ischemia-reperfusion insult to have a detrimental effect on renal function because stimulation or inhibition of A3-AR in normal conditions did not affect kidney function. These results were confirmed by studies on genetically manipulated mice, which showed that mice lacking A3-AR are protected from ischemic or myoglobinuric renal failure.39
Alteration of renal handling of inorganic phosphate occurs in the early onset of experimental diabetes and in diabetic patients, resulting in renal phosphate leakage.29,40 Most of the renal phosphate reabsorption takes place in the proximal tubule, but the final regulation of urinary phosphate excretion appears to occur in the cortical and medullar collecting tubule.41 Our results indicate increased expression of A2a-AR in epithelial cells of cortical and medullar collecting tubules, suggesting that cAMP levels might be raised by Ado action on A2a receptors in diabetic kidney. On the cellular level increased cAMP by activating protein kinase A triggers a phosphorylation cascade that leads to inhibition of phosphate transport.42 However, the lack of insulin action that inhibits cAMP accumulation and glucose-induced raise in cAMP levels cannot be excluded. On the other hand, increased cAMP levels caused by insulin deficiency and hyperglycemia may become the intrarenal source of adenosine.
It becomes apparent that multiple alterations are involved in the pathogenesis of diabetic nephropathy. Therefore, to develop effective therapeutic strategies, it is necessary to obtain detailed knowledge of changes that occur in the diabetic kidney. Our results show that the expression level and distribution pattern of ARs are significantly altered in the diabetic kidney. Because adenosine is considered an autocrine factor that controls renal metabolism and function, alterations in ARs may significantly contribute to diabetic nephropathy. The presented evidence may be of clinical relevance and lead to the development of more targeted treatment with the use of specific AR agonists and antagonists. It seems that at least the A1 receptor antagonists are useful as therapeutic tools to prevent contrast media-induced renal failure in diabetic patients.37 However, it should be stressed that the functional significance of some AR alterations observed in our studies remains speculative, and further studies will be necessary to resolve these questions.
Footnotes
Address reprint requests to Tadeusz Pawelczyk, Department of Molecular Medicine, Medical University of Gdansk, ul. Debinki 7, paw. 29, 80-211 Gdansk, Poland. E-mail: tkpaw@amg.gda.pl.
Supported by the State Committee for Scientific Research (KBN; grant no. 3 P05A 054 24 to T.P.).
References
- Andersen AR, Sandahl-Christiansen J, Andersen JK, Kreiner S, Deckert T. Diabetic nephropathy in type I (insulin-dependent) diabetes: an epidemiological study. Diabetologia. 1983;25:496–501. doi: 10.1007/BF00284458. [DOI] [PubMed] [Google Scholar]
- Rudberg S, Persson B, Dalquist G. Increased glomerular filtration rate as a predictor of diabetic nephropathy: an 8-year prospective study. Kidney Int. 1992;41:822–828. doi: 10.1038/ki.1992.126. [DOI] [PubMed] [Google Scholar]
- Morgensen CE. Early glomerular hyperfiltration in insulin-dependent diabetics and late nephropathy. Scand J Clin Lab Invest. 1986;46:201–206. doi: 10.3109/00365518609083660. [DOI] [PubMed] [Google Scholar]
- Vallon V, Weat LM, Blantz RC. Renal haemodynamics and plasma and kidney angiotensin II in established diabetes mellitius in rats. Effect of sodium and salt restriction. J Am Soc Nephrol. 1995;5:1761–1767. doi: 10.1681/ASN.V5101761. [DOI] [PubMed] [Google Scholar]
- Komers R, Anderson S. Paradoxes of nitric oxide in the diabetic kidney. Am J Physiol. 2003;284:F1121–F1137. doi: 10.1152/ajprenal.00265.2002. [DOI] [PubMed] [Google Scholar]
- Pflueger A, Gross JM, Knox FG. Adenosine-induced renal vasoconstriction in diabetes mellitus rats: role of prostaglandins. Am J Physiol. 1999;277:R1410–R1417. doi: 10.1152/ajpregu.1999.277.5.R1410. [DOI] [PubMed] [Google Scholar]
- Szczepanska-Konkel M, Jankowski M, Stiepanow-Trzeciak A, Rudzik A, Pawelczyk T, Angielski A. Responsiveness of renal glomeruli to adenosine in streptozotocin-induced diabetic rats dependent on hypergycaemia level. J Physiol Pharmacol. 2003;54:109–120. [PubMed] [Google Scholar]
- Mccoy DE, Bhattacharya S, Olson BA, Levier DG, Arend LG, Spielman WS. The renal adenosine system: structure, and regulation. Semin Nephrol. 1993;13:31–40. [PubMed] [Google Scholar]
- Olah ME, Stiles GL. The role of receptor structure in determining adenosine receptor activity. Pharmacol Therapeut. 2000;85:55–75. doi: 10.1016/s0163-7258(99)00051-0. [DOI] [PubMed] [Google Scholar]
- Pawelczyk T, Podgorska M, Sakowicz M. The effect of insulin on expression level of nucleoside transporters in diabetic rats. Mol Pharmacol. 2003;63:81–88. doi: 10.1124/mol.63.1.81. [DOI] [PubMed] [Google Scholar]
- Pawelczyk T, Sakowicz M, Szczepanska-Konkel M, Angielski S. Decreased expression of adenosine kinase in streptozotocin-induced diabetes mellitus rats. Arch Biochem Biophys. 2000;375:1–6. doi: 10.1006/abbi.1999.1548. [DOI] [PubMed] [Google Scholar]
- Pawelczyk T, Bizon D, Angielski S. The distribution of enzymes involved in purine metabolism in rat kidney. Biochim Biophys Acta. 1992;1116:309–314. doi: 10.1016/0304-4165(92)90045-v. [DOI] [PubMed] [Google Scholar]
- Naito Y, Lowenstein JM. 5′-Nucleotidase from rat heart membranes. Inhibition by adenine nucleotides and related compounds. Biochem J. 1985;226:645–651. doi: 10.1042/bj2260645. [DOI] [PMC free article] [PubMed] [Google Scholar]
- Yamazaki Y, Troung VL, Lowenstein JM. 5′Nucleotidase I from rabbit heart. Biochemistry. 1991;30:1503–1509. doi: 10.1021/bi00220a009. [DOI] [PubMed] [Google Scholar]
- Ramkumar V, Olah ME, Jacobson KA, Stiles GL. Distinct pathways of desensitization of A1- and A2-adenosine receptors in DDT1 MF-2 cells. Mol Pharmacol. 1991;40:639–647. [PMC free article] [PubMed] [Google Scholar]
- Sorkin A, Von Zastrow M. Signal transduction and endocytosis: close encounters of many kinds. Nat Rev Mol Cell Biol. 2002;3:600–614. doi: 10.1038/nrm883. [DOI] [PubMed] [Google Scholar]
- Spielman WS, Arend LJ. Adenosine receptors and signaling in the kidney. Hypertension. 1991;17:117–130. doi: 10.1161/01.hyp.17.2.117. [DOI] [PubMed] [Google Scholar]
- Gines S, Ciruela F, Burgueno J, Casado V, Canela EI, Mallol J, Lluis C, Franco R. Involvement of caveolin in ligand-induced recruitment and internalization of A1 adenosine receptor and adenosine deaminase in an epithelial cell line. Mol Pharmacol. 2001;59:1314–1323. [PubMed] [Google Scholar]
- Hannedouche TP, Delgado AG, Gniosahe DA, Boitard C, Lacour B, Grunfeld J-P. Renal haemodynamics and segmental tubular reabsorption in early type 1 diabetes. Kidney Int. 1990;37:1126–1133. doi: 10.1038/ki.1990.95. [DOI] [PubMed] [Google Scholar]
- Komers R, Cooper ME. Renal sodium handling in experimental diabetes: role of NO. Nephrol Dial Transplant. 1996;11:2170–2177. doi: 10.1093/oxfordjournals.ndt.a027133. [DOI] [PubMed] [Google Scholar]
- Ahloulay M, Schmitt F, Dechaux M, Bankir L. Vasopressin and urinary concentrating activity in diabetes mellitus. Diabetes Metab. 1999;25:213–222. [PubMed] [Google Scholar]
- Seney FD, Seikaly MG. Adenosine inhibits sodium uptake in the loop of Henle. Clin Res. 1989;37:501A. [Google Scholar]
- Beach RE, Good DW. Effect of adenosine on ion transport in rat medullary thick ascending limb. Am J Physiol. 1992;263:F482–F487. doi: 10.1152/ajprenal.1992.263.3.F482. [DOI] [PubMed] [Google Scholar]
- Edwards RM, Spielman WS. Adenosine A1 receptor-mediated inhibition of vasopressin action in inner medullary collecting duct. Am J Physiol. 1994;266:F791–F796. doi: 10.1152/ajprenal.1994.266.5.F791. [DOI] [PubMed] [Google Scholar]
- McKenna K, Morris AD, Ryan M, Newton RW, Frier BM, Baylis PH, Saito T, Ishikawa S, Thompson CJ. Renal resistance to vasopressin in poorly controlled type 1 diabetes mellitus. Am J Physiol. 2000;279:E155–E160. doi: 10.1152/ajpendo.2000.279.1.E155. [DOI] [PubMed] [Google Scholar]
- Trinder D, Phillips PA, Stephenson JM, Risvanis J, Aminian A, Adam W, Cooper M, Johnston CI. Vasopressin V1 and V2 receptors in diabetes mellitus. Am J Physiol. 1994;266:E217–E223. doi: 10.1152/ajpendo.1994.266.2.E217. [DOI] [PubMed] [Google Scholar]
- Angielski S, Jakubowski Z, Pawelczyk T, Piec G, Redlak M. Renal handling and metabolism of adenosine in diabetic rats. Contrib Nephrol. 1989;73:52–58. doi: 10.1159/000417379. [DOI] [PubMed] [Google Scholar]
- Jackson EK, Dubey RK. Role of the extracellular cAMP-adenosine pathway in renal physiology. Am J Physiol. 2001;281:F597–F612. doi: 10.1152/ajprenal.2001.281.4.F597. [DOI] [PubMed] [Google Scholar]
- Jackson EK, Mi Z, Zhu C, Dubey R. Adenosine biosynthesis in the collecting duct. J Pharmacol Exp Ther. 2003;307:888–896. doi: 10.1124/jpet.103.057166. [DOI] [PubMed] [Google Scholar]
- Arima S, Sadayoshi I. The mechanisms underlying altered vascular resistance of glomerular afferent and efferent arterioles in diabetic nephropathy. Nephrol Dial Transplant. 2003;18:1966–1969. doi: 10.1093/ndt/gfg263. [DOI] [PubMed] [Google Scholar]
- Scholey JW, Meyer TW. Control of glomerular hypertension by insulin administration in diabetic rats. J Clin Invest. 1989;83:1384–1389. doi: 10.1172/JCI114026. [DOI] [PMC free article] [PubMed] [Google Scholar]
- Carmines PK, Ohishi K, Ikenaga H. Functional impairment of renal afferent arteriolar-gated calcium channels in rats with diabetes mellitus. J Clin Invest. 1996;98:2564–2571. doi: 10.1172/JCI119075. [DOI] [PMC free article] [PubMed] [Google Scholar]
- Pflueger AC, Schenk F, Osswald H. Increased sensitivity of the renal vasculature to adenosine in streptozotocin-induced diabetes mellitus rats. Am J Physiol. 1995;269:F529–F535. doi: 10.1152/ajprenal.1995.269.4.F529. [DOI] [PubMed] [Google Scholar]
- Zhao Z, Francis CE, Ravid R. An A3-subtype adenosine receptor is highly expressed in rat vascular smooth muscle cells: its role in attenuating adenosine-induced increase in cAMP. Microvasc Res. 1997;54:243–252. doi: 10.1006/mvre.1997.2044. [DOI] [PubMed] [Google Scholar]
- Zhao Z, Makaritsis K, Francis CE, Gavras H, Ravid K. A role for the A3 adenosine receptor in determining tissue levels of cAMP and blood pressure: studies in knock-out mice. Biochim Biophys Acta. 2000;1500:280–290. doi: 10.1016/s0925-4439(99)00111-8. [DOI] [PubMed] [Google Scholar]
- Rudnick MR, Goldfarb S, Wexler L, Ludbrook PA, Murphy MJ, Halpern EF, Hill JA, Winniford M, Cohen MB, VanFossen DB. Nephrotoxicity of ionic and nonionic contrast media in 1196 patients: a randomized trial: the Iohexol cooperative study. Kidney Int. 1995;47:254–261. doi: 10.1038/ki.1995.32. [DOI] [PubMed] [Google Scholar]
- Pflueger A, Larson TS, Nath KA, King BF, Gross JM, Knox FG. Role of adenosine in contrast media-induced acute renal failure in diabetes mellitus. Mayo Clin Proc. 2000;75:1275–1283. doi: 10.4065/75.12.1275. [DOI] [PubMed] [Google Scholar]
- Lee HT, Emala CW. Protective effects of renal ischemic preconditioning and adenosine pretreatment: role of A1 and A3 receptors. Am J Physiol. 2000;278:F380–F387. doi: 10.1152/ajprenal.2000.278.3.F380. [DOI] [PubMed] [Google Scholar]
- Lee HT, Ota-Setlik A, Xu H, D’Agati VD, Jacobson MA, Emala CW. A3 adenosine receptor knockout mice are protected against ischemia- and myoglobinuria-induced renal failure. Am J Physiol. 2003;284:F267–F273. doi: 10.1152/ajprenal.00271.2002. [DOI] [PubMed] [Google Scholar]
- Ditzel J, Brochner-Mortensen J, Kawahara R. Dysfunction of tubular phosphate reabsorption related to glomerular filtration and blood glucose control in diabetic children. Diabetologia. 1982;23:406–410. doi: 10.1007/BF00260952. [DOI] [PubMed] [Google Scholar]
- Amiel C. Sites of renal tubular reabsorption of phosphate. Massry SG, Fleisch H, editors. New York: Plenum; Renal Handling of Phosphate. 1980:pp 39–57. [Google Scholar]
- Knox FG, Hoppe A, Kempson SA, Shah SV, Dousa TP. Cellular mechanism of phosphate transport. Massry SG, Fleisch H, editors. New York: Plenum; Renal Handling of Phosphate. 1980:pp 79–114. [Google Scholar]


