Abstract
Eph receptor tyrosine kinases mediate neurodevelopmental processes such as boundary formation, vasculogenesis, and cell migration. Recently, we found that overexpression of EphB2 in glioma cells results in reduced cell adhesion and increased cell invasion. Since R-Ras has been shown to play a critical role in EphB2 regulation of integrin activity, we explored whether the biological role of EphB2 in glioma invasion is mediated by downstream R-Ras activation. On EphB2 activation, R-Ras associated with the receptor and became highly phosphorylated. Depletion of endogenous R-Ras expression by siRNA abrogated EphB2 effects on glioma cell adhesion, proliferation, and invasion in ex vivo rat brain slices. Anti-proliferative responses to EphB2 activation were consistent with suppressed mitogen-activated protein kinase activity. Moreover, R-Ras was highly phosphorylated in the invading glioma cells. In human brain tumor specimens, R-Ras expression and phosphorylation correlated with increasing grade of gliomas. Laser capture microdissection of invading glioblastoma cells revealed elevated R-Ras mRNA (1.5- to 26-fold) in 100% (eight of eight) of biopsy specimens, and immunohistochemistry revealed high R-Ras localization primarily in glioblastoma cells. The phosphorylation ratio of R-Ras positively correlated with the phosphorylation ratio of EphB2 in glioblastoma tissues. These results demonstrate that R-Ras plays an important role in glioma pathology, further suggesting the EphB2/R-Ras signaling pathway as a potential therapeutic target.
The Eph receptor:ligand system represents the largest family of receptor protein tyrosine kinases, consisting of 14 receptors and 9 interacting ligands, the ephrins. The Eph receptors and ephrins are divided into the two subclasses, A and B, on the basis of their sequence, homologies, structures, and binding affinities.1 Altogether, nine EphA, five EphB, five ephrin-A, and three ephrin-B members are currently known in humans. The Eph receptors are involved in critical processes during development of the nervous system, such as axon guidance, axon fasciculation, tissue border formation, vasculogenesis, and cell migration.2–6 When ligands bind to Eph receptors, the kinase domain becomes phosphorylated, resulting in activation of signaling cascades. Signaling by Eph family receptors is complex due to the variety of intracellular mediators in their activated cascades. For example, ephexin, Src, Nck, RasGAP, Crk, and R-Ras are all reported as downstream mediators.2 In addition, EphB/ephrin-B interactions mediate bidirectional signaling events inducing distinct responses in different cell types.3,7 The detailed mechanisms by which Eph receptors can regulate cell behavior remain primarily unknown, although considerable efforts have been made in recent years to elucidate the biological functions of Eph receptor.2,3,8,9
The oncogene R-Ras, a member of the superfamily of small GTPases and one of the signaling mediators of Eph receptor, has been implicated in several cell functions such as cell adhesion, proliferation, and migration.10 Originally, R-Ras was identified and cloned through its homology to the well-known oncogene H-Ras; 55% of the bp are identical between R-Ras and H-Ras.11 Although, previous studies have shown that malignant gliomas might exhibit activity of three major types of RAS proteins: N-Ras, H-Ras, and K-Ras,12 little information is available regarding the expression of R-Ras in brain tumors.
We recently demonstrated that EphB2 receptor induces glioma cell migration in vitro and is associated with invasive glioma cells in vivo.13 Elevated EphB2 expression has also been observed in carcinomas of the colon, stomach, esophagus, lung, breast,14–17 neuroblastoma,18 and melanoma,19 however, its role in pathogenesis, especially in the process of invasion or metastasis has not been described and little is known about the intracellular signaling pathways of EphB2 receptor in cancer.
In this study, we report signaling pathways of R-Ras downstream EphB2 receptor pertaining to adhesion, proliferation, and invasion. We demonstrate that EphB2 decreases cell-extracellular matrix (ECM) adhesion through R-Ras signaling and reduces cell proliferation by inhibition of the mitogen-activated protein kinase (MAPK) kinase (MEK)/MAPK pathway also through R-Ras signaling. Additionally, EphB2 activation increases cell invasion in ex vivo via R-Ras activity. These results suggest phosphorylated R-Ras downstream of EphB2 appears to play significant roles in the malignant behavior of glioma.
Materials and Methods
Cell Culture Conditions and ECM Preparation
Human astrocytoma cell lines U87, U251, T98G (American Type Culture Collection, Manassas, VA), and SF76720 were maintained in Dulbecco’s modified Eagle’s medium supplemented with 10% fetal bovine serum at 37°C in a humidified atmosphere containing 5% CO2. Astrocytoma-derived ECM was prepared as described previously.20
Antibodies and Reagents
Anti-phosphotyrosine, anti-R-Ras, anti-phospho-p44/42 MAPK, anti-total-p44/42 MAPK antibody, and MEK 1 inhibitor (PD98059)21 were purchased from Cell Signaling Technology (Beverly, MA). Anti-EphB2 polyclonal antibody and ephrin-B1/Fc chimera were purchased from R&D Systems (Minneapolis, MN). Anti-α-tubulin monoclonal antibody was obtained from Oncogene Research (Boston, MA). Control Fc fragments of mouse IgG were purchased from Sigma (St. Louis, MO).
Expression Plasmids and Cell Transfection
The expression plasmid for EphB2 and kinase-inactive EphB2 (EphB2KR; which contains a K662→R mutation in the ATP binding site) were constructed as described previously.13,22 EphB2 or kinase inactive EphB2 cDNA cloned into pEAK, which contains a puromycin-resistant gene, were stably transfected into U251 cells by the calcium phosphate method. Six different clones of U251 were selected for each EphB2 and EphB2KR vector in the presence of 1.5 μg/ml puromycin (Sigma) as described previously.23 Clones were screened for transgene expression by immunoblot analysis. All clones expressed EphB2 or EphB2KR at similar levels. For the various experiments, at least three clones of U251 from each transfection were examined. Stable transfectants of U251 were maintained in culture in the presence of puromycin and were checked periodically (approximately every 4 weeks) for constant expression of EphB2 or EphB2KR. Transient transfection was performed into T98G by Lipofectamine 2000 (Invitrogen, Carlsbad, CA) as recommended by the manufacturer’s protocol. Cells transfected with the empty plasmid vector were used as controls.
Immunoprecipitation and Immunoblot Analysis
For immunoprecipitation, monolayers of cells or glioma tissue specimens were lysed on ice for 10 minutes in a buffer containing 10 mmol/L Tris-HCl, pH 7.4, 0.5% Nonidet P-40, 150 mmol/L NaCl, 1 mmol/L phenylmethyl sulfonyl fluoride, 1 mmol/L ethylenediamine tetraacetic acid, 2 mmol/L sodium vanadate, 10 μg/ml aprotinin, and 10 μg/ml leupeptin (Sigma) as previously described.24 Protein concentrations were determined using the bicinchoninic acid assay procedure (Pierce Chemical Co., Rockford, IL), with bovine serum albumin as a standard. Equivalent amounts of protein (200 μg) were precleared and immunoprecipitated from the lysates, washed with lysis buffer followed by S1 buffer (10 mmol/L HEPES, pH 7.4, 0.15 mol/L NaCl, 2 mmol/L ethylenediamine tetraacetic acid, 1.5% Triton X-100, 0.5% deoxycholate, 0.2% sodium dodecyl sulfate). Samples were then resuspended in 2× sodium dodecyl sulfate-sample buffer (0.25 mol/L Tris-HCl, pH 6.8, 2% sodium dodecyl sulfate, 25% glycerol) and denatured with 2-mercaptoethanol (Sigma), separated by 10% sodium dodecyl sulfate-polyacrylamide gel electrophoresis, and transferred to nitrocellulose (Invitrogen) by electroblotting. The nitrocellulose membrane was blocked with 5% bovine serum albumin in Tris-buffered saline, pH 8.0, with 0.1% Tween-20 before addition of primary antibody. Membranes were washed and then incubated with horseradish peroxidase-conjugated secondary antibody. Bound secondary antibodies were detected using a chemiluminescence system (NEN, Boston, MA).
Immunohistochemistry and Immunofluorescent Microscopy
Paraffin-embedded tissue blocks were sectioned (6 μm thick) onto slides and then deparaffinized. Sections were quenched with 3% hydrogen peroxide in methanol for 15 minutes, microwaved 5 minutes in H2O, and blocked for 1 hour with Tris-buffered saline (0.05 mol/L Tris-HCl, pH 7.6, 0.25 mol/L NaCl) containing 3% goat serum and 0.1% Triton X-100. Slides were incubated in rabbit anti-R-Ras antisera or rabbit preimmune sera (1:100 dilution) overnight at 4°C. The secondary antibody (biotin-conjugated goat anti-rabbit IgG; Jackson Laboratories, Bar Harbor, ME) was applied at a 1:500 dilution in Tris-buffered saline containing 1% goat serum, followed by streptavidin-conjugated horseradish peroxidase (1:500 dilution; Amersham Biosciences, Piscataway, NJ). Sections were exposed to diaminobenzidine peroxidase substrate (Sigma) for 5 minutes and counterstained with Mayer’s hematoxylin.
For immunofluorescence, cells were fixed in 4% paraformaldehyde for 30 minutes and permeabilized for 5 minutes in 0.1% TX-100 phosphate-buffered saline (PBS) buffer. After washing with PBS, cells were blocked with 2% bovine serum albumin and 3% goat serum and incubated with anti-EphB2 antiserum (1:100 dilution), or anti-R-Ras antiserum (1:100 dilution) for 1 hour at 25°C. Negative controls were stained with a 1:50 dilution of preimmunization goat sera. Cells were incubated for 30 minutes with 1:100 dilution of Cy3-conjugated anti-goat antibody or fluorescein isothiocyanate-conjugated anti-rabbit antibody (Boehringer Mannheim, Indianapolis, IN). Fluorescence was monitored by inverted confocal laser microscopy (Carl Zeiss, New York, NY).
Silencing of Endogenous R-Ras with Small Interfering RNA (siRNA)
Purified, duplexed siRNAs for R-Ras and for control luciferase were purchased from Qiagen (Valencia, CA). The siRNA sequence targeting human R-Ras (GenBank accession number NM_006270) was from position 811 to 831 (GTCTCCCAGGACACATCACAT). The sequence was designed to be unique when compared with the sequence of other Ras members. Twenty nm of siRNA was transfected into U87 cells cultured in 60-mm diameter dishes using Lipofectamine 2000. siRNA was also transfected into U251 stably transfected with control or EphB2 plasmids and co-transfected into T98G with control or EphB2 plasmids. Transfected cells were cultured for an additional 48 hours before use.
Cell Adhesion Assay
Cell adhesion assay was performed as described previously.25 Briefly, 96-well plastic plates were precoated with astrocytoma-derived ECM. Control dishes were prepared by blocking with bovine serum albumin alone. Cells were then plated at 1 × 10⁴ cells/well and allowed to adhere to the dishes for 2 hours at 37°C before staining with 1% crystal violet. After the plate was washed with PBS, total crystal violet bound to the cells was eluted with 10% acetic acid and measured by absorbance at 590 nm (Spectrafluor Plus; TECAN, Durham, NC).
Cell Proliferation Assay
The Alamar Blue assay (Biosource, Camarillo, CA) was used to assess proliferation as described previously.26 Briefly, 1000 cells of each population were seeded in quadruplicate wells of 96-well plastic plates in 200 μl of culture medium supplemented with 10% fetal bovine serum. The plates were incubated for 4 hours at 37°C and Alamar Blue was added in a volume of 20 μl (10% of total volume) to the cells and incubated for 3 hours. The plate was read on a fluorescence plate reader (excitation, 530 nm; emission, 590 nm) at 24, 48, 72, and 96 hours. Averages of the absorbance values were calculated and plotted. To investigate the influence of R-Ras/MEK/MAPK pathway on cell proliferation, U87 cells transfected with or without R-Ras siRNA, U251 and T98G cells transfected with pEAK or EphB2 with or without R-Ras siRNA transfection were seeded in the proliferation assay format and allowed to adhere. The medium was then exchanged for serum-free medium containing 50 μmol/L PD98059 and cell number was evaluated daily for 4 days. Additionally, cells were separately harvested at 24, 48, 72, and 96 hours and counted. Doubling time (TD) was calculated by the following formula: TD = (t − t0) log2/(logN − logN0) (t, t0, time when cells were counted; N, N0, cell numbers at t, t0).
Ex Vivo Invasion Assay on Rat Brain Slices
The ex vivo invasion assay on rat brain slices was performed as described previously.13 Briefly, 400-μm-thick sections were prepared from Wistar rat [Crl:(WI)BR; Charles River Lab, Wilmington, MA] brain cerebrum. Approximately 1 × 10⁵ glioma cells stably expressing green fluorescence protein (GFP) were gently placed (0.5-μl transfer volume) on the putamen of the brain slice. Typically, six brain slices were used in the each experiment. Imaging of specimens was performed at ×10 magnification using a macro-fluorescent imaging system (SZX12-RFL3; Olympus, Tempe, AZ) equipped with a GFP barrier filter (DP50, Olympus) at 12 hours, and 60 hours after seeding the cells. Images were processed using Adobe Photoshop. Glioma cell invasion into the rat brain slices was quantitated using a LSM 5 Pascal laser-scanning confocal microscope (Zeiss, Thornwood, NY) to observe GFP-labeled cells on the tissue insert with the micropore filter membrane. Serial sections were obtained every 10 μm downward from the surface plane to the bottom of the slice. The invasion rate was calculated as described previously.13 In brief, for each focal plane, the area of fluorescent cells was calculated and plotted as a function of the distance from the top surface. The extent of glioma cell invasion was calculated as the depth corresponding to half of the maximum area. After the ex vivo invasion assay, invading and noninvading cells of U251 and T98G cells transfected with EphB2, as well as U87 cells, were manually collected under the fluorescent microscope (SZX12-RFL3), followed by immunoprecipitation studies as described above.
Clinical Samples and Histology
Under an institutional review board-approved protocol, fresh human brain tumor tissues were obtained from 26 patients who underwent therapeutic removal of astrocytic brain tumors. Nonneoplastic control brain tissues were identified from the margins of the tumors when possible. Histological diagnosis was made by standard light-microscopic evaluation of the sections stained with hematoxylin and eosin. The classification of human brain tumors used in this study is based on the revised World Health Organization criteria for tumors of the central nervous system.27 The 26 astrocytic tumors consisted of 7 low-grade astrocytomas, 8 anaplastic astrocytomas, and 11 glioblastomas. All of the tumor tissues were obtained at primary resection, and none of the patients had been subjected to chemotherapy or radiation therapy before resection.
Laser Capture Microdissection
Cryopreserved glioblastoma specimens from eight patients were cut in serial 6- to 8-μm sections and mounted on uncoated slides treated with diethyl pyrocarbonate. Approximately 3000 individual cells were collected for quantitative reverse transcription-polymerase chain reaction (QRT-PCR) analysis as described previously.28 Laser capture microdissection was performed with a PixCell II Microscope (Arcturus Engineering, Inc., Mountain View, CA). Neoplastic astrocytes in the invasive rim ∼1 cm from the edge of the tumor core were identified according to the criteria of nuclear atypia (coarse chromatin, nuclear pleomorphism, multinucleation) and, whenever possible, according to nuclear and/or cytoplasmic similarity with the glioblastoma cells in the core. Reactive astrocytes were identified by morphology and were avoided.
Real-Time QRT-PCR
QRT-PCR was performed in a LightCycler (Roche Diagnostics, Indianapolis, IN) with SYBR green fluorescence signal detection after each cycle of amplification as described previously.28 PCR was performed with the following primers: R-Ras (NM_006270): sense, 5′-CAAGGACCGCGACGACTTC-3′; anti-sense, 5′-CACTGGGAGGGCTCGGTGGG-3′ (amplicon size, 227 bp); histone H3.3 (NM_002107): sense, 5′-CCACTGAACTTCTGATTCGC-3′; anti-sense, 5′-GCGTGCTAGCTGGATGTCTT-3′ (amplicon size, 215 bp). The nucleotide number and amplicon size for each primer are presented in parentheses. The quantification of mRNA was performed at least three times for each sample and the PCR data were analyzed with the LightCycler analysis software as described previously.28
Statistics
Statistical analyses were performed using the χ2 test, the two-tailed Mann-Whitney U-test, and two-way analysis of variance. P < 0.05 was considered significant.
Results
Characterization of R-Ras Phosphorylation Levels of R-Ras in Glioma Cell Lines
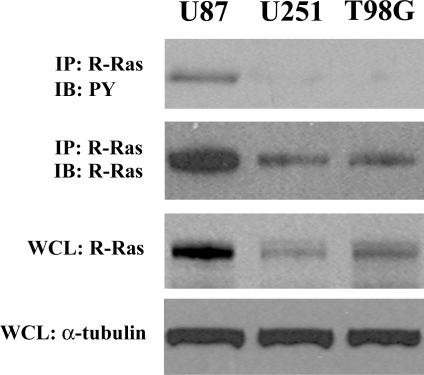
Since EphB2 has previously been shown to signal downstream through R-Ras,29 we investigated the levels of R-Ras phosphorylation in three glioma cell lines. Immunoblot analysis of total cellular lysates for R-Ras protein showed differential expression of R-Ras protein levels among the three glioma cell lines examined (Figure 1). U87 glioma cells displayed the highest levels of R-Ras protein. To determine the endogenous levels of R-Ras phosphorylation in glioma cells, we immunoblotted the R-Ras immunoprecipitates with a specific monoclonal antibody recognizing the phosphorylated tyrosine residues. Tyrosine-phosphorylated R-Ras was detected only in U87 cells, a glioma cell line previously shown to express high endogenous levels of EphB2 and faster intrinsic migratory rate among the three cell lines examined.13
Figure 1.
Characterization of R-Ras expression in human glioma cell lines. Immunoprecipitation using total cell lysate from each of the indicated cell lines was performed. Equal amounts of cell lysates were immunoprecipitated with anti-R-Ras antibody. The immunoprecipitates were probed by immunoblotting with the antibody indicated. PY, phosphotyrosine. Whole cell lysates (WCL) were also immunoblotted with anti-R-Ras or anti-α-tubulin antibody to control for equal protein loading of the three cell lines.
Overexpression of the EphB2 Receptor Results in R-Ras Phosphorylation and Recruitment to EphB2
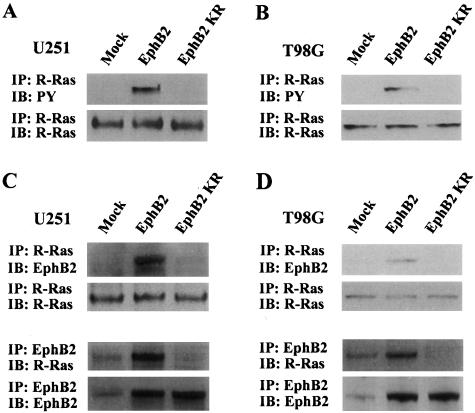
To determine whether tyrosine phosphorylation of R-Ras is dependent on EphB2 activation in glioma cells, we examined levels of R-Ras phosphorylation in U251 cells stably expressing EphB2 wild-type receptor or a kinase-deficient EphB2 receptor (EphB2KR). U251 cells expressing EphB2 wild-type protein showed high R-Ras tyrosine phosphorylation as compared to control mock-transfected cells (Figure 2A). However, overexpression of EphB2KR failed to activate R-Ras phosphorylation, suggesting that EphB2 signals downstream for R-Ras phosphorylation in glioma cells. Expression of either EphB2 wild-type receptor or EphB2KR did not change endogenous levels of R-Ras protein (Figure 2A). Moreover, immunoprecipitation analysis of R-Ras revealed co-precipitation of EphB2 wild-type receptor but not EphB2KR. Co-precipitation of R-Ras after immunoprecipitation of EphB2 was also verified (Figure 2C). Similar results were observed in T98G cells transiently transfected with the EphB2 wild-type receptor or EphB2KR (Figure 2, B and D), indicating that biological signaling by EphB2 through R-Ras in glioma cells is not cell line-specific. These results suggest that the interaction of EphB2 with R-Ras is specific and depends on the kinase activity or phosphorylation status of the EphB2 receptor.
Figure 2.
R-Ras phosphorylation and recruitment to EphB2 by overexpression of EphB2. A and B: Extracts of U251 (A) and T98G (B) cells transfected with EphB2, EphB2KR, or pEAK (mock) were subjected to immunoprecipitation (IP) with anti-R-Ras antibody. The immunoprecipitates were probed by immunoblotting (IB) as indicated. PY, phosphotyrosine. C and D: Equal amounts of cell lysates from U251 (A) and T98G (B) transfected with EphB2, EphB2KR, or pEAK (mock) were immunoprecipitated with anti-R-Ras or anti-EphB2. The immunoprecipitates were probed by immunoblotting as indicated.
R-Ras and EphB2 Co-Localize in Lamellipodial Structures
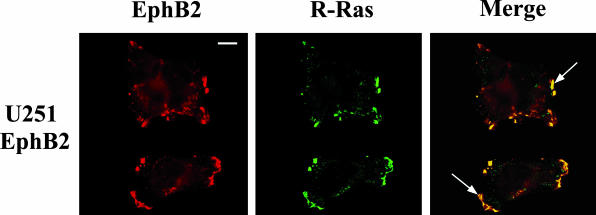
To further confirm the association of R-Ras and EphB2, we performed immunolocalization studies to determine the localization of R-Ras and EphB2 in U251 cells stably transfected with EphB2. Both EphB2 and R-Ras were detected on the cell surface (Figure 3). Co-localization of R-Ras with EphB2 was observed at the cell surface in the lamellipodial formation (Figure 3, arrows). These results further suggest that EphB2 forms stable complexes with R-Ras and that this complex is localized to lamellipodial formation.
Figure 3.
Co-localization of EphB2 and R-Ras in glioma cells. U251 cells stably transfected with EphB2 were co-stained for R-Ras (fluorescein-isothiocyanate stained) and EphB2 (Cy3 stained), and examined by confocal laser microscopy. Arrow in panel merge indicates that R-Ras co-localized with EphB2 in lamellipodial structure. Scale bar, 10 μm.
EphB2 Alters Glioma Cell-ECM Adhesion via R-Ras Signaling Pathway
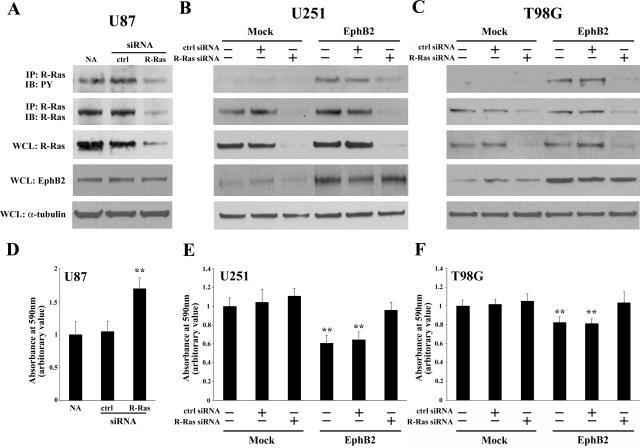
We recently demonstrated that human glioblastoma tissue specimens have highly phosphorylated EphB2, consistent with U87 glioma.13 To make U251 and T98 glioma cells more physiologically relevant, EphB2 expression vector was transfected and used for several functional assays. Previously, we showed that overexpression of EphB2 in glioma cells decreases cell-ECM adhesion.13 To determine whether R-Ras plays a functional role in EphB2-mediated glioma cell-ECM adhesion, we used siRNA to specifically silent endogenous R-Ras levels. The level of mRNA inhibition of R-Ras was ∼93% and did not affect the expression levels of other Ras family members including H-Ras, K-Ras, M-Ras, and N-Ras (data not shown). Inhibition of R-Ras protein expression by R-Ras-directed siRNA was also verified in three glioma cell lines by Western blot analysis using antibodies specific to R-Ras, whereas control luciferase siRNA had no effect on R-Ras protein level (Figure 4; A to C). Forced expression of EphB2 in U251 and T98G cells resulted in decreased cell-ECM attachment (Figure 4, E and F). However, it was recovered in the presence of siRNA for R-Ras but not for control luciferase (Figure 4, E and F). In addition, depletion of R-Ras by siRNA also increased the cell-ECM adhesion of the endogenously high EphB2/R-Ras-expressing U87 cells (Figure 4, A and D). These results suggest that signals transduced by EphB2 via R-Ras reduce glioma cellular adhesion to the ECM.
Figure 4.
EphB2 decreases adhesion through the R-Ras signaling pathway. A to C: Extracts of U87 (A) cells treated by siRNA for R-Ras or control luciferase, U251 (B) or T98G (C) cells transfected with EphB2 or pEAK (mock) treated by siRNA for R-Ras or control luciferase were subjected to immunoprecipitation (IP) with anti-R-Ras antibody. The immunoprecipitates were probed by immunoblotting (IB) as indicated. PY, phosphotyrosine. Whole cell lysates (WCL) were also immunoblotted with anti-R-Ras, anti-EphB2, or anti-α-tubulin antibodies. D to F: U87 (D) cells treated by siRNA for R-Ras or control luciferase, U251 (E) or T98G (F) cells transfected with EphB2 or pEAK (mock) cells treated by siRNA for R-Ras or control luciferase were plated on dishes coated with astrocytoma-derived ECM and adhesion assay was performed as described in Materials and Methods. The mean absorbance value from no addition (NA) of mock cells in each cell line is shown as 1. Bars, SD; **, P < 0.01 versus NA in mock.
Activation of R-Ras by EphB2 Inhibits the MAPK Pathway and Results in Decreased Cell Proliferation
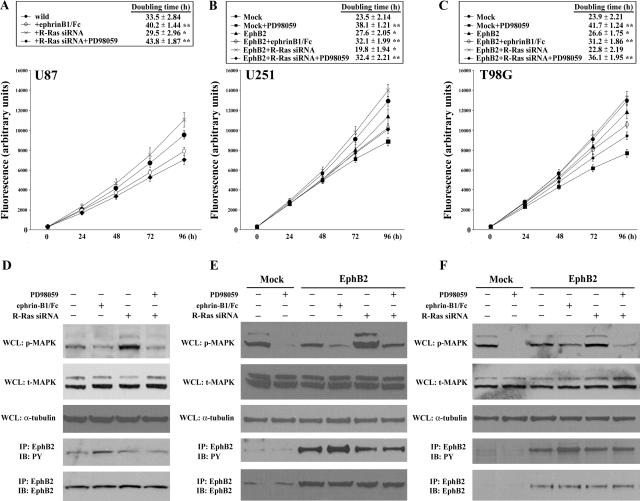
To examine functional effects of EphB2 in cell growth, we assessed the changes in cell number throughout time in EphB2-expressing glioma cells by the Alamar Blue assay and cell counting. In preliminary studies, cells transfected with EphB2 do not display any cytotoxic effects as determined by changes in 4′,6′-diamidino-2-phenylindole hydrochloride staining, propidium iodide uptake, and immunostaining with anti-activated caspase 3 antibodies (data not shown). As shown in Figure 5, overexpression of EphB2 in U251 and T98G cells resulted in decreased cell growth as compared to mock transfectants (Figure 5, B and C). Decreased cell growth was further observed in EphB2-expressing U251 and T98G cells in the presence of ephrinB1/Fc ligand. Likewise, activation of endogenous EphB2 in U87 cells by ephrinB1/Fc ligand also significantly reduced cell proliferation (Figure 5A). No significant change in growth was observed between EphB2-expressing cells with or without treatment with control Fc (data not shown). These data support a specific role of EphB2 signaling that retards cell proliferation.
Figure 5.
Decreased cell proliferation by EphB2 is dependent on R-Ras-dependent inhibition of MAPK pathway. A to C: U87 (A) cells treated by siRNA for R-Ras, U251 (B) or T98G (C) cells transfected by EphB2 or pEAK (mock) treated with siRNA for R-Ras, were grown in the presence of 50 μmol/L PD98059 or 2 μg/ml of soluble ephrinB1/Fc chimera for 4 hours at 37°C and Alamar Blue was added. The plate was read on a fluorescence plate reader (excitation, 530 nm; emission, 590 nm) at the indicated time points. The doubling time was also calculated. *, P < 0.05; **, P < 0.01 versus wild (U87) or mock (U251 and T98G). D to F: Whole cell lysates (WCL) of U87 (D) cells treated by siRNA for R-Ras, U251 (E) or T98G (F) cells transfected with EphB2 or pEAK (mock) treated by siRNA for R-Ras, 50 μmol/L PD98059 or 2 μg/ml soluble ephrinB1/Fc chimera were immunoblotted with anti-phospho-p44/42 MAPK (p-MAPK), anti-total-p44/42 MAPK (t-MAPK), or anti-α-tubulin antibodies. Extracts of cells were also subjected to immunoprecipitation (IP) with anti-EphB2 antibody. The immunoprecipitates were probed by immunoblotting (IB) as indicated. PY, phosphotyrosine.
We investigated whether R-Ras signaling downstream of EphB2 impedes cell growth. Depletion of R-Ras expression in U87 cells (Figure 5A) or EphB2-overexpressing cells, U251 and T98G (Figure 5, B and C) restored cell growth as compared to no transfection control; R-Ras-depleted cells had the fastest doubling times of all conditions. Luciferase siRNA (inert control treatment) did not rescue the growth rate suppression in EphB2-transfected cells (doubling time of U87, 33.8 ± 3.12 hours; U251, 27.9 ± 2.42 hours; and T98G, 26.3 ± 1.98 hours; data not shown in Figure 5). In addition, because the MAPK pathway is important for cell proliferation, we examined the phosphorylation level of MAPK using a specific monoclonal antibody recognizing the phosphorylation sites on Thr202/Tyr204 of MAPK. Depletion of R-Ras expression in the three glioma cell lines resulted in an increased phosphorylation of MAPK but not total MAPK expression (Figure 5; D to F). Likewise, inhibition of MEK1/MAPK function by PD98059, in EphB2-expressing cells transfected with the R-Ras siRNA, resulted in a decrease in cell growth rate in all three glioma cell lines. Interestingly, the phosphorylation level of EphB2 did not change regardless of R-Ras knockdown and inhibition of MAPK by PD98059 (Figure 5; D to F). Taken together, these results suggest the EphB2/R-Ras-signaling complex inhibits the MEK/MAPK pathway resulting in decreased cell proliferation.
EphB2 Increases Invasion via R-Ras in ex Vivo Rat Brain Slice
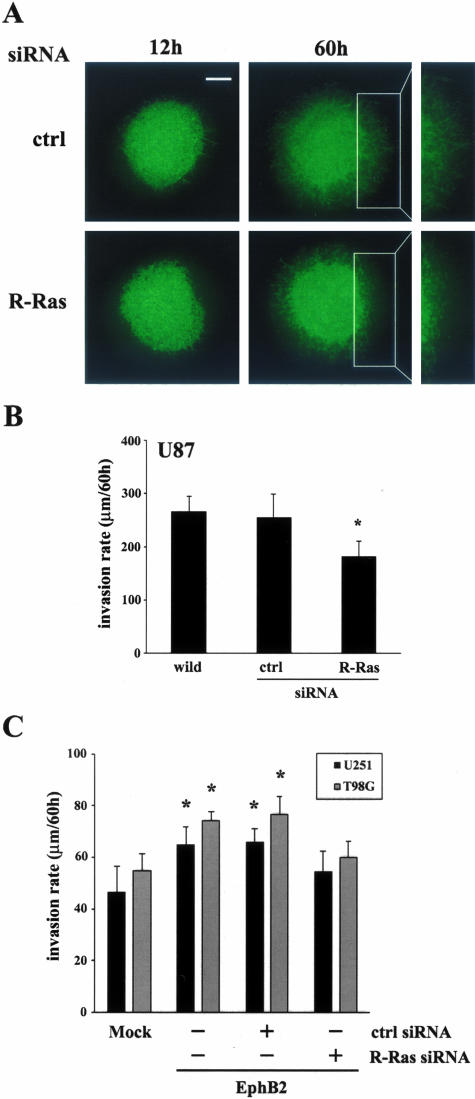
To evaluate effects of R-Ras on glioma cell invasion through physiologically and anatomically relevant tissue, we determined whether RNA interference-mediated depletion of R-Ras inhibits the invasion of GFP-expressing human glioma cells into vital rat brain slices, a well-established organotypic model for glioma invasion that we have modified recently.13 U87 cells treated with siRNA for R-Ras or luciferase were implanted in the putamen on contralateral sides of the same rat brain slice; images were taken at 12 and 60 hours after implantation. U87 treated with siRNA for R-Ras displayed lesser migration and invasion into the organotypic rat brain slice as compared with the invasive cells treated with control luciferase siRNA (Figure 6A). Invasion was quantified by confocal microscopy, as detailed in Materials and Methods. Depletion of R-Ras in U87 causes a decrease in cell invasion (182.3 ± 27.8 μm/60 hours) compared with the cells treated with siRNA for control luciferase (254.7 ± 44.5 μm/60 hours, P < 0.05) (Figure 6B). We recently showed that EphB2 induced U251 cell invasion in the rat brain slice model.13 As shown in Figure 6C, depletion of R-Ras cancelled the increase of invasion in U251 or T98G cells transfected with EphB2. These data suggest that R-Ras downstream of EphB2 plays a role in glioblastoma cell invasion.
Figure 6.
Cell invasion in organotypic rat brain slice. A: U87 glioma cells stably expressing GFP were transfected with siRNAs directed against luciferase (control) or R-Ras, 2 days before implantation into the bilateral putamen on rat organotypic brain slice and observed at the indicated times. B: Invasion rate of U87 cells treated with the indicated siRNA constructs were calculated from z axis images collected by confocal laser-scanning microscopy; Bars, SE. *, P < 0.05. The mean value of invasion rates was obtained from six independent experiments. C: Invasion rates of U251 and T98G cells stably expressing GFP were co-transfected with EphB2 and R-Ras siRNA or control siRNA were calculated as same as above. Scale bar, 500 μm.
R-Ras Is Phosphorylated in Invading Cells in ex Vivo Rat Brain Slice
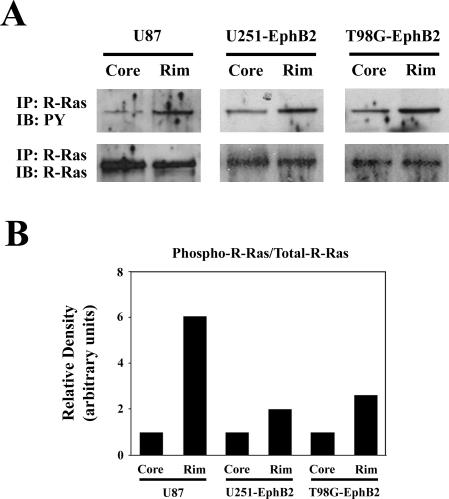
To confirm the functional role of R-Ras in invading cells, we examined the phosphorylation level of R-Ras by manually isolating invading cells and tumor core cells from U87 cells and U251 and T98G cells transfected with EphB2 after their placement in the ex vivo brain slice invasion assay. Immunoprecipitation analysis of R-Ras in these two subcellular populations showed an increase in phosphorylated R-Ras (twofold to sixfold) in invading glioma cells as compared to the tumor core cells (Figure 7). These data further support the notion that phosphorylation of R-Ras plays a role in glioma cell invasion.
Figure 7.
Phosphorylation of R-Ras in invading glioma cells in organotypic brain slice. A: U87 cells, U251 and T98G cells transfected with EphB2 were collected from invading edge or stationary core on rat brain slice, and then subjected to immunoprecipitation (IP) with anti-R-Ras antibody. The immunoprecipitates were probed by immunoblotting (IB) with anti-phosphotyrosine antibody (PY) or anti-R-Ras antibody. B: Signals were quantified by densitometry using Gel Expert software by Nucleovision. Representative ratio is shown from three experiments.
Overexpression of R-Ras in Invading Glioblastoma Cells
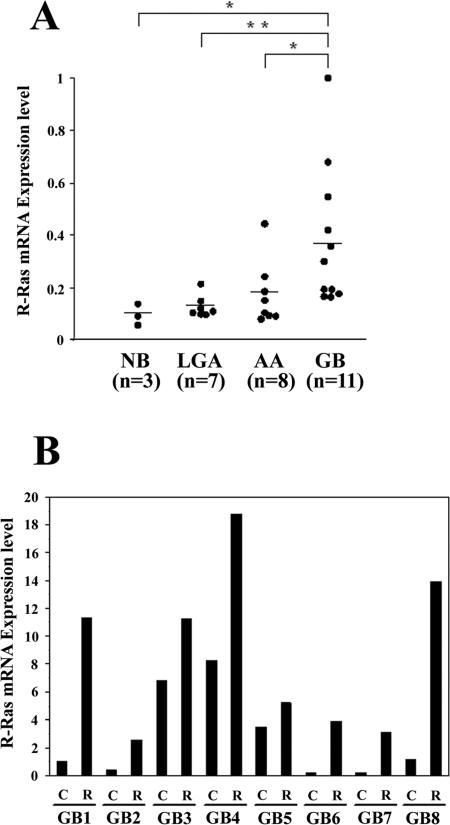
To assess a role for R-Ras in the malignant behavior of human gliomas, expression of R-Ras in human normal brain and astrocytic brain tumor tissues was examined by QRT-PCR using histone H3.3 mRNA as an internal quantitative reference. Levels of the R-Ras mRNA (R-Ras mRNA:histone H3.3 mRNA ratios) were significantly higher in glioblastoma samples (mean ± SD, 0.380 ± 0.27; n = 11) than those in anaplastic astrocytoma tissues (0.172 ± 0.123; P < 0.05; n = 8), low-grade astrocytoma tissues (0.126 ± 0.042; P < 0.01; n = 7) and normal brain tissues (0.108 ± 0.023; P < 0.05; n = 3; Figure 8A). To evaluate a potential association of R-Ras expression in the context of glioma invasion in vivo, we collected invading glioblastoma cells and glioma cells in the tumor core by laser capture microdissection of eight glioblastoma surgical specimens, then performed QRT-PCR of the isolated RNA. R-Ras was overexpressed in invading glioblastoma cells (1.5- to 26-fold) relative to the cells in the tumor core in all eight biopsy specimens (Figure 8B).
Figure 8.
Expression of R-Ras in various human astrocytic tumors. A: Relative mRNA expression levels of R-Ras gene (R-Ras mRNA:histone H3.3 mRNA ratios) in normal brain (NB), low-grade astrocytoma (LGA), anaplastic astrocytoma (AA), and glioblastoma (GB) were analyzed by QRT-PCR. Each mRNA level is expressed as a proportion of the highest mRNA level of R-Ras, which was given a value of 1. Horizontal bars indicate mean values. *, P < 0.05; **, P < 0.01. B: R-Ras expression was determined by QRT-PCR, in tumor core cells (columns C) and invading cells (columns R) in eight glioblastoma cases (GB1 to GB8) captured by laser capture microdissection. mRNA levels (R-Ras mRNA:histone H3.3 mRNA ratios) are expressed as proportions of the mRNA level of R-Ras in the GB1 core, which was given a value of 1.
Immunochemical Localization of R-Ras in Glioblastoma Specimens
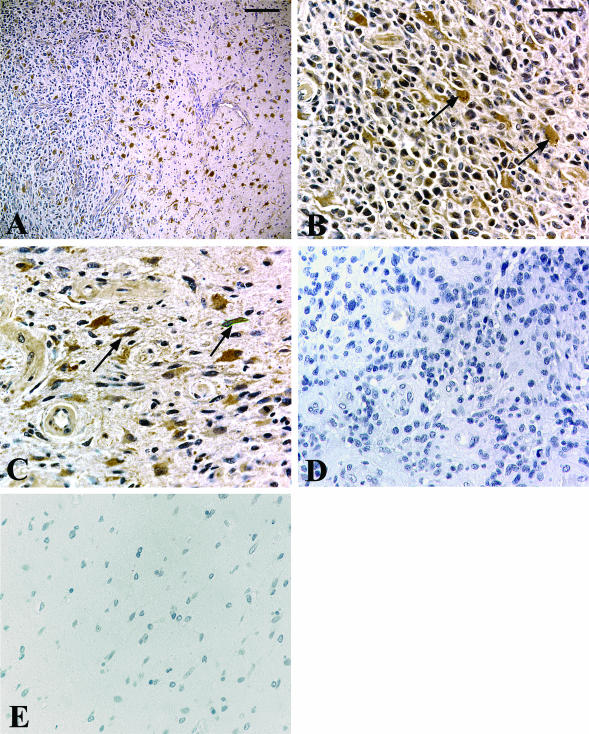
Cells expressing R-Ras in sections of normal brains and glioblastoma specimens were identified using immunohistochemistry. R-Ras was immunolocalized mainly in the neoplastic astrocytes in all of the glioblastoma cases (five of five cases; Figure 9, A and B). Invading neoplastic cells also contained significant staining for R-Ras (Figure 9, A and C). Neoplastic astrocytes were identified by nuclear atypia in hematoxylin and eosin-stained sections and were confirmed by immunopositivity for glial fibrillary acidic protein staining (data not shown). Endothelial cells of blood vessels in the glioblastoma tissues and reactive astrocytes were occasionally immunostained positively for R-Ras. No staining was observed in the normal brains (Figure 9E) or when preimmune serum was substituted for primary antibody (Figure 9D). These results are consistent with that of QRT-PCR findings.
Figure 9.
Immunolocalization of R-Ras in glioblastoma tissues and normal brain tissues. Paraffin sections were immunostained with polyclonal antibodies against R-Ras (A: invading front in low magnification; B and C: high magnification) or nonimmune rabbit IgG (D). Note the R-Ras immunostaining in the glioblastoma cells at the central region in the tumor (B, arrows), as well as in invading glioblastoma cells at the tumor border (C, arrows), whereas no staining is observed in the normal brain with anti-R-Ras antibody (E) and glioblastoma with nonimmune IgG (D). Hematoxylin counterstain. Scale bars: 200 μm (A); 50 μm (B).
Phosphorylation of R-Ras Is Correlated with Phosphorylation of EphB2 in Glioblastoma Samples
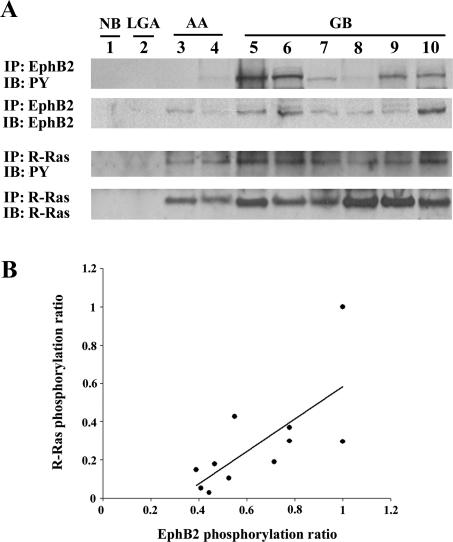
By immunoprecipitation and Western blot, tyrosine-phosphorylated EphB2 and R-Ras were identified in tissue homogenates of glioblastoma samples (Figure 10A). Consistent with the QRT-PCR results, protein levels of R-Ras were increased in glioblastoma tissue relative to normal brain, low-grade astrocytoma, and anaplastic astrocytoma (Figure 10A). Immunoprecipitation of the normal brain or low-grade astrocytoma samples did not detect tyrosine-phosphorylated EphB2 and R-Ras. Phosphorylation ratios of R-Ras plotted against phosphorylation ratios of EphB2 in each glioblastoma case (n = 11) showed a direct correlation (r = 0.694, P < 0.05) (Figure 10B).
Figure 10.
Phosphorylation of R-Ras and its correlation with EphB2 phosphorylation in glioblastoma tissues. A: Results of immunoprecipitation using total cell lysate. Equal amounts of cell lysates were immunoprecipitated (IP) with anti-EphB2 or anti-R-Ras antibodies. The immunoprecipitates were probed by immunoblotting (IB) with the antibody indicated. PY, phosphotyrosine. B: Correlation of R-Ras phosphorylation ratio with EphB2 phosphorylation ratio in glioblastomas. Signals were quantified by densitometry using software by Nucleovison and the phosphorylation ratio levels (phospho-EphB2:total-EphB2 or phospho-R-Ras:total-R-Ras ratios) were calculated. Direct correlations are observed with correlation coefficients of r = 0.694 (P < 0.05).
Discussion
The process of cellular invasion accesses complex biomechanical events that lead to dynamic alterations in cell-substrate attachment and increased cell motility; coincidentally, migrating cells use cytoplasmic biochemical signaling cascades that also may affect cell survival. In fact, however, the signals that regulate glioma cell migration and survival are mostly independently investigated but only poorly integrated from a systems biology perspective, if at all. In this study, we analyzed the function of R-Ras downstream of EphB2 that mediates glioma cell migration and invasion. Forced expression of EphB2 in U251 glioma cells altered cell-ECM adhesion, increased cell migration, and unexpectedly decreased cell growth rates. Glioma cells expressing EphB2 showed increased R-Ras phosphorylation and concomitantly decreased proliferation. R-Ras protein was detected in EphB2 immunoprecipitates; co-localization of R-Ras and EphB2 was observed in lamellipodia at the leading edge of cell migration. Silencing of R-Ras using siRNA in EphB2-expressing cells resulted in increased cell-ECM attachment, increased proliferation that included activation of the MEK/MAPK pathway, and decreased invasion in ex vivo brain slice, suggesting that R-Ras plays a main role as downstream signaling from EphB2. In addition, expression and phosphorylation of R-Ras were up-regulated in glioblastoma, and most pronouncedly in the invading cells. The phosphorylation ratio of R-Ras was correlated with the phosphorylation ratio of EphB2 in glioblastoma tissues, providing evidence of EphB2/R-Ras signaling in glioblastoma. Thus, the present study supports a role for R-Ras downstream from EphB2 signaling pathways contributing to glioblastoma invasion.
In vivo examination of R-Ras in glioma biopsy specimens showed that the levels of R-Ras mRNA, protein, and tyrosine-phosphorylated form of the protein are significantly higher in glioblastoma tissue than normal brain, low-grade astrocytoma, or anaplastic astrocytoma. The increase in R-Ras mRNA and protein in tumor tissue is ascribed to astrocytic tumor cells because R-Ras immunolocalized predominantly to glioma cells. Based on the observation that invading cells in vivo overexpressed R-Ras, and that R-Ras protein was detected by immunohistochemistry in invading glioblastoma cells, it seems likely that the production level of R-Ras is up-regulated in the invading tumor cells. Confirmation of R-Ras phosphorylation in actively invading glioma cells in ex vivo rat brain slices, concomitant with our recent data showing overexpression and phosphorylation of EphB2 in invading glioblastoma cells,13 further support the biological role of R-Ras in glioma invasion. Thus, our results suggest that the EphB2/R-Ras signaling pathway may contribute to the malignant behavior of glioblastoma and may drive invasion of glioma cells into normal brain tissue.
Decreased adhesion is thought to promote tumor cell invasion.30 Our study shows that EphB2 signaling leads to phosphorylation of R-Ras and reduced cell-ECM adhesion, which are both recovered by R-Ras knockdown; this suggests that R-Ras is involved in the decrease of adhesion downstream of EphB2. Additionally, PD98059 did not affect cell adhesion by EphB2-expressing cells co-transfected with the R-Ras siRNA (data not shown), signifying that the MEK/MAPK pathway is not involved in cell-ECM adhesion. Similar results were obtained using 293T cells transiently transfected with EphB2, indicating EphB2 inhibits cell adhesion through tyrosine phosphorylation in the effector domain of R-Ras, which suppresses the ability of R-Ras to support integrin activity.29,31 R-Ras reportedly influences integrin activation by both direct mechanisms30 and indirect mechanisms.32 Our results contrast with a previous report that R-Ras promotes formation of focal adhesion through the phosphorylation of focal adhesion kinase (FAK) in HeLa cells or breast epithelial cells.33,34 Such a discrepancy could be cell type-dependent because blocking of R-Ras in U251 or T98G transfected with EphB2 did not affect the phosphorylation level of FAK (data not shown). Based on our results, we speculate that R-Ras plays a central role in the downstream signaling of EphB2 by modulating inside-out integrin signaling that mediates cell-ECM adhesion in invading glioma cells.
Collective evidence shows that the MEK/MAPK pathway plays an important role in regulating mitogenesis and is involved specifically in the proliferative behavior of glial tumors.35 We demonstrated that EphB2 signaling decreased cell growth coincident to dephosphorylation of MAPK. Decreased MAPK phosphorylation could be prevented by knockdown of R-Ras, suggesting EphB2/R-Ras signaling leads to retarded proliferative activity through inhibition of MEK/MAPK. Our results are consistent with previous findings that EphB2 receptors negatively regulate MAPK, resulting in a reduction of mitogenic signals in neuronal cells,36 and unlike other Ras proteins, R-Ras does not activate the MEK/MAPK pathway.37,38 Our previous studies showed that invasive cells show a lower proliferation rate compared with the dense core of glioblastoma both in vitro and in vivo.39
Overexpression of EphB2 increased invasion as previously shown with an ex vivo organotypic rat brain slice model.13 The present study shows that the increased invasion induced by EphB2 signaling is reversed by R-Ras knockdown. This suggests that R-Ras is involved in the increase of invasion downstream of EphB2. Similarly, R-Ras signals have been shown to promote invasion in breast epithelial cells40 and in a cervical carcinoma cell line.37 Separately, we found that the phosphatidylinositol 3-kinase/Akt pathway, which is an additional important signal transduction pathway in glioblastoma, participates in events leading to high migratory activity after EphB2 activation in an in vitro migration assay, independent of the involvement of R-Ras (data not shown). That may be a reason why knockout of R-Ras does not completely eliminate the effect of increased invasion by EphB2 in U251 and T98G cells. Taken together, R-Ras seems to be a key molecule in signaling networks that coordinately regulate cell-ECM adhesion, cell proliferation, and invasion downstream of EphB2.
We have recently reported overexpression and elevated phosphorylation of EphB2 receptor in invading glioma cells.13 Here we provide evidence that effects of R-Ras downstream of the EphB2 receptor are consistent with that of invading glioma cells. Because most conventional chemotherapeutic agents function to inhibit cell proliferation, it is possible that invading glioma cells are more chemoresistant due to the fact that EphB2/R-Ras signaling decreases cell proliferation by inhibition of the MEK/MAPK pathway. In addition, our previous data showed that invading glioma cells are resistant to cytotoxic therapy,41 which may be enhanced by EphB2/R-Ras signaling. Thus, the EphB2 receptor seems to trigger signaling networks that regulate invasion of glioma. Future work aimed at studying the complexity of the multicompartment Eph/ephrin signaling network may contribute to a better understanding of tumor progression mechanisms as they relate to the invasion and survival of glioblastoma multiforme.
Acknowledgments
We thank Dr. Anna M. Joy for critical reading of this manuscript; Drs. Hiroshi Sato and Hisashi Miyamori for making expression vectors; Christian E. Beaudry and Dominique B. Hoelzinger for technical assistance; Dr. Spyro Mousses and Don Weaver for designing siRNA for R-Ras; Dr. Jie Wu for assisting in organotypic brain slice culture; and Dr. Tim Demuth, Jessica L. Rennert, and Dr. Satoko Nakada for their valuable discussion.
Footnotes
Address reprint requests to Michael E. Berens, Ph.D., The Translational Genomics Research Institute, 445 North Fifth St., Neurogenomics Division, Phoenix, AZ 85004. E-mail: mberens@tgen.org.
Supported by the National Institutes of Health (grant NS042262 to M.E.B.) and the American Brain Tumor Association (basic research fellowship award to M.N.).
References
- Lemke G. A coherent nomenclature for Eph receptors and their ligands. Mol Cell Neurosci. 1997;9:331–332. doi: 10.1006/mcne.1997.0630. [DOI] [PubMed] [Google Scholar]
- Kullander K, Klein R. Mechanisms and functions of Eph and ephrin signalling. Nat Rev Mol Cell Biol. 2002;3:475–486. doi: 10.1038/nrm856. [DOI] [PubMed] [Google Scholar]
- Wilkinson DG. Multiple roles of EPH receptors and ephrins in neural development. Nat Rev Neurosci. 2001;2:155–164. doi: 10.1038/35058515. [DOI] [PubMed] [Google Scholar]
- Mellitzer G, Xu Q, Wilkinson DG. Control of cell behaviour by signalling through Eph receptors and ephrins. Curr Opin Neurobiol. 2000;10:400–408. doi: 10.1016/s0959-4388(00)00095-7. [DOI] [PubMed] [Google Scholar]
- Dodelet VC, Pasquale EB. Eph receptors and ephrin ligands: embryogenesis to tumorigenesis. Oncogene. 2000;19:5614–5619. doi: 10.1038/sj.onc.1203856. [DOI] [PubMed] [Google Scholar]
- Klein R. Excitatory Eph receptors and adhesive ephrin ligands. Curr Opin Cell Biol. 2001;13:196–203. doi: 10.1016/s0955-0674(00)00197-6. [DOI] [PubMed] [Google Scholar]
- Holland SJ, Gale NW, Mbamalu G, Yancopoulos GD, Henkemeyer M, Pawson T. Bidirectional signalling through the EPH-family receptor Nuk and its transmembrane ligands. Nature. 1996;383:722–725. doi: 10.1038/383722a0. [DOI] [PubMed] [Google Scholar]
- Marston DJ, Dickinson S, Nobes CD. Rac-dependent trans-endocytosis of ephrinBs regulates Eph-ephrin contact repulsion. Nat Cell Biol. 2003;5:879–888. doi: 10.1038/ncb1044. [DOI] [PubMed] [Google Scholar]
- Zimmer M, Palmer A, Kohler J, Klein R. EphB-ephrinB bi-directional endocytosis terminates adhesion allowing contact mediated repulsion. Nat Cell Biol. 2003;5:869–878. doi: 10.1038/ncb1045. [DOI] [PubMed] [Google Scholar]
- Self AJ, Caron E, Paterson HF, Hall A. Analysis of R-Ras signalling pathways. J Cell Sci. 2001;114:1357–1366. doi: 10.1242/jcs.114.7.1357. [DOI] [PubMed] [Google Scholar]
- Lowe DG, Capon DJ, Delwart E, Sakaguchi AY, Naylor SL, Goeddel DV. Structure of the human and murine R-ras genes, novel genes closely related to ras proto-oncogenes. Cell. 1987;48:137–146. doi: 10.1016/0092-8674(87)90364-3. [DOI] [PubMed] [Google Scholar]
- Guha A, Feldkamp MM, Lau N, Boss G, Pawson A. Proliferation of human malignant astrocytomas is dependent on Ras activation. Oncogene. 1997;15:2755–2765. doi: 10.1038/sj.onc.1201455. [DOI] [PubMed] [Google Scholar]
- Nakada M, Niska JA, Miyamori H, McDonough WS, Wu J, Sato H, Berens ME. The phosphorylation of EphB2 receptor regulates migration and invasion of human glioma cells. Cancer Res. 2004;64:3179–3185. doi: 10.1158/0008-5472.can-03-3667. [DOI] [PubMed] [Google Scholar]
- Kiyokawa E, Takai S, Tanaka M, Iwase T, Suzuki M, Xiang YY, Naito Y, Yamada K, Sugimura H, Kino I. Overexpression of ERK, an EPH family receptor protein tyrosine kinase, in various human tumors. Cancer Res. 1994;54:3645–3650. [PubMed] [Google Scholar]
- Tang XX, Brodeur GM, Campling BG, Ikegaki N. Coexpression of transcripts encoding EPHB receptor protein tyrosine kinases and their ephrin-B ligands in human small cell lung carcinoma. Clin Cancer Res. 1999;5:455–460. [PubMed] [Google Scholar]
- Wu Q, Suo Z, Risberg B, Karlsson MG, Villman K, Nesland JM. Expression of Ephb2 and Ephb4 in breast carcinoma. Pathol Oncol Res. 2004;10:26–33. doi: 10.1007/BF02893405. [DOI] [PubMed] [Google Scholar]
- Mao W, Luis E, Ross S, Silva J, Tan C, Crowley C, Chui C, Franz G, Senter P, Koeppen H, Polakis P. EphB2 as a therapeutic antibody drug target for the treatment of colorectal cancer. Cancer Res. 2004;64:781–788. doi: 10.1158/0008-5472.can-03-1047. [DOI] [PubMed] [Google Scholar]
- Tang XX, Evans AE, Zhao H, Cnaan A, Brodeur GM, Ikegaki N. Association among EPHB2, TrkA, and MYCN expression in low-stage neuroblastomas. Med Pediatr Oncol. 2001;36:80–82. doi: 10.1002/1096-911X(20010101)36:1<80::AID-MPO1019>3.0.CO;2-N. [DOI] [PubMed] [Google Scholar]
- Vogt T, Stolz W, Welsh J, Jung B, Kerbel RS, Kobayashi H, Landthaler M, McClelland M. Overexpression of Lerk-5/Eplg5 messenger RNA: a novel marker for increased tumorigenicity and metastatic potential in human malignant melanomas. Clin Cancer Res. 1998;4:791–797. [PubMed] [Google Scholar]
- Giese A, Rief MD, Loo MA, Berens ME. Determinants of human astrocytoma migration. Cancer Res. 1994;54:3897–3904. [PubMed] [Google Scholar]
- Dudley DT, Pang L, Decker SJ, Bridges AJ, Saltiel AR. A synthetic inhibitor of the mitogen-activated protein kinase cascade. Proc Natl Acad Sci USA. 1995;92:7686–7689. doi: 10.1073/pnas.92.17.7686. [DOI] [PMC free article] [PubMed] [Google Scholar]
- Zisch AH, Kalo MS, Chong LD, Pasquale EB. Complex formation between EphB2 and Src requires phosphorylation of tyrosine 611 in the EphB2 juxtamembrane region. Oncogene. 1998;16:2657–2670. doi: 10.1038/sj.onc.1201823. [DOI] [PubMed] [Google Scholar]
- Nakada M, Yamashita J, Okada Y, Sato H. Ets-1 positively regulates expression of urokinase-type plasminogen activator (uPA) and invasiveness of astrocytic tumors. J Neuropathol Exp Neurol. 1999;58:329–334. doi: 10.1097/00005072-199904000-00003. [DOI] [PubMed] [Google Scholar]
- Tran NL, McDonough WS, Donohue PJ, Winkles JA, Berens TJ, Ross KR, Hoelzinger DB, Beaudry C, Coons SW, Berens ME. The human Fn14 receptor gene is up-regulated in migrating glioma cells in vitro and overexpressed in advanced glial tumors. Am J Pathol. 2003;162:1313–1321. doi: 10.1016/S0002-9440(10)63927-2. [DOI] [PMC free article] [PubMed] [Google Scholar]
- Kita D, Takino T, Nakada M, Takahashi T, Yamashita J, Sato H. Expression of dominant-negative form of Ets-1 suppresses fibronectin-stimulated cell adhesion and migration through down-regulation of integrin alpha5 expression in U251 glioma cell line. Cancer Res. 2001;61:7985–7991. [PubMed] [Google Scholar]
- Mariani L, Beaudry C, McDonough WS, Hoelzinger DB, Kaczmarek E, Ponce F, Coons SW, Giese A, Seiler RW, Berens ME. Death-associated protein 3 (Dap-3) is overexpressed in invasive glioblastoma cells in vivo and in glioma cell lines with induced motility phenotype in vitro. Clin Cancer Res. 2001;7:2480–2489. [PubMed] [Google Scholar]
- Cavenee WK, Furnari FB, Nagane M, Huang HJS, Newcomb EW, Bigner DD, Weller M, Berens ME, Plate KH, Israel MA, Noble MD, Kleihues P. Diffusely infiltrating astrocytomas. Tumours of the Nervous System. Kleihues P, Cavenee WK, editors. Lyon: IARC Press; Pathology and Genetics. 2000:pp 10–21. [Google Scholar]
- Mariani L, McDonough WS, Hoelzinger DB, Beaudry C, Kaczmarek E, Coons SW, Giese A, Moghaddam M, Seiler RW, Berens ME. Identification and validation of P311 as a glioblastoma invasion gene using laser capture microdissection. Cancer Res. 2001;61:4190–4196. [PubMed] [Google Scholar]
- Zou JX, Wang B, Kalo MS, Zisch AH, Pasquale EB, Ruoslahti E. An Eph receptor regulates integrin activity through R-Ras. Proc Natl Acad Sci USA. 1999;96:13813–13818. doi: 10.1073/pnas.96.24.13813. [DOI] [PMC free article] [PubMed] [Google Scholar]
- Ruoslahti E. Fibronectin and its integrin receptors in cancer. Adv Cancer Res. 1999;76:1–20. doi: 10.1016/s0065-230x(08)60772-1. [DOI] [PubMed] [Google Scholar]
- Zou JX, Liu Y, Pasquale EB, Ruoslahti E. Activated SRC oncogene phosphorylates R-ras and suppresses integrin activity. J Biol Chem. 2002;277:1824–1827. doi: 10.1074/jbc.M103133200. [DOI] [PubMed] [Google Scholar]
- Zhang Z, Vuori K, Wang H, Reed JC, Ruoslahti E. Integrin activation by R-ras. Cell. 1996;85:61–69. doi: 10.1016/s0092-8674(00)81082-x. [DOI] [PubMed] [Google Scholar]
- Furuhjelm J, Peranen J. The C-terminal end of R-Ras contains a focal adhesion targeting signal. J Cell Sci. 2003;116:3729–3738. doi: 10.1242/jcs.00689. [DOI] [PubMed] [Google Scholar]
- Kwong L, Wozniak MA, Collins AS, Wilson SD, Keely PJ. R-Ras promotes focal adhesion formation through focal adhesion kinase and p130(Cas) by a novel mechanism that differs from integrins. Mol Cell Biol. 2003;23:933–949. doi: 10.1128/MCB.23.3.933-949.2003. [DOI] [PMC free article] [PubMed] [Google Scholar]
- Kapoor GS, O’Rourke DM. Mitogenic signaling cascades in glial tumors. Neurosurgery. 2003;52:1425–1434. doi: 10.1227/01.neu.0000065135.28143.39. [DOI] [PubMed] [Google Scholar]
- Elowe S, Holland SJ, Kulkarni S, Pawson T. Downregulation of the Ras-mitogen-activated protein kinase pathway by the EphB2 receptor tyrosine kinase is required for ephrin-induced neurite retraction. Mol Cell Biol. 2001;21:7429–7441. doi: 10.1128/MCB.21.21.7429-7441.2001. [DOI] [PMC free article] [PubMed] [Google Scholar]
- Rincon-Arano H, Rosales R, Mora N, Rodriguez-Castaneda A, Rosales C. R-Ras promotes tumor growth of cervical epithelial cells. Cancer. 2003;97:575–585. doi: 10.1002/cncr.11093. [DOI] [PubMed] [Google Scholar]
- Marte BM, Rodriguez-Viciana P, Wennstrom S, Warne PH, Downward J. R-Ras can activate the phosphoinositide 3-kinase but not the MAP kinase arm of the Ras effector pathways. Curr Biol. 1997;7:63–70. doi: 10.1016/s0960-9822(06)00028-5. [DOI] [PubMed] [Google Scholar]
- Giese A, Bjerkvig R, Berens ME, Westphal M. Cost of migration: invasion of malignant gliomas and implications for treatment. J Clin Oncol. 2003;21:1624–1636. doi: 10.1200/JCO.2003.05.063. [DOI] [PubMed] [Google Scholar]
- Keely PJ, Rusyn EV, Cox AD, Parise LV. R-Ras signals through specific integrin alpha cytoplasmic domains to promote migration and invasion of breast epithelial cells. J Cell Biol. 1999;145:1077–1088. doi: 10.1083/jcb.145.5.1077. [DOI] [PMC free article] [PubMed] [Google Scholar]
- Joy AM, Beaudry CE, Tran NL, Ponce FA, Holz DR, Demuth T, Berens ME. Migrating glioma cells activate the PI3-K pathway and display decreased susceptibility to apoptosis. J Cell Sci. 2003;116:4409–4417. doi: 10.1242/jcs.00712. [DOI] [PubMed] [Google Scholar]


