Abstract
Background
The associations of body mass index (BMI) and chronic disease may differ between Indo-Asian and Western populations. We used Indo-Asian-specific definitions of overweight and obesity to determine the prevalence of these problems in Pakistan and studied the sensitivity and specificity of BMI cutoff values for an association with hypertension and diabetes mellitus.
Methods
We analyzed data for 8972 people aged 15 years or more from the National Health Survey of Pakistan (1990– 1994). People considered overweight or obese were those with a BMI of 23 kg/m2 or greater, and those considered obese as having a BMI of 27 kg/m2 or greater. We built multivariable models and performed logistic regression analysis.
Results
The prevalence of overweight and obesity, weighted to the general Pakistani population, was 25.0% (95% confidence interval [CI] 21.8%–28.2%). The prevalence of obesity was 10.3% (95% CI 7.0%–13.2%). The factors independently and significantly associated with overweight and obesity included greater age, being female, urban residence, being literate, and having a high (v. low) economic status and a high (v. low) intake of meat. With receiver operating characteristic curves, we found that the use of even lower BMI cutoff values (21.2 and 22.1 kg/m2 for men and 21.2 and 22.9 kg/m2 for women) than those recommended for an Indo-Asian population yielded the optimal areas under the curve for an association with hypertension and diabetes, respectively.
Interpretation
A quarter of the population of Pakistan would be classified as overweight or obese with the use of Indo-Asian-specific BMI cutoff values. Optimal identification of those at risk of hypertension and diabetes and healthy targets may require the use of even lower BMI cutoff values than those already proposed for an Indo-Asian population.
Developing countries are increasingly vulnerable to the worldwide epidemic of obesity, which affects all segments of the population, including men, women and now children.1,2 Compared with populations in industrialized countries, those in the developing world appear to be at greater risk of the diseases associated with overweight, and cardiovascular disease has become the leading cause of disability and death in many developing countries.3–5
Worldwide, Indo-Asian people are among the populations at highest risk for cardiovascular disease.6 Evidence also suggests that associations between body mass index (BMI), percentage of body fat and chronic disease may differ between Indo-Asian and European populations.7,8 One proposed explanation for these observations is the effect of poverty and resultant malnutrition during intrauterine and early childhood years, coupled with relative overnutrition in later years.9 There may, however, be other factors at work. Because of the observed differences between populations, the International Association for the Study of Obesity and the International Obesity Task Force have suggested lower BMI cutoff values for the definitions of overweight (23.0–24.9 kg/m2) and obesity (25.0 kg/m2 or greater) in Asian populations.10,11 Estimates of the prevalence of overweight in Indo-Asian countries (India, Pakistan, Bangladesh and Sri Lanka) based on these cutoff values have not been reported. Further, it is not known whether the revised definition of overweight would be valid at a population level in terms of being better associated with the consequences of obesity.
We therefore sought to determine the prevalence of overweight and obesity using the Asian-specific BMI definition in a Pakistani population. We also studied factors and conditions (hypertension, diabetes mellitus and raised serum cholesterol concentration) associated with being overweight or obese in the Pakistani population, as well as the sensitivity and specificity of various BMI cutoff values for their association with hypertension and diabetes mellitus.
Methods
The analysis was based on cross-sectional data collected in the 1990–1994 National Health Survey of Pakistan, conducted by the Pakistan Medical Research Council, under the technical guidance and support of the US National Center for Health Statistics. The overall design of the survey was a modification of the Third National Health and Nutrition Examination Survey (NHANES III), conducted by the US National Center for Health Statistics, tailored to the needs of Pakistan. The details of sampling, design, components, survey instruments and quality control have previously been reported.12 Ethical approval for the survey was obtained from the Institutional Review Board at the Pakistan Medical Research Council.13
In brief, the survey was conducted on a nationally representative sample of 18 135 people aged 6 months to 110 years from 2400 urban and rural households who gave informed consent. A 2-stage stratified design was used.14 The urban and rural areas of each of the 4 provinces of Pakistan were taken as strata. There were 80 urban or rural primary sampling units; 30 households were drawn into the sample from each unit, and all residents of the household were included in the study. The overall individual response rate was 92.6%.
Data on demographic, socioeconomic and health-related variables were collected with a questionnaire validated in local languages. Dietary data were collected with a food-frequency questionnaire. All women aged 40 years or under were asked whether they were currently pregnant. Physicians at mobile examination centres performed a standardized physical examination that included 2 blood pressure readings obtained at least 20 minutes apart from the right arm by means of a mercury sphygmomanometer with the subject sitting. Trained technicians performed anthropometric examinations. Weight and height were recorded while the subject was in light clothing and without shoes. BMI was calculated as weight (in kilograms) divided by height (in metres) squared. Blood samples were obtained at least 1 hour after the subject arrived at the examination centre; fasting was not required. Blood glucose and serum cholesterol concentrations were determined with the use of the Reflotron, a multiphasic biochemical analyzer.15 Random midstream urine samples were tested with Multistix 10 SG urinalysis strips (Bayer HealthCare, Diagnostics Division, Tarrytown, NY; reagent, tetrabromophenol blue) in subjects aged 5 years or over. Quality-control measures included a field visit by expert consultants, duplicate examination by field supervisors, calibration protocols and retraining exercises.16
The category of overweight and obesity was defined as a BMI of 23 kg/m2 or greater. This definition, based on the revised criteria for Asian populations,11 was lower than the conventional cutoff value of 25 kg/m2 for populations of European origin and reflects the higher ratio of body fat to muscle mass in the former. Obesity was defined as a BMI of 27 kg/m2 or greater.
Ethnicity was reported as “mother tongue,” which is specific for each of the 5 major ethnic subgroups of Pakistan: Muhajir, Punjabi, Baluch, Sindhi and Pashtun. Literacy was defined as whether an individual could read or not. Three levels of economic status were defined by simply counting owned items with use of a list of household electrical items and owned transport vehicles; this measure has been validated.17 High intake of meat, fruit, milk, eggs, rice and potatoes was defined as consumption of these items at least every other day. Use of tobacco (cigarettes, “beddies” [hand-rolled, often filterless cigarettes wrapped in temburni leaf or tendu leaf that are available in a variety of candy-like flavours], and chewing tobacco or snuff) was dichotomized as current use or not. Hypertension was defined as a systolic blood pressure of 140 mm Hg or greater or a diastolic blood pressure of 90 mm Hg or greater (based on the mean of the 2 readings) or current therapy with antihypertensive medication. Diabetes was defined as a nonfasting blood glucose concentration of 140 mg/dL (7.8 mmol/L) or greater or a history of diabetes; this definition, based on old criteria,18 diverges from the recent standard criterion of a fasting blood glucose concentration of more than 126 mg/dL (7.0 mmol/L).19 Proteinuria was defined as a urine protein concentration of 30 mg/dL (0.3 g/L) or greater as measured by a reagent strip (reading of 1+ or greater).20
Prevalence and 95% confidence intervals (CIs) were calculated with weighting that reflected the oversampling of urban areas and the 3 smaller provinces. Multivariable models were built for the primary outcome of overweight. The candidate predictor list included sociodemographic variables (age, sex, urban v. rural dwelling, literacy status, economic status, high intake of meat, fruit, milk, eggs, rice and potatoes, and current cigarette use). Variables associated with the primary outcome with p < 0.1 in the stepwise multiple regression analysis were considered for selection in the multivariable model. For the primary outcome, we performed logistic regression analysis specific for complex survey designs21 that accounted for the clusters (primary sampling units), strata (provinces) and data weighted to the general population of Pakistan in 1990, with weights calculated by the Pakistan Federal Bureau of Statistics and confirmed by the US National Center for Health Statistics for that purpose. The final model included variables that were associated with the outcomes at p < 0.05. The presence of each of hypertension, diabetes and raised serum cholesterol concentration was then entered into the final model to explore the independent association of BMI with these conditions.
The sensitivity and specificity of the BMI for an association with hypertension or diabetes were expressed by receiver operating characteristic (ROC) curves.
Results
Of the 9442 subjects aged 15 years or more, 470 women reported being pregnant and were excluded from the analysis. Thus, our final sample was 8972 subjects.
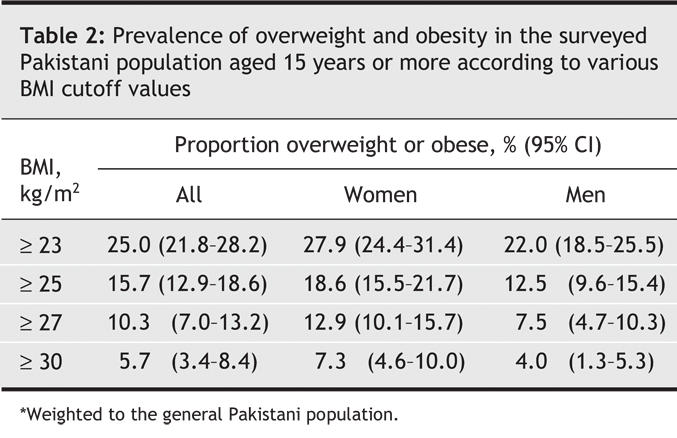
The overall prevalence of overweight and obesity, weighted to the general Pakistani population, was 25.0% (95% CI 21.8–28.2%). The prevalence was highest, 42.8%, among women aged 35–54 years but was also high among those aged 15–24 years, at 12.4% for men and 13.8% for women (Table 1). Table 2 shows the weighted prevalence of overweight and obesity according to various BMI cutoff values. The overall weighted prevalence of obesity according to our study definition was 10.3% (95% CI 7.0%–13.2%).
Table 1
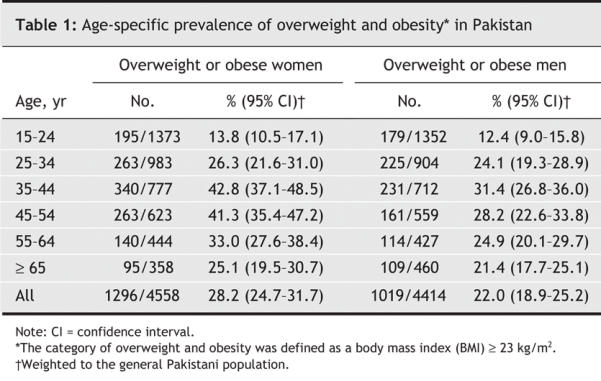
Table 2
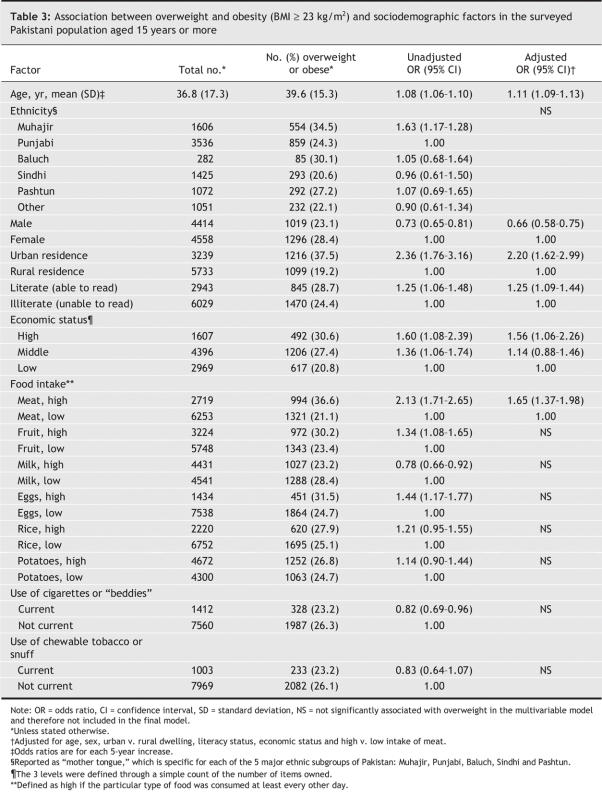
The factors independently and significantly associated with being overweight or obese included greater age, being female, urban residence, being literate, and having a high (v. low) economic status and a high (v. low) intake of meat (Table 3).
Table 3
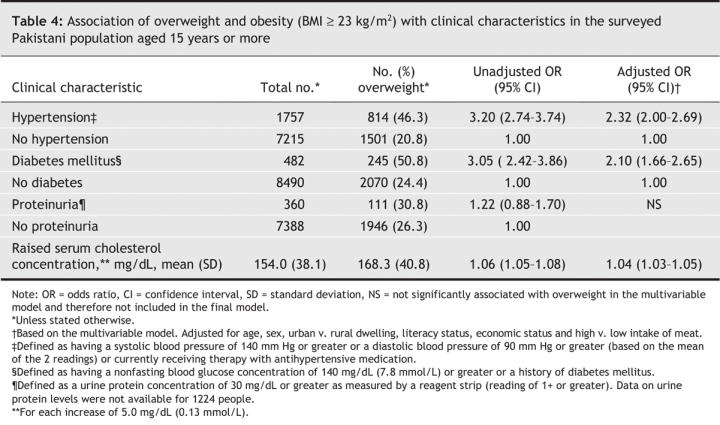
Being overweight or obese was independently associated with having hypertension, diabetes and a raised serum cholesterol concentration (Table 4).
Table 4
The ROC curves (Fig. 1) illustrate the sensitivity and specificity of the BMI for an association with hypertension or diabetes. For hypertension, the optimal cutoff value for the BMI was 21.2 kg/m2 in both men and women, yielding a sensitivity of 61% and 65% and a specificity of 68% and 63%, respectively. A cutoff value of 23 kg/m2 had a sensitivity of 43% and 50% and a specificity of 82% and 76% in men and women, respectively. For diabetes, the optimal cutoff value for the BMI was 22.1 kg/m2 in men and 22.9 kg/m2 in women, yielding a sensitivity of 56% and 59%, respectively, and a specificity of 72% in both sexes. A cutoff value of 23 kg/m2 had a sensitivity of 46% and 59% and a specificity of 78% and 73% in men and women, respectively.
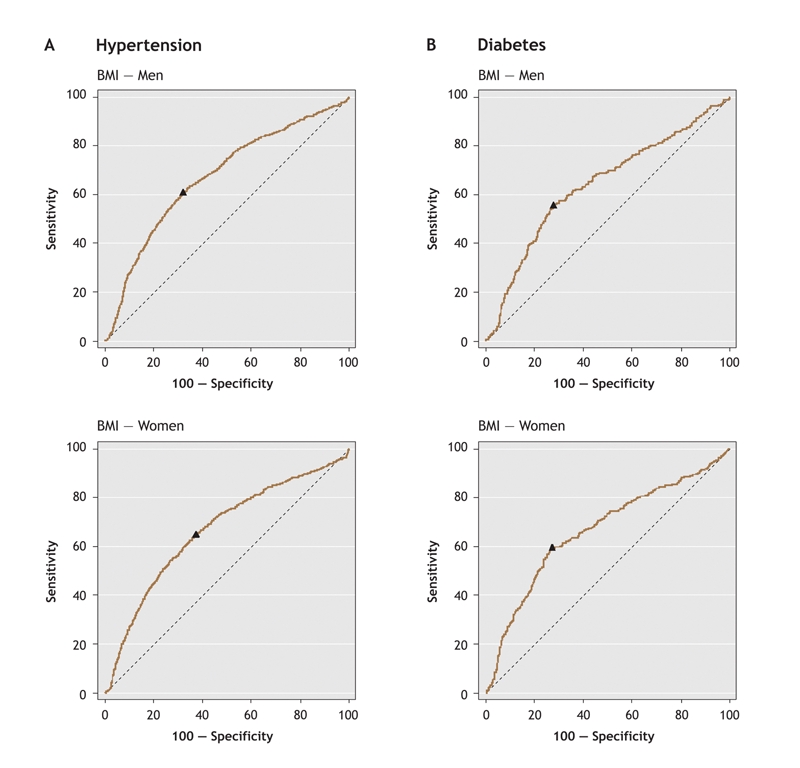
Fig. 1: Receiver operating characteristic (ROC) curves for the sensitivity and specificity of the association between body mass index (BMI) and hypertension (A) and diabetes mellitus (B). For hypertension in men, the area under the curve (AUC) was 0.68 (95% confidence interval [CI] 0.66–0.69) and the optimal BMI cutoff value 21.2 kg/m2 (triangle); this BMI value had a sensitivity of 61% and a specificity of 68%. The sensitivity and specificity were 43% and 82%, respectively, for a BMI cutoff value of 23 kg/m2 and 28% and 90%, respectively, for one of 25 kg/m2. For hypertension in women, the AUC was 0.66 (95% CI 0.65– 0.68) and the optimal BMI cutoff value 21.2 kg/m2 (triangle); this value had a sensitivity of 65% and a specificity of 63%. The sensitivity and specificity were 50% and 76%, respectively, for a BMI cutoff value of 23 kg/m2 and 37% and 85%, respectively, for one of 25 kg/m2. For diabetes in men, the AUC was 0.64 (95% CI 0.63–0.66) and the optimal BMI cutoff value 22.1 kg/m2 (triangle); this value had a sensitivity of 56% and a specificity of 72%. The sensitivity and specificity were 46% and 78%, respectively, for a BMI cutoff value of 23 kg/m2 and 29% and 88%, respectively, for one of 25 kg/m2. For diabetes in women, the AUC was 0.66 (95% CI 0.65–0.68) and the optimal BMI cutoff value 22.9 kg/m2 (triangle); this value had a sensitivity of 59% and a specificity of 72%. The sensitivity and specificity were 59% and 73%, respectively, for a BMI cutoff value of 23 kg/m2 and 42% and 82%, respectively, for one of 25 kg/m2.
Interpretation
This nationally representative survey showed 25.0% of the Pakistani population to be overweight or obese according to the Asian-specific BMI cutoff value of 23 kg/m2 and 10.3% to be obese according to the BMI cutoff value of 27 kg/m2. Our data confirm a major public health problem in Pakistan.
Discussions around the global epidemic of obesity have often used the future tense for the developing world. We have shown that current rates of overweight and obesity are already unacceptably high among youths. This is of considerable concern for a number of reasons. Obesity tends to track within individuals and populations: obese children become obese adults. This tendency, combined with the continued trend toward urbanization, will serve to seriously escalate adult levels of obesity: we observed a 2.5 times greater prevalence of obesity among urban residents than among rural residents. In addition, there are indications that obesity in youth coupled with low birth weight is the worst possible combination for adult cardiovascular disease and diabetes, conditions to which Indo-Asian populations are already particularly susceptible.9
Critics have challenged the revised BMI thresholds for defining overweight in subpopulations on the grounds that these thresholds may not necessarily be associated with adverse clinical outcomes.22,23 However, data for Chinese subjects aged 40 years or over revealed a U-shaped association of BMI with 10-year all-cause mortality rates, with the least risk of death at a BMI of less than 21 kg/m2 among men and less than 22 kg/m2 among women.24 We found an independent association between a BMI of 23 kg/m2 or greater and the presence of hypertension, diabetes or a raised serum cholesterol concentration. Further, the ROC curves showed that even lower cutoff values than the recommended 23 kg/m2 (21.2 and 22.9 kg/m2 in women and 21.2 and 22.1 kg/m2 in men), albeit unadjusted for other factors, yielded the optimal areas under the curve for the associations with hypertension and diabetes, respectively. Using a conventional cutoff value of 25 kg/m2 resulted in poor sensitivity for both associations. Our findings support the use of a lower cutoff value of BMI (23 kg/m2 or even lower) for identification of subjects with hypertension and diabetes in programs screening for these chronic diseases in Indo-Asian populations.
Our analyses had limitations. Clinical diagnosis of hypertension requires persistent elevation of blood pressure on repeated visits. However, the mean of multiple readings on the same day (2 readings in the National Health Survey of Pakistan) is considered acceptable for epidemiologic studies and has been used to diagnose hypertension in other surveys.25,26 In the National Health Survey of Pakistan, blood was drawn without a requirement of fasting. Diabetes was defined as a blood glucose concentration of 140 mg/dL (7.8 mmol/L) or greater or a history of diabetes. This definition diverges from the standard criterion of a fasting blood glucose concentration of more than 126 mg/dL (7.0 mmol/L).19 However, our main findings were unchanged when we performed a sensitivity analysis using the older blood glucose criterion of 200 mg/dL or greater.28 Thus, we believe that these findings are robust. We acknowledge that some dimensions of socioeconomic status may not have been adequately captured, the food-frequency questionnaire was not validated, and information on physical activity was not collected. In addition, our associations between obesity and health conditions were cross-sectional. However, there have been few high-quality cohort studies in the developing world that have assessed associations between obesity and incident disease, and we believe that reverse causality is not a major problem for conditions that are largely asymptomatic. Moreover, the main objective of our analyses was to determine the nationally representative prevalence of being overweight. Although we also identified some sociodemographic factors associated with being overweight, further, in-depth trials are needed to study the impact of strategies aimed at behaviour change that would target these factors as well as those identified previously in an attempt to reduce the prevalence of being overweight or having central obesity in Pakistan.27 The sound epidemiologic design, high response rate and use of the modified Asian-specific definition of being overweight or obese are major strengths of our findings, which are generalizable.
In conclusion, our study showed that 1 in 4 people in Pakistan over the age of 15 years is overweight or obese. We have demonstrated alarming rates of obesity among youths and women, indicating where, in particular, interventions should be targeted. Owing to the better association of hypertension and diabetes with an even lower BMI cutoff value (less than 23 kg/m2), our findings support the use of Asian-specific thresholds for the definition of being overweight in this population. Immediate efforts are needed at a national level to control this problem in Pakistan and possibly the neighbouring developing countries.
@ See related article page 1081
Acknowledgments
We thank members of the Pakistan Medical Research Council and the US Department of Health and Human Services for their assistance in the acquisition of data from the National Health Survey of Pakistan.
Footnotes
Editor's take
• The rising prevalence of obesity in industrialized countries is now well documented. It is generally known that people or societies that move from famine to feast go through a time, often a generation, of overeating.
• The authors, in reviewing population survey data, estimate that Pakistan has a high prevalence of overweight and obesity and find that the trend is similar to that already noted in China and other South Asian countries.
• The concern over rates of overweight and obesity in industrialized countries ought to include the entire globe. In Canada, many people are recent immigrants who came from a context of inadequacy to one of plenty. They likely face the same risk of obesity and all its complications.
This article has been peer reviewed.
Contributors: Tazeen Jafar was the principal author and contributed to the study concept and design and to the analysis and interpretation of data. Nish Chaturvedi contributed to the study concept and the interpretation of data. Gregory Pappas contributed to the acquisition of data. All of the authors revised the article critically for important intellectual content and gave final approval of the version to be published.
This study was supported by a grant from the Fogarty International Center, US National Institutes of Health.
Competing interests: None declared.
Correspondence to: Dr. Tazeen H. Jafar, Director, Clinical Epidemiology Unit, and Head, Section of Nephrology, Medicine and Community Health Sciences, Aga Khan University, PO Box 3500, Stadium Road, Karachi, Pakistan; fax 92-21-4934294; tazeen.jafar@aku.edu
REFERENCES
- 1.Friedrich MJ. Epidemic of obesity expands its spread to developing countries. JAMA 2002;287:1382-6. [PubMed]
- 2.Galal OM, Hulett J. Obesity among schoolchildren in developing countries. Food Nutr Bull 2005;26:S261-6. [DOI] [PubMed]
- 3.Reddy KS, Yusuf S. Emerging epidemic of cardiovascular disease in developing countries. Circulation 1998;97:596-601. [DOI] [PubMed]
- 4.Reddy KS. Cardiovascular disease in non-Western countries. N Engl J Med 2004; 350: 2438-40. [DOI] [PubMed]
- 5.He J, Gu D, Wu X, et al. Major causes of death among men and women in China. N Engl J Med 2005;353:1124-34. [DOI] [PubMed]
- 6.Jafar TH, Jafary FH, Jessani S, et al. Heart disease epidemic in Pakistan: women and men at equal risk. Am Heart J 2005;150:221-6. [DOI] [PubMed]
- 7.Dhurandhar NV, Kulkarni PR. Prevalence of obesity in Bombay. Int J Obes Relat Metab Disord 1992;16:367-75. [PubMed]
- 8.Deurenberg-Yap M, Schmidt G, van Staveren WA, et al. The paradox of low body mass index and high body fat percentage among Chinese, Malays and Indians in Singapore. Int J Obes Relat Metab Disord 2000;24:1011-7. [DOI] [PubMed]
- 9.Bhargava SK, Sachdev HS, Fall CH, et al. Relation of serial changes in childhood body-mass index to impaired glucose tolerance in young adulthood. N Engl J Med 2004;350:865-75. [DOI] [PMC free article] [PubMed]
- 10.Choo V. WHO reassesses appropriate body-mass index for Asian populations. Lancet 2002;360:235. [DOI] [PubMed]
- 11.World Health Organization, Western Pacific Region. The International Association for the Study of Obesity and the International Obesity Task Force. The Asia–Pacific perspective: redefining obesity and its treatment. Sydney, Australia: Health Communications Australia Pty Limited; 2000. Available: www.diabetes.com.au/pdf/obesity_report.pdf (accessed 2006 Aug 23).
- 12.Pakistan Medical Research Council. National Health Survey of Pakistan 1990–1994. Islamabad, Pakistan: Pakistan Medical Research Council;1998:50.
- 13.Qureshi AA, Wajid G, Shaikh IA, et al. Ethical considerations for human investigation in the National Health Survey of Pakistan. Pakistan J Med Res 1992;31:270-4.
- 14.Mallick MD. Sample design for the National Health Survey of Pakistan. Pakistan J Med Res 1992;31(Suppl):289-90.
- 15. Price CP, Koller PU. A multicentre study of the new Reflotron system for the measurement of urea, glucose, triacylglycerols, cholesterol, gamma-glutamyltransferase and haemoglobin. J Clin Chem Clin Biochem 1988;26:233-50. [PubMed]
- 16. Pappas G, Akhtar T, Gergen PJ, et al. Health status of the Pakistani population: a health profile and comparison with the United States. Am J Public Health 2001;91:93-8. [DOI] [PMC free article] [PubMed]
- 17.Durkin MS, Islam S, Hasan ZM, et al. Measures of socioeconomic status for child health research: comparative results from Bangladesh and Pakistan. Soc Sci Med 1994;38:1289-97. [DOI] [PubMed]
- 18.Rolka DB, Narayan KM, Thompson TJ, et al. Performance of recommended screening tests for undiagnosed diabetes and dysglycemia. Diabetes Care 2001; 24:1899-903. [DOI] [PubMed]
- 19.Kuzuya T. Early diagnosis, early treatment and the new diagnostic criteria of diabetes mellitus. Br J Nutr 2000;84(Suppl 2):S177-81. [DOI] [PubMed]
- 20.Jafar TH, Chaturvedi N, Gul A, et al. Ethnic differences and determinants of proteinuria among South Asian subgroups in Pakistan. Kidney Int 2003;64:1437-44. [DOI] [PubMed]
- 21.Hosmer D, Lemeshow S. Applied logistic regression. Hoboken, New Jersey: Wiley-Interscience, John Wiley & Sons; 1980. p. 1–134.
- 22.WHO Expert Consultation. Appropriate body-mass index for Asian populations and its implications for policy and intervention strategies. Lancet 2004;363:157-63. [DOI] [PubMed]
- 23.Oh SW, Shin SA, Yun YH, et al. Cut-off point of BMI and obesity-related comorbidities and mortality in middle-aged Koreans. Obes Res 2004;12:2031-40. [DOI] [PubMed]
- 24.Gu D, He J, Duan X, et al. Body weight and mortality among men and women in China. JAMA 2006;295:776-83. [DOI] [PubMed]
- 25.Hypertension control. Report of a WHO Expert Committee [Technical Report Series, no. 862]. Geneva: WHO; 1996. [PubMed]
- 26.Hajjar I, Kotchen TA. Trends in prevalence, awareness, treatment, and control of hypertension in the United States, 1988–2000. JAMA 2003;290:199-206. [DOI] [PubMed]
- 27.Jafar TH, Levey AS, White FM, et al. Ethnic differences and determinants of diabetes and central obesity among South Asians of Pakistan. Diabet Med 2004; 21: 716-23. [DOI] [PubMed]
- 28.Lebovitz HE. Diagnosis, classification, and pathogenesis of diabetes mellitus. [discussion 40-1]. J Clin Psychiatry 2001;62(Suppl 27):5-9. [PubMed]


