

Abstract
Seasonal climate outlooks provide one tool to help decision-makers allocate resources in anticipation of poor, fair or good seasons. The aim of the ‘Climate Outlooks and Agent-Based Simulation of Adaptation in South Africa’ project has been to investigate whether individuals, who adapt gradually to annual climate variability, are better equipped to respond to longer-term climate variability and change in a sustainable manner. Seasonal climate outlooks provide information on expected annual rainfall and thus can be used to adjust seasonal agricultural strategies to respond to expected climate conditions. A case study of smallholder farmers in a village in Vhembe district, Limpopo Province, South Africa has been used to examine how such climate outlooks might influence agricultural strategies and how this climate information can be improved to be more useful to farmers. Empirical field data has been collected using surveys, participatory approaches and computer-based knowledge elicitation tools to investigate the drivers of decision-making with a focus on the role of climate, market and livelihood needs. This data is used in an agent-based social simulation which incorporates household agents with varying adaptation options which result in differing impacts on crop yields and thus food security, as a result of using or ignoring the seasonal outlook. Key variables are the skill of the forecast, the social communication of the forecast and the range of available household and community-based risk coping strategies. This research provides a novel approach for exploring adaptation within the context of climate change.
Keywords: seasonal forecast, climate, adaptation, agent-based model, simulation, agriculture
1. Introduction
Livelihoods in many regions of the world are under stress from multiple causes, including the short-term fluctuations of climate and climatic hazards and the longer-term prospects of climate change. Livelihoods are exposed to climate across a continuum of time-scales, from memories of the recent past, to assessments of present risks and their medium-term expectations, and beyond to scenarios of possible futures on the longer-time frames of the evolution of the climate system. Present climate risk management and adaptation to climate change are intertwined across all of these time-scales.
Seasonal climate outlooks provide one tool to help decision-makers allocate resources in anticipation of poor, fair or good seasons. To what extent might seasonal forecasts ensure adaptation to longer-term climate change, linking learning at the seasonal scale with the evolution of climate on longer-time-scales? This is the central question of the Climate Outlooks and Agent-Based Simulation of Adaptation in South Africa (CLOUD) project. This paper describes the architecture of the project methodology and the first results of an innovative decision model that explores scenarios of household behaviour in a case study from South Africa.
The approach described here rests on four shifts in thinking about climate change (seebox 1below). The first shift has been in the understanding of climate change and the demand for information on both present and future climates. The ‘first generation’ of climate change studies relied on scenarios of climate change, mostly from general circulation models.1 The current direction of climate science is more oriented toward probabilistic predictions of climate change (albeit contingent on future greenhouse gas emissions). Seasonal climate predictions developed as an intermediate scale between the current climate observations and global climate change. Seasonal forecasts have been operational for two decades (Washington & Downing 1999; Goddard et al. 2001).
Box 1. Shifts in thinking about climate change, vulnerability and adaptation.
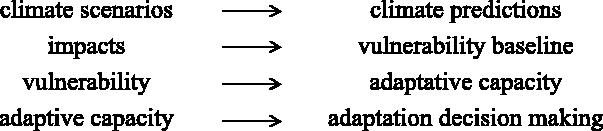
The second shift in thinking has been underway for several decades as well, although it has only become ‘mainstream’ in the past several years as analytical techniques and practical experience have caught up with theoretical orientations. This is the shift from ‘what if’ scenarios of future impacts to understand present exposure to climatic risks in the context of multi-stressor and multi-attribute vulnerabilities.
Once a vulnerability baseline has been established, there is a natural connection to interpret vulnerability as a dynamic process over time. This is the shift from a snapshot of vulnerability (already widely practiced in monitoring systems such as the Global Information and Early Warning System) to understand the adaptive capacity of different populations at risk, economic sectors and regions. This, the third shift in thinking, is demonstrated by the progression from vulnerability to adaptation shown in the Adaptation Policy Framework (Lim et al. 2005) and other similar frameworks (e.g. the guidelines and support material for the National Adaptation Programmes of Action, see UNITAR et al. 2004, www.unitar.org/ccp/NAPA/index.htm).
The fourth shift addresses the need to support strategic and operational decision-making on climate risk management and adaptation. This demand for practical guidance is rapidly gaining prominence in development planning. Key concepts are the need to reduce decision uncertainty, the value of climate information and understanding actual decision processes (e.g. Patt et al. in press).
This progression toward understanding the baseline of vulnerability and dynamics of adaptation, linked to probabilistic climate predictions at a continuum of time-scales, has been termed a vulnerability/adaptation science (Downing 2003).
Section 2 in this paper introduces multi-agent-based simulation (MABS) as one method in the vulnerability/adaptation science toolkit. The case study in Mangondi village, South Africa, linking household interviews and the multi-agent model are described in §3. The conclusions reflect on progress in modelling vulnerability and adaptation decision-making, including suggestions for further research.
A short list of key references is included; this material includes far more extensive reviews of the literature than is attempted in this article (see Stern & Easterling 1999). Readers are also encouraged to look at the briefing notes and training material posted on www.VulnerabilityNet.org, and to become active participants in sharing their work with the Vulnerability Network.2
2. Multi-agent-based simulation in a vulnerability/adaptation science
An agent-based model is a programme of self-contained entities called agents each of which can represent real world objects such as individuals or households. Simulation of social agents is included in the generic term, Multi-Agent-Based Simulation (MABS). The data required for such a model is ideally suited to data-intensive fieldwork. Hence, the representation of place-based understanding of the dynamics of vulnerability and adaptation in MABS is a natural, yet innovative approach. Participatory techniques provide a robust and effective method to formalize and verify qualitative ethnographic data, for use in an agent-based model.
Agent-based modelling illustrates how macro-level behaviour can emerge from various types of rules which inform decisions at the local, individual level. An agent-based model can be used to establish which patterns of strategic behaviour emerge as a result of local responses and whether such emergent phenomena account for a clearer understanding of the original field data.
The adaptive dynamics involved in climate change-related behaviour within agriculture, human–environment interaction and impacts for the individual and the group can be investigated. However, from a social science perspective, we are concerned with how such strategies emerge over time as a part of cultural process and the structural relationship between adaptive knowledge and the cultural context (Fischer 1994). There has been much discussion among experts in the field of social simulation (see ‘Sim-Soc’ discussion list: http://www.jiscmail.ac.uk/lists/simsoc.html), regarding the purpose of agent-based models. That is, whether they should be built as an implementation of theory, as theory-building tools, or whether observation is altogether more important than theory. This research creates a model with a feedback process between observation and theory, where the model is driven by the data collected from the field in a bottom-up process.
It should be acknowledged that many, if not most, complex socio-ecological systems will remain unpredictable even if an understanding of the influences of behaviour within the system is achieved. Social science is less concerned with prediction than with identifying how behaviour evolves and influences other processes. Since, the study of complex systems is an attempt to better understand systems which are difficult to grasp analytically, often the best available way to investigate such systems is through simulation (Gilbert & Troitzsch 1999). Purely deterministic prediction is difficult in matters of human thought and its relation to action; stochastic prediction is likely to remain the norm. This is, in part, because ‘rules’ are not rules of action, but indicators of possible courses of action and are influenced by both the goals of the agent and the reliability of the agent's categorization of the context, which relates to the different rules. MABS can explore social and environmental scenarios that do not exist at present, providing an experimental laboratory on the same level of sophistication as models of the global climate system.
The use of even simple agent-based models can help to illuminate field-based descriptions. The benefits of mapping and modelling a complex adaptive system using this framework lie in the ability to identify characteristics—macro-level patterns—which are important to the functioning of a successful system and its essential underlying components. These micro-level effects can also be easily identified within an agent-based modelling environment, which can then allow the analysis of the interaction of models of adaptation developed from the social sciences domain with environmental models from the physical sciences domain. That is, simulations illustrate how systems of different orders interact with each other and we are often interested in the structure, organization and interaction of these sub-models more than their content (Fischer 1994).
Furthermore, agent-based models allow us to examine the consequent behaviours of individual strategies on a group. They permit the representation of incremental complexity (i.e. where models include more and more factors and their contextual interactions) and facilitate the identification of critical situations that can lead to prediction outside the simulation. That is, the ability to demonstrate that some values for the system under study are salient enough to drive phenomena and not simply be a contributing factor (see also the applications in Fischer 1980; Buchler & Fischer 1986; Fischer 2002).
Nevertheless, a simulation is only a descriptive model and its explanatory power is constrained by the assumptions made, including the researcher's understanding of the field data and the level of implementation of the model. Furthermore, such a model will be a simplification of the system under study and in many cases will not represent any ‘real’ system but will be intended to generate model data for an ‘ideal’ world, against which real data can be compared, noting where it corresponds to, and departs from the ideal world. This can help to establish a sense of important contextual drivers within the domain and new areas for investigation which can be further validated with the model.
3. Seasonal climate outlooks and adaptation to climate change in southern Africa
(a) Case study site: Mangondi, South Africa
Mangondi village is situated within Vhembe district, Limpopo Province, in the northeast region of South Africa. Parts of Vhembe district were the former Venda, which was a homeland of apartheid South Africa, allocated to black families, where the land was often marginal. Limpopo province is known for its livestock farming in the northern drier parts, for Kruger National Park game reserve in the east and for its fruit industry in the central zone, within which the Vhembe district is located. Large-scale commercial fruit farms produce mangoes, bananas, macadamia nuts and avocados. Many of the previously disadvantaged farmers in the area have begun increasing the size of their production to try and enter into national and regional fruit and vegetable markets. The post-apartheid South African government has implemented agricultural policies and procedures to encourage this process. Although there has been an increase in productivity among previously disadvantaged farmers, there are still many constraints and risks.
One key constraint is high climate variability, with numerous droughts and floods having occurred in past decades (e.g. 2000 floods, 2002/2003 drought). Managing this climate variability is paramount, but many other stressors such as land access, political instability, market fluctuations, globalization and the impact of HIV/AIDS have to be managed at the same time. The case study reported below focuses on only one of these stresses (climatic variability, linked to climate change) and one adaptive response (seasonal climate forecasts). Thus, the case study is not a full implementation of a livelihood-multi-stressor model of vulnerability.
A communal farming project was initiated in Mangondi in 1993 with support from ABSA building society and other donors that aimed to support women in the production of vegetables for combating malnutrition among children (Archer 2003). Land was identified and took a few years to prepare and in 1996 it was first cultivated by a group of 59 women and 5 men. In the first year, subsistence crops were planted and in later years vegetables were planted for sale. Through the years, the success of the project has fluctuated. In some years, the farmers have had a functional irrigation scheme, money for inputs and have made profits. In other years, the pump for the irrigation has failed, people have not planted and harvest and marketing has been poor.
The case study is not intended to be representative of subsistence rainfed farming. However, it is relevant to understanding how emerging farmers, those who have access to some resources and support, respond to constraints such as a lack of access to credit and information. The existence of the communal farming project allows us to move beyond the purely subsistence-based exploration of our previous agent modelling (Ziervogel et al. 2005), and to include the effects of economic and cultural drivers on the decision-making of the households, and to explore how this might interact with the availability of seasonal forecast information. Since the pumping system is generally unreliable, we will assume in the following that it cannot be used, and explore the consequences for the system in the absence of irrigation.
Research in Vhembe district on the use of seasonal forecasts and agricultural support among smallholder farmers has been undertaken since 1999. An Agricultural Research Council project has been based in Mangondi village for a number of years. Research with the Mangondi community has involved numerous visits and has involved time with the committee members, community members, local researchers and local organizations. The results from the research have highlighted the constraints associated with using seasonal forecasts (Archer 2003). Although the role of agriculture is declining in Africa as people migrate to urban areas, reduce their involvement in subsistence agriculture as productivity decreases (FAO 2004), agriculture still requires support. Africa needs to increase production relative to the growing population (Clover 2003) and so the focus on adapting to climate variability for market-based farmers is of great importance.
4. Description of the multi-agent model
Based on fieldwork over the past five years, an agent-based model was developed to represent this farming community at an abstract level. The model consists of 50 poor and better-off farmer-agents3 with fields for planting and a market place at which to buy and sell produce (figure 1). The distinction between poor and better-off farmers during fieldwork was made through the use of household surveys spanning three years and the expert judgement of a field researcher. In the model, it is assumed that each agent represents a household of six people. At the case-study site, most of the plots are tended by women who often make decisions regarding household food needs, while men make decisions related to the domain of financial resources (Archer 2003). However, in the current modelling exercise the effect of this decision-making division is not explored—farmer-agents represent household units, and decisions are implemented only at the household level.
Figure 1.

Schematic of the CLOUD agent-based model.
Data from the Hadley Centre model was used to generate a baseline climatology (from the control run, without greenhouse gas forcing) and a scenario of future climate change for the Mangondi region. Precipitation and potential evapotranspiration (PET), calculated in the Hadley Centre model, were used (figure 2). The climate data have a drying trend in rainfall, but with significant variability, and an increase in PET over the 140 years used. PET increases from the present climate norm (as presented in the model) of 520–540 mm in the rainy season (October–December) to over 620 mm in 100 years. Along with the drying trend, this represents a significant climate change. Of course, this is only one scenario (see Stainforth et al. 2005 and www.climateprediction.net for large-ensemble results); however, the intention of the project is to test the utility of climate prediction rather than forecast climate change per se.
Figure 2.

(a) Precipitation and (b) potential evapotranspiration for October–November–December.
A crop–water balance module, based on the FAO Water Requirements Satisfaction Index (WRSI), calculates potential yields with the above rainfall and PET as inputs. The WRSI was calibrated using the yield data obtained during fieldwork (using surveys which included data on historical yields combined with further stakeholder elicitation), so that the use of current climate as model input would give the right level of output from the garden in rainfed conditions. As mentioned above, irrigation was not included in the model since it has often failed at the community garden project in Mangondi village and, therefore, farmers ideally need to undertake strategies which can make them resilient in circumstances where irrigation can be unreliable.
A learning component and agent memory were incorporated in the agent-based model to capture perceptions of the forecast. A market module creates reserves of capital which affects long-term strategies and investment in agriculture. The past history of both climate and farmer-agent behaviour can thus affect their current strategy. The time-scales over which this can have an effect may be several decades (see below). This can help to illustrate which long-term strategies are sustainable in dealing with longer-term climate change, with and without the use of seasonal forecasts. Although we only incorporate a limited range of adaptation behaviour in this model, where this leads to failure of the farm (in the sense that persistently low yields make the returns from the farm unsustainable), we have an indication that the adaptation process will need to be broader than our current representation for the farmer-agent to survive.
Forecast information is issued in September, for October–November–December (though occasionally it only reaches farmers in October/November), but often inputs need to be bought before this. The forecast is updated for January–February–March. However, forecast information only provides total predicted rainfall for the season and the distribution throughout this time period is not given. The national meteorological offices are responsible for disseminating the forecast using the radio and through agricultural advisory bulletins. In Mangondi area, many people are aware of the forecast, because the radio presenter who discusses the forecast is from the Vhembe district.
Farmer-agents have a specified trust in the forecast (Ziervogel 2004) and their use of it affects their cropping decisions. However, market farmers such as those in Mangondi are more likely to use a dry forecast, whereas it has been shown that subsistence farmers are more likely to use a wet forecast and ignore a dry one (Ziervogel 2004). That is, in the Mangondi case, there is symmetry between forecast use and market demand. The output from the model is total household income—best interpreted as a relative index of the sustainability of different responses to climate forecasts.
Three crop choices are included in the Mangondi model (table 1). The possible number of choices observed during fieldwork was reduced to represent salient drivers of cropping choices established during interviews and a participatory knowledge elicitation process. This process (figure 3) used computer-aided knowledge elicitation tools (Bharwani 2004) to help to inform the variables which were included in the agent-based model. An interactive questionnaire was used to identify the dominant variables/principles which governed the farmers' decision-making processes and to generate protocols, using a limited number of variables to simplify the domain. McGraw & Harbison-Briggs (1989) refer to this method as a type of constrained information processing task in which the expert's access to knowledge is restricted in order to determine what specific information is needed for their decision-making.
Table 1.
Planting dates and crop coefficients of water demand.
| crop | planting month | relative water demand | ||
|---|---|---|---|---|
| month 1 | month 2 | month 3 | ||
| maize | September/October/January | 0.5328 | 1.027 | 0.900 |
| butternut | September | 0.550 | 0.750 | 0.900 |
| cabbage | January/February | 0.712 | 1.003 | 1.035 |
Figure 3.

Stages within the knowledge elicitation process.
The salient domains in the decision-making process, which had been identified during interviews, were the economic, climatic and strategic domains, and one which described access to irrigation. A domain is a range of possible enquiry space within which different variables used in the decision-making process can exist. The strategic domain contained expertise on adaptive options which was derived from discussions with the farmers.
That is, information about the conditions under which crops were grown, including the necessary input and climate requirements was captured using scenarios which randomly presented drivers which appeared to be salient in the decision-making process. Initially, farmers were asked which crops and how much they would plant if irrigation was reliable and if it was unreliable, for both the winter and summer seasons. Second, they were asked what they would do in these conditions if they received a forecast of below-normal, normal and above-normal rainfall for each season. And lastly, to increase the complexity of the decision-making process, varying market demand for different crops was added to establish whether there would be a difference in strategy if market demand were to change, given the resource constraints of each scenario.
The crop categories that were included in the interactive questionnaire were tomatoes, butternut, cabbage, maize, Chinese lettuce, spinach, groundnut, cowpeas and beetroot which were many of the crop options considered by farmers. The domains of irrigation, forecast and market were chosen for representation due to their importance in the farmers' decision-making. Adaptive choices were made by the farmers based on the constraints represented by each scenario. These data were translated into protocols using a machine-learning algorithm to produce decision trees of the possible rules and heuristics that exist within the domain. This helped to identify decision pathways that could then be analysed further during interviews and included in the agent-based model.
In the model, poor farmer-agents always grow maize, which is mainly a subsistence crop, though any excess which is surplus to household consumption requirements is sold. Butternut is culturally a seasonal Christmas crop in this region and is grown by all farmer-agents because there is a perceived market demand for it in December. Cabbage is also a marketable crop and is grown by poorer farmer-agents if crop prices are anticipated to be good as a result of a lack of rain. A whole field of butternut is always grown by better-off farmer-agents in September, regardless of market demand, since empirical evidence indicates that many better-off farmers have access to transport and, therefore, feel confident in being able to sell their crops further away than local markets if necessary. In contrast, poorer farmer-agents employ more sophisticated cropping patterns, in that they will vary the ratio of the market crop to the subsistence crop in response to forecast information. Other strategies poorer farmer-agents employ include delaying planting, increasing the area of the default market crop, butternut and experimenting with new market crops, such as cabbage.
Adaptive farmer-agents, whether poor or better-off, grow crops for marketing, if climatic conditions are favourable or if they trust the seasonal forecast. If they do not have enough food for subsistence requirements, but they have a surplus of cash, they buy food. If they have an excess of produce, they sell their crops. Maize is only grown by poorer farmer-agents to meet subsistence requirements, and put into storage, as they may often not have enough cash to buy food while better-off farmer-agents always buy the staple crop, maize.
If the forecast is not adequate to plant maize in September, i.e. below-normal rainfall is forecast, maize is planted in October instead. If poor farmer-agents have enough capital in September they plant both maize and butternut in equal proportions to spread their risk, since there is a perceived guaranteed market demand for this seasonal Christmas crop. Better-off farmer-agents plant 100% butternut if they have enough capital. If the seasonal forecast is for below-normal rainfall, poorer farmer-agents, who trust the forecast, plant a greater proportion of butternut (75%) compared to maize (25%) since it is assumed there is a higher market demand for butternut and they can create a greater income from this than from selling excess maize. Similarly, poor farmer-agents experiment with a small percentage of the marketable crop, cabbage in January, if the forecast is below normal, since they expect high market demand and thus higher prices. If they have enough capital, they even delay their planting and plant a whole field of cabbage in February, since they can make a larger financial return from this than from selling their excess maize. A summary of these heuristics is illustrated in table 2.
Table 2.
Rules for household decision-making.
| BN forecast | N forecast | AN forecast | no forecast | |||||||||
|---|---|---|---|---|---|---|---|---|---|---|---|---|
| M% | B% | C% | M% | B% | C% | M% | B% | C% | M% | B% | C% | |
| poor farmer | ||||||||||||
| September | ||||||||||||
| cash<R435 | 25 | — | — | 25 | — | — | 25 | — | — | 25 | — | — |
| R435<cash<R525 | 100 | — | — | 100 | — | — | 100 | — | — | 100 | — | — |
| R525<cash<R570 | 50 | 50 | — | 50 | 50 | — | 50 | 50 | — | 50 | 50 | — |
| cash>R570 | 25 | 75 | — | — | — | — | — | — | — | — | — | — |
| October | ||||||||||||
| cash<R435 | 100 | — | — | — | — | — | — | — | — | — | — | — |
| January | ||||||||||||
| cash<R435 | 25 | — | — | |||||||||
| R435<cash<R450 | 100 | — | — | 100 | — | — | 100 | — | — | 100 | — | — |
| R450<cash<R495 | 75 | — | 25 | — | — | — | — | — | — | — | — | — |
| February | ||||||||||||
| cash>R495 | — | — | 100 | — | — | — | — | — | — | — | — | — |
| better-off farmer | ||||||||||||
| September | ||||||||||||
| cash>R750 | — | 100 | — | — | 100 | — | — | 100 | — | — | 100 | — |
| January | ||||||||||||
| cash>R630 | — | — | 100 | |||||||||
BN, below-normal forecast; N, normal forecast; AN, above-normal forecast. Left column is amount of cash available in Rand. M, maize; B, Butternut; C, cabbage.
The basis for the distinction in cropping strategies between poor and better-off farmer-agents was established during fieldwork. It appeared that poor farmers respond to climate signals more than better-off farmers who respond to market signals since they have access to transport to sell their crops. However, the consequences of this are that better-off farmer-agents make relatively large losses in potential income in a bad year, with high costs, since they plant large amounts of high-input crops with a lower than expected return. That is, better-off farmer-agents employ few, but high-input strategies while poorer farmer-agents employ many more low-input strategies, which buffer them from uncertain events. Since better-off farmer-agents have no such buffers they are more cautious in taking such risks and would only plant a whole plot of cabbage, e.g. if forecast information supported this. If it did not, they would not plant at all because they can sustain such losses in potential income and make investments elsewhere if possible.
The market module has been designed such that there are differing dynamics for poor and better-off households. For example, the income that can be achieved by each farmer is influenced by their wealth profile since fieldwork revealed that poorer farmers only sell from the garden, thus achieving lower prices, while better-off farmer-agents usually have some form of access to transport and can take their crops to market where they sell for higher prices (table 3). The assumption that better-off farmer-agents have access to transport and thus sell at higher prices is included in the model. Sale prices of the various crops were determined by observation during fieldwork and expert judgement from a field researcher (table 3).
Table 3.
Differential sale price of crops depending on wealth profile.
| crop | farmer type | market | selling price, Rand per kg |
|---|---|---|---|
| maize | poor | garden/roadside | 1.75 |
| better-off | local/regional | 2.50 | |
| butternut | poor | garden/roadside | 0.87 |
| better-off | local/regional | 1.74 | |
| cabbage | poor | garden/roadside | 2.00 |
| better-off | local/regional | 2.33 |
Butternut is a more expensive crop to invest in than cabbage, although it has a perceived guaranteed market demand. However, cabbage is less expensive and more profitable though it is perceived as more risky due to the variable market demand (table 4). However, this can be anticipated using seasonal forecasts—the impact on farmer-agents ability to experiment with a cabbage crop was analysed. The cost of investment in each crop was determined by household responses from two rounds of interviews and expert judgement from a field researcher.
Table 4.
Cost of investment in different crops.
| price, Rand per line | % of the plot planted | ||||
|---|---|---|---|---|---|
| 100% | 75% | 50% | 25% | ||
| maize | 4 | 120 | 90 | 60 | 30 |
| cabbage | 6 | 180 | 135 | 90 | 45 |
| butternut | 10 | 300 | 225 | 150 | 75 |
The subtle difference in the case of the selling opportunities of poor farmer-agents is that they can also sell any excess subsistence maize that is not put into storage (table 5). Although they sell at low prices from the garden, they also buy maize at low prices from other poor farmers if they do not have enough in storage to meet their consumption requirements. However, better-off farmer-agents can only buy maize at higher prices from the market.4 Better-off farmer-agents also sell all the crops they grow (i.e. butternut and cabbage) at market getting higher prices.
Table 5.
Excess crop available to poor farmers to sell for income.
| crop | WRSI | yield, kg | excess allowing one season's reserve in storage, kg | income from excess, Rand | income from excess from two harvests, Rand |
|---|---|---|---|---|---|
| maize | 3 | 216 | 36 | 63 | 126 |
| 4 | 285 | 105 | 184 | 368 | |
| 5 | 357 | 177 | 310 | 620 | |
| 6 | 423 | 243 | 425 | 851 |
WRSI, Water Requirements Satisfaction Index, converted to classes of increased water availability.
The market module is coupled to climate, in that prices are boosted by climate events. If the forecast is below normal, market demand is expected to be high and crops can become high-value commodities due to increase demand, therefore commanding higher prices. Prices are boosted by 20% when a below-normal forecast is predicted. By default, farmer-agents initially do not use forecasts and in the time it takes them to trust and begin using forecasts they lose out on high crop prices when rainfall is below normal and the forecast is correct.
Table 6 indicates the yield that can be harvested given varying levels of water availability for each crop, calculated using the crop–water balance module. The resulting potential income that can be achieved by each class of farmer as a result of their differential access to the higher sale prices available at the urban market is shown in table 7.
Table 6.
Yield based on Water Requirements Satisfaction Index (WRSI) and 100% plot planted.
| yield (kg per plot) based on WRSI | ||||||
|---|---|---|---|---|---|---|
| WRSI class | 1 | 2 | 3 | 4 | 5 | 6 |
| maize, kg | 84 | 150 | 216 | 285 | 357 | 423 |
| butternut, kg | 1050 | 1560 | 2070 | 2550 | 3120 | 3600 |
| cabbage, kg | 330 | 1350 | 2250 | 3300 | 4200 | 5100 |
Table 7.
Income based on yield of 100% plot planted.
| crop | wealth class | price | WRSI yield classes | |||||
|---|---|---|---|---|---|---|---|---|
| 1 | 2 | 3 | 4 | 5 | 6 | |||
| maize | poor | R1.75 | 147 | 263 | 378 | 499 | 625 | 740 |
| better-off | R2.50 | 210 | 375 | 540 | 713 | 893 | 1058 | |
| butternut | poor | R0.87 | 914 | 1357 | 1801 | 2217 | 2714 | 3132 |
| better-off | R1.74 | 1827 | 2714 | 3602 | 4437 | 5429 | 6264 | |
| cabbage | poor | R2.00 | 660 | 2700 | 4500 | 6600 | 8400 | 10 200 |
| better-off | R2.33 | 769 | 3146 | 5243 | 7689 | 9786 | 11 883 | |
The output from the model is a relative sense of how successful farmer-agents might be in using seasonal climate forecasts in their agricultural decision-making. The model does not attempt to produce a full analysis of household economics nor represent the wide array of strategies and measures that might be employed to mitigate climatic risks.5Thus, when model results suggest that poor farmer-agents receive no income in the future, the conclusion is that they will need to depend on other crops and non-farm income in order to meet their basic needs.
(a) Simulation results
This section illustrates some of the results of the model in an attempt to understand possible processes which reduce the vulnerability of households to long-term climate change, as experienced one season at a time. Figure 4 shows the impact on cumulative mean household income when the seasonal forecast is not being used. Cabbage—a market crop—is never chosen by either poor or better-off farmer-agents and, therefore, income gradually declines because the cost of growing the other main market crop, butternut, is too high and maize needs to be bought for consumption.
Figure 4.
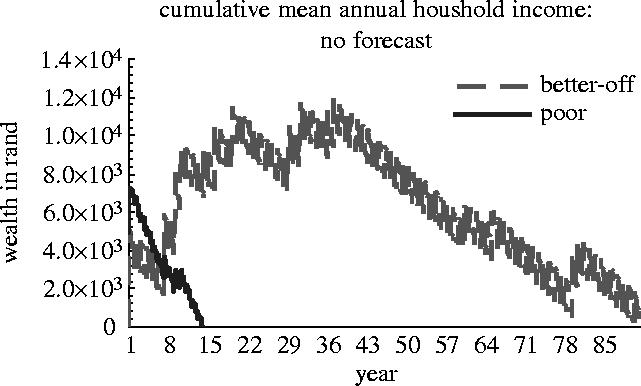
Household income without the use of the seasonal climate forecasts.
Figure 5 shows the increase in household income when the forecast is used. However, the forecast is of no benefit to poor farmer-agents when it is only correct 65% of the time as it is not accurate enough to influence their cropping choices. That is, there is not enough trust in the forecast to increase the area of the market crop butternut, which would provide a larger income than the sale of excess maize. The forecast becomes beneficial to poorer households when its accuracy is increased to 85%, and their cropping strategies become substantially more resilient in the long-term, as they are using the forecast to implement more sophisticated cropping patterns, which ultimately improve their food security. Still, household income, in the model, declines mid-way through the simulation in the face of increasingly adverse climate conditions.
Figure 5.

Use of seasonal forecasts, when accuracy is (a) 65% and (b) 85%.
The corresponding trust of farmer-agents in the forecast (they compare the forecast with the actual weather and adjust their trust accordingly) depends on their experiences of its past accuracy as shown in figure 6. The changes in trust affect the use of the forecast, which is only used when it has been correct three years in a row (Ziervogel 2004). Subsequently, the use of the forecast combined with available capital, influences cropping decisions and specifically the timing and ratio of which crops to plant.
Figure 6.
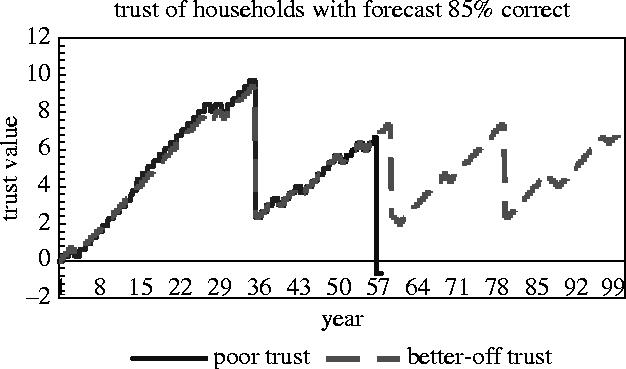
Change in trust with accuracy of the forecast of 85%.
In initial years when farmer-agents do not trust the forecast, they lose out on high prices when the weather is below normal and the forecast is correct. Some agricultural responses to climate variability have significant opportunity costs as they miss out on increased production in more favourable seasons. However, there is a guaranteed market for butternut and, therefore, they do not use the forecast to influence the decision to grow it, although poor farmers use it to increase the proportion that is grown. This allows them to accumulate enough capital to survive longer and eventually grow cabbage when the forecast starts being used. For example, the variation over time of the crops that are chosen is shown in figure 7.
Figure 7.

Model yields for (a) maize, (b) butternut and (c) cabbage —e.g. yield class=3 for butternut refers to a yield of 2070 kg according to table 6.
In a situation where poor farmer-agents possess neither maize in storage nor the capacity to buy maize, it is assumed that they are given enough seed to plant 25% of their plot. Such support from social networks was observed during fieldwork. This would cover some of their consumption requirements for one month where yield is equal to or greater than 285 kg (WRSI>4) (see table 6). Better-off farmer-agents do not have access to this type of social safety mechanism, but they are never confronted with such a situation in the model. The advantage for poor farmer-agents is that the safety mechanism allows them to invest more of their money into planting a butternut crop since this has a guaranteed market at Christmas. Over time, if they begin to trust the forecast enough, this combination of strategies and the social support eventually allows them to experiment with cabbage, a marketable crop which is less expensive to produce than butternut and more profitable. In the past, the irrigation supply has been unreliable and, therefore, poor farmer-agents, in particular, view forecast information as an additional strategic tool to buffer the uncertainties they face.
Since poor farmer-agents plant two sets of maize crops (table 1) they may be able to sell their excess crop after both harvests. If it is a bad year for butternut and/or cabbage this may be of some benefit compared to the effects on better-off farmer-agents who only suffer the relative losses from these market crops and the associated cost of planting large quantities of them, since they plant whole fields of crops at a time rather than spreading their risks as poor farmer-agents do.
It is possible that poor farmer-agents maintain a crucial income from the maize that is being grown twice a year. However, below a yield of 216 kg there is no excess maize to sell (table 5), and therefore capital declines since the yield of butternut is usually 1050 kg (table 6) which provides an income of only R456.75 per season (table 7), since poor farmer-agents usually plant 50% of their plot. Therefore, the income provided by the excess maize is critical since this creates some balance between liquid capital for investment into more profitable market crops and the necessary subsistence in storage. Additionally, the point at which the maize harvest is not large enough to be put into storage, means that there is no excess for sale and the staple may have to be bought every month to meet consumption requirements, and therefore capital declines rapidly. This has the knock-on effect that there is no longer enough capital for poor farmer-agents to invest in butternut. Therefore, the ability to sell excess maize in good years provides a way to reduce vulnerability to inter-annual variability in rainfall. The model indicates that an extra crop of maize planted in January is necessary to achieve this. One maize crop alone does not provide enough income to reinvest into other marketable crops such as butternut and to provide subsistence. However, this balance between subsistence and market crops is difficult to maintain since butternut is an expensive crop to invest in. Consistent poor years of butternut yields with one bad year of maize lead to vulnerability which is irreversible in the standard model.
While both sets of farmer-agents can make an income from the good butternut harvest to begin with, the poor farmer-agents make less because they only plant 50% of their plot, by default, spreading their risk when the forecast is not being used. They also sell their crop at half the price from the garden at R0.87 compared to R1.74 for better-off farmer-agents who can take their produce to urban markets where they get higher prices. Butternut is more expensive to produce and in most cases more money can be made from cabbage, but this is perceived as more risky due to variable market demand.
Poor farmer-agents will experiment with cabbage, only planting 25% when they trust the forecast enough and rainfall is predicted to be below normal, since they are aware of market dynamics and expect high market demand and high prices. However, under these conditions, if they have enough capital, they try and plant a whole plot of cabbage in February and forego their maize crop in January as more money can potentially be made from this strategy. When cabbage is also included in cropping choices, income from a good butternut harvest and cabbage increases capital significantly.
Additionally, households planting cabbage are able to increase their ratio of butternut to maize planted, more than those only planting maize. Cabbage is approximately twice as profitable than butternut if there is a good yield—i.e. 1350 kg for a whole plot or 338 kg when a quarter plot is experimented with and it is also cheaper to produce. Therefore, cabbage allows for the capital to reinvest in butternut which has a ‘guaranteed’ market, especially for poor farmer-agents who cannot always create enough income from low maize or butternut yields to consistently grow it year after year. However, growing cabbage requires sufficient trust in the forecast for it to become usable since neither poor nor better-off farmer-agents will grow it without this additional climate information to support their choice.
In the Mangondi case, farmer-agents benefit from choosing crops which are suited to climate change conditions such as butternut and maize which both do well under the changing climate. Butternut is a good crop to deal with below-normal rainfall conditions since it is a crop for which there is market demand. Observations from fieldwork were that farmer-agents were often forced to choose drought-resistant crops above market crops due to a lack of access to irrigation. That is, crops are needed which are both drought resistant and have high market demand, whether it is because of the cultural calendar as with butternut in the Mangondi case, or due to traditional use/consumption requirements, as in the case of maize.
The results of the agent-based model illustrate the impacts of such short-term adaptation strategies which contribute to long-term resilience under certain climate change conditions or conditions of climate variability. The short-term responses described in the previous sections, which are based on observations from fieldwork, have impacts which promote sustainability from seasonal to annual and decadal time-scales, as accumulated capital allows more innovative strategies to be pursued.
Fieldwork has shown that past experience of the weather can have an influence on the perception of forecast information and thus this could bias the interpretation of forecast information. Preliminary model runs suggest that adding recent memory into the farmer-agent decision-making substantially decreases the perceived accuracy of the forecast and its use. As a result, mean household income is reduced. For poor farmer-agents, the impact is so dramatic that they may as well not be using the forecast. Instead, they adopt a more conservative approach to new information and, therefore, they are not able to build trust in the forecast in the short-term.
5. Conclusions
Clearly, the limitations and assumptions of the model must be considered when deriving specific conclusions from the results. For instance, the model suggests that income for poor farmer-agents will suffer adversely with climate change, even with some use of seasonal climate forecasts. Of course, this does not mean that real farmers will not have other options and built-in contingencies in place—new agricultural technologies, non-farm income, social networks, insurance and risk-spreading mechanisms, and even migration, e.g. to better agricultural lands or for employment in urban areas. Similarly, we do not consider dynamical effects on the market value of goods—these are likely to be controlled by larger-scale processes than considered here and would likely require a study involving at least several villages or towns in a region. Our results are thus relevant to the case of a stable market—the results for marginal classes of farmer are likely to be made worse by market fluctuations, but clearly this is an area for further investigation. Finally, we investigate only a single climate scenario—one with a strong drying trend and decreasing rainfall, and thus most likely to be problematic for agricultural communities reliant on rainfall to provide the majority of their income. The sensitivity of the results to the existence of, or to, the rate of such a trend could be an important factor, particularly with regard to the utility of the seasonal forecast.
The innovative methodological approach used in this research highlights the effect of climate on small-scale agriculture in South Africa. Many of the lessons learned are generic and supported from a wide range of methods. However, the combination of intensive field surveys (and long-term community engagement) with formal modelling allows the analyst to experiment with scenarios that do not exist at present (long-term climate change being the most obvious one).
In the context of this hybrid methodology and exploratory modelling, some of the key lessons learned are recorded in table 8. Rainfall variability is an important stressor for households in this region. However, the baseline vulnerability and exposure to risk is multi-dimensional. There is a fine balance between climate and economic variability, against a background of social networks, poverty and access to environmental resources.
Table 8.
Summary of key messages.
| rainfall variability is a critical factor contributing to household vulnerability | even if average rains enabled a household to feed itself from its own production, a succession of a few dry years may place subsistence farmers in difficulty, even after a previous run of wet years |
| risk is multi-dimensional | changes in planting density offer the prospect of higher yields in good years but expose farmers to greater risks (higher input costs, variable market prices). Poor farmers grow maize for subsistence and sell any excess while better-off farmers grow market crops and buy maize to feed their household |
| time-scale for adoption of forecasts may be very long | building up trust in the forecasts depends on the accuracy and pay-offs of different strategies. Changes in farming practice take years to become established in the community |
| coupling of forecasts with the ability to sell excess in good years overcomes inter-annual variability in rainfall | wealthier households benefit more than poor, related to their access to regional markets |
| farmers that sell crops for market are more likely to use forecasts of dry seasons than forecasts of wet seasons | to benefit from higher prices in a dry year, more than one maize crop is necessary to achieve surplus among poor farmers. In contrast, in Lesotho, subsistence farmers were more likely to use wet forecasts than dry forecasts to take advantage of market opportunities |
Seasonal climate forecasts are one tool in managing climatic and economic risks, and even more so to take advantage of opportunities. Market strategies link to climatic risks and opportunities, with different linked strategies appropriate for different types of farmers. A simple overlay of climatic risks (such as drought-prone areas) with economic systems (perhaps indicators based on household income and dependence on non-farm sources) is unlikely to capture the complexity of real household strategies.
The context of vulnerability and adaptation is important. The situation in Lesotho is not the same as South Africa, although both are regions of climatic stresses. A fishing livelihood system is unlikely to pursue the same strategies as an irrigated agricultural economy. While such place determinism is clear, a generic methodological approach may be possible.
Numerous examples from rural Africa suggest that environmental shocks have a greater impact and prompt change or collapse rather than the slower stresses, such as resource degradation (Goldman 1995). A key lesson in the climate change field is that climatic variability is superimposed on slow changes in mean conditions. But agents adapt to both. Increases in extremes and the range of variability might push vulnerable groups beyond their ability to adapt. Even forecasts with high accuracy may not be sufficient for poor farmers. Further development of an actor-oriented methodology, using MABS, could incorporate additional extreme events such as droughts and floods, and a wider range of non-climatic stressors, to understand the limits of adaptation.
Acknowledgments
The authors are grateful for funding from the Tyndall Centre, and additional support from the School of Geography and the Environment, University of Oxford and Stockholm Environment Institute. The comments of anonymous reviewers have been helpful, particularly in clarifying the relevance of the model results to adaptation processes.
Endnotes
This is a common observation (see www.AIACCProject.org for an introduction in the context of recent research in developing countries). However, we suggest that the earlier tradition in climate impact assessment (Kates et al. 1985) should be considered as the benchmark.
A reference bibliography (in Endnote format) on the web site includes some 3000 references (and will be updated periodically). The bibliography includes the references compiled by Gina Ziervogel in her dissertation on the use of seasonal climate forecasts; as such it is particularly relevant background material for this article (see Murphy et al. 2001; Ziervogel & Calder 2003; Ziervogel 2004; Ziervogel & Downing 2004).
The term farmer-agent is used to describe behaviour in the model while results specifically based on the fieldwork is attributed to farmers. This convention helps to distinguish between the generalizations achieved in a formal model and the specificity of actual behaviour in Mangondi village.
Though this is an assumption which may not necessarily hold true in reality, it does not affect the conclusions which are derived from the results of the model.
For an introduction to livelihood security issues, which are clearly relevant background to this paper, see www.livelihoods.org
One contribution of 17 to a Discussion Meeting Issue ‘Food crops in a changing climate’.
References
- Archer E.R.M. Identifying underserved end-user groups in the provision of climate information. Bull. Am. Meteorol. Soc. 2003;84:1525–1532. doi:10.1175/BAMS-84-11-1525 [Google Scholar]
- Bharwani, S. 2004 Adaptive knowledge dynamics and emergent artificial societies: ethnographically based multi-agent simulations of behavioural adaptation in agro-climatic systems. Ph.D. thesis, University of Kent.
- Buchler I, Fischer M.D. Ecological structure, economics, and social organization: the Kapauku. In: De Meur G, editor. Advances in mathematical anthropology. Routledge & Kegan Paul; London: 1986. pp. 57–124. [Google Scholar]
- Clover, J. 2003 Food security in Sub-Saharan Africa. Institute for Security studies working paper.
- Downing T.E. Toward a vulnerability/adaptation science: lessons from famine early warning and food security for understanding adaptation to climate change. In: Smith J, Klein R, Huq S, editors. Climate change, adaptive capacity and development. Imperial College Press; London: 2003. pp. 77–100. [Google Scholar]
- FAO 2004 The state of food insecurity in the world, FAO, Rome.
- Fischer, M. D. 1980 A general simulation of production and consumption in the valley of Oaxaca, Mexico. Masters thesis, University of Texas, Austin.
- Fischer M.D. Routledge; London: 1994. Applications in computing for social anthropologists. ASA research methods series. [Google Scholar]
- Fischer M. Integrating anthropological approaches to the study of culture: the ‘hard’ and the ‘soft’. In: Trappl R, editor. Cybernetics and Systems, Vol 1. Proc. Sixteenth European Meeting on Cybernetics and Systems Research. Austrian Society for Cybernetic Studies; Vienna: 2002. pp. 367–372. [Google Scholar]
- Gilbert N, Troitzsch K.G. Open University Press; London: 1999. Simulation for the social scientist. [Google Scholar]
- Goddard L, Mason S.J, Zebiak S.E, Ropelewski C.F, Basher R, Cane M.A. Current approaches to seasonal to interannual climate predictions. Int. J. Climatol. 2001;21:1111–1152. doi:10.1002/joc.636 [Google Scholar]
- Goldman A. Threats to sustainability in African agriculture: searching for appropriate paradigms. Hum. Ecol. 1995;23:291–334. doi:10.1007/BF01190135 [Google Scholar]
- Kates R.W, Ausubel J.H, Berberian M, editors. Climate impact assessment (SCOPE 27) Wiley; Chichester, UK: 1985. [Google Scholar]
- Lim B, Spanger-Siegrfried E, Burton I, Malone E, Huq S, editors. Adaptation policy frameworks for climate change: developing strategies, policies and measures. Cambridge University Press; Cambridge, UK: 2005. [Google Scholar]
- McGraw K.L, Harbison-Briggs K. Prentice-Hall International Editions; 1989. Knowledge acquisition: principles and guidelines. [Google Scholar]
- Murphy S.J, Washington R, Downing T.E, Martin R.V, Ziervogel G, Preston A, Todd M, Butterfield R, Briden J. Seasonal forecasting for climate hazards: prospects and responses. Nat. Hazards. 2001;23:171–196. doi:10.1023/A:1011160904414 [Google Scholar]
- Patt A, Klein R.J.T, de la Vega-Leinert A. Taking the uncertainties in climate change vulnerability assessment seriously. Geosciences. 2005;337:411–424. [Google Scholar]
- Stainforth D.A, et al. Uncertainty in predictions of the climate response to rising levels of greenhouse gases. Nature. 2005;433:403–406. doi: 10.1038/nature03301. doi:10.1038/nature03301 [DOI] [PubMed] [Google Scholar]
- Stern P.C, Easterling W.E. National Academy Press; Washington, DC: 1999. Making climate forecasts matter. [Google Scholar]
- UNITAR et al. 2004 National Adaptation Programmes of Action, NAPA: selection of examples and exercises drawn from regional NAPA workshops. Geneva: UNITAR.
- Washington R, Downing T.E. Seasonal forecasting of African rainfall: prediction, responses and household food security. Geogr. J. 1999;165:255–274. [Google Scholar]
- Ziervogel G. Targeting seasonal climate forecasts for integration into household level decisions: the case of smallholder farmers in Lesotho. Geogr. J. 2004;170:6–21. doi:10.1111/j.0016-7398.2004.05002.x [Google Scholar]
- Ziervogel G, Calder R. Climate variability and rural livelihoods: assessing the impact of seasonal climate forecasts. Area. 2003;35.4:403–417. doi:10.1111/j.0004-0894.2003.00190.x [Google Scholar]
- Ziervogel G, Downing T.E. Stakeholder networks: improving seasonal forecasts. Clim. Change. 2004;65:73–101. doi:10.1023/B:CLIM.0000037492.18679.9e [Google Scholar]
- Ziervogel G, Bithell M, Washington R, Downing T. Agent-based social simulation: a method for assessing the impact of seasonal climate forecast applications among smallholder farmers. Agric. Syst. 2005;83:1–26. doi:10.1016/j.agsy.2004.02.009 [Google Scholar]