Abstract
Transcriptional noise is known to play a crucial role in heterogeneity in bacteria and yeast. Mammalian macrophages are known to exhibit cell-to-cell variation in their responses to pathogens, but the source of this heterogeneity is not known. We have developed a detailed stochastic model of gene expression that takes into account scaling effects due to cell size and genome complexity. We report the results of applying this model to simulating gene expression variability in mammalian macrophages, demonstrating a possible molecular basis for heterogeneity in macrophage signalling responses. We note that the nature of predicted transcriptional noise in macrophages is different from that in yeast and bacteria. Some molecular interactions in yeast and bacteria are thought to have evolved to minimize the effects of the high-frequency noise observed in these species. Transcriptional noise in macrophages results in slow changes to gene expression levels and would not require the type of spike-filtering circuits observed in yeast and bacteria.
Keywords: gene expression noise, size scaling, stochasticity, macrophage signalling
1. Background
White blood cells, such as macrophages, recognize microbial pathogens via the innate immune receptors, of which the Toll-like receptors (TLRs) are critical members (Takeda et al. 2003). Each TLR recognizes specific features of pathogens and differentially activates inflammatory and other immune responses via a regulated series of events that tailor defences to deal with the particular threat. Inflammation can lead to multiple outcomes: resolution of the infection and complete restoration of tissue architecture, tissue destruction (scarring), ongoing (chronic) inflammation, initiation of new inflammatory responses (autoimmunity) and failure to control the infection. Moreover, past and concurrent signalling events can also influence these outcomes, depending on duration and intensity (Aderem et al. 1986; Sato et al. 2000; Gordon 2003).
TLR signalling is well-characterized in terms of inputs (microbial ligands) and outputs (macrophage coordination of immune responses), but not in terms of the signalling and transcriptional regulatory mechanisms that orchestrate the specific ligand-induced responses. These molecular mechanisms presumably account for stimulus- and time-dependent gene regulation via feedback loops and specific circuitry such as switches, multiplexers, amplifiers, oscillators, etc.
2. Specificity of the TLR-mediated macrophage responses to microbes
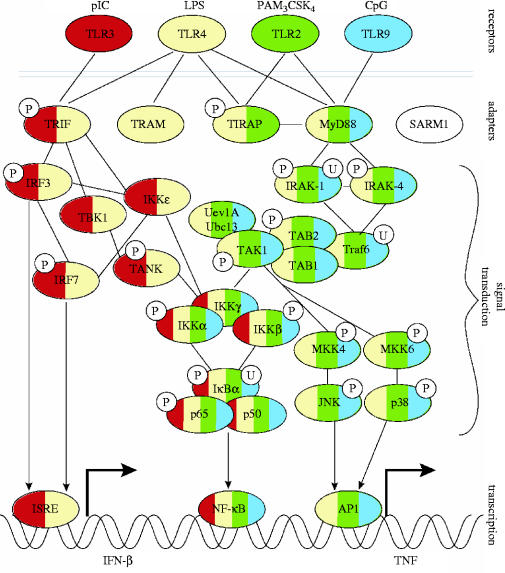
When a macrophage encounters microbes, TLR signalling alters the expression of hundreds of genes (Nau et al. 2002). The highly specific response of TLRs to different molecular identifiers of pathogens (e.g. lipopolysaccharide, dsRNA, bacterial flagellin, CpG DNA) is well documented. Signalling is induced by the recruitment of proximal adapter molecules to the TLR cytoplasmic domains (figure 1). Several TLR adapters have been identified, and it is hypothesized that selective adapter recruitment underlies the specificity of signal transduction (Horng et al. 2002; Yamamoto et al. 2002, 2003; Hoebe et al. 2003). However, the majority of the approximately 30 known signal transduction proteins downstream of the adapters are used by all TLRs. Thus, the manner in which different cellular responses are generated by a common set of signalling elements remains mysterious. The macrophage's recent history also regulates the TLR pathway. Prior exposure to microbial products, such as lipopolysaccharide, dramatically alters responses, and depending on dose and timing, leads to the phenomena of priming (increased sensitivity subsequent to a small initial stimulation; Aderem et al. 1986) and tolerance (adaptation to long-term stimulation; Sato et al. 2000).
Figure 1.
Outline of the TLR signalling pathway. Shown are a subset of the ligands, TLRs, proximal adapters, signalling machinery and transcription factors. The phosphorylation (P) or ubiquitination (U) states of molecules are indicated, as are the known interactions (lines) between molecules or complexes. Arrows indicate interfaces between signalling and the activation of transcription. The colour-coding of the signalling molecules indicates the specificity (and overlap) in their use by the different TLRs. For example, TLR3 uses TRIF, and TLR9 uses MyD88, while TLR4 uses TRIF, TIRAP and MyD88.
3. Macrophage diversity
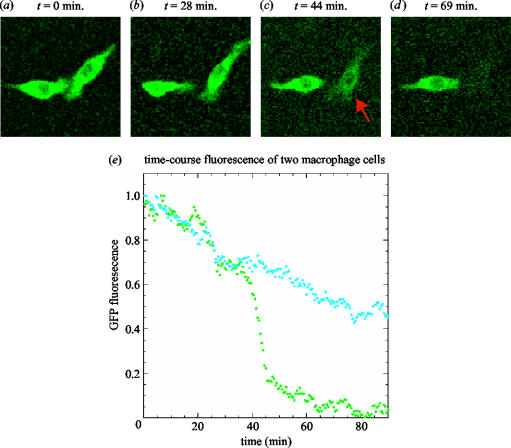
An additional complexity in modelling the TLR pathway is that macrophage populations are known to be heterogeneous in terms of cellular state and response (Hume 2000; Ravasi et al. 2002; Hoebe et al. 2003) as illustrated in the example cells in figure 2. Such heterogeneity could be due to a number of factors including: (i) inherited differences in DNA structure or cellular protein profile; (ii) a unique past history that drives individual cells to be in different stable states that are maintained through regulatory networks controlling mRNA and protein levels; and (iii) intrinsic noise in gene expression patterns due to the stochastic nature of transcription and translation, evident particularly at low copy numbers.
Figure 2.
(a)–(d) Macrophage heterogeneity in signalling. Video microscopy of a clone of two individual RAW 264.7 macrophage cells expressing human-IκBα-EGFP during stimulation with 1 μg ml−1 dsRNA (a ligand that binds Toll-like receptor 3). The decline in EGFP fluorescence (cell marked by red arrow) is indicative of IκBα degradation during signalling leading to NF-κB activation. (e) Quantification of IκBα degradation in two individual cells. The fluorescence of each cell in (a)–(d) was quantified and normalized to its initial value. Note how IκBα degradation starts at the same rate in both cells, then at about 40 min the cell on the right suddenly degrades its IκBα much faster and further than the cell on the left. The delayed onset of differential behaviour is consistent with the hypothesis that the difference between the two cells may be due to transcriptional noise in genes whose products interact with the signal transduction pathway upstream of IκBα.
It is well established that measurement of cell-averaged responses in heterogeneous populations of cells can be highly misleading (McAdams & Arkin 1997; Vilar et al. 2003). For example, a recent study of the p53 pathway (Lahav et al. 2004), showed that what appear to be damped oscillations in cell population assays are actually different numbers of equal-sized pulses in individual cells. It is, therefore, important to develop single-cell models that provide experimentally testable, mechanistic and quantitative explanations of cellular heterogeneity (Rosenfeld et al. 2005).
4. Stochastic noise in gene expression
In bacteria, seminal studies (McAdams & Arkin 1997; Ozbudak et al. 2002; Swain et al. 2002) have demonstrated that inherent stochastic noise in gene expression (due to small numbers of molecules, thermal noise, etc; referred to as intrinsic variability), as well as variability in cellular transcription factor activity levels (e.g. inherited factor concentrations; referred to as extrinsic variability), can result in cellular heterogeneity. A recent study (Raser & O'Shea 2004) measured comparable levels of gene expression variability in yeast. The study also showed that the kinetics of individual steps in gene expression, such as transcription factor complex formation, RNA polymerase recruitment, and translational efficiency, can vary the amount of intrinsic noise in gene expression several fold.
As Raser and O'Shea point out, intrinsic gene expression noise has been invoked as a source of phenotypic variation in a number of very different settings: the lambda phage lysis–lysogeny switch (Arkin et al. 1998), phase variation in bacteria (Hallet 2001), receptor expression on mammalian olfactory neurons (Serizawa et al. 2003) and tumour formation (Magee et al. 2003). Does it also underlie macrophage heterogeneity?
As we (Orrell & Bolouri 2004; de Atauri et al. 2005) and others (Becskei & Serrano 2000; Morishita & Aihara 2004) have shown, intrinsic noise can be filtered out by some intra-cellular biochemical networks (e.g. negative feedback, dimerization). Extrinsic variability leading to cells being in different states can arise from stochastic and deterministic origins. Stochastic differences in cellular content could arise from non-deterministic processes such as the numbers of molecules, molecular complexes, or organelles inherited during cell division. Deterministic differences could occur through cell–cell interactions, or through processes such as DNA re-arrangement, or chromatin remodelling during cell division. Another extrinsic source of variability in macrophages could be that each macrophage senses a slightly different amount of ligand (for example due to expression of different numbers of receptors), and multiple ultra-sensitive thresholds in the signal transduction pathway act as a decision tree, distributing macrophage responses according to the amounts of ligand-sensed.
Intuitively, one may expect much less intrinsic noise in larger mammalian cells. This intuition is principally based on a scaling argument. Figure 3 compares the volumes of four cell types. Yeast cells are approximately 10 times larger (by volume) than bacteria. Macrophages are approximately 1000 times larger (by volume) than Escherichia coli. Literature reports of mRNA and protein copy numbers in each cell type suggest that these copy numbers scale with the cell volume (Neidhardt 1996; Ghaemmaghami et al. 2003; Lehner & Cresswell 2004). The coefficient of variation of the Poisson distribution decreases with increasing average copy number, so we might expect macrophages to be virtually free of intrinsic variability. In addition, if the half-life of a protein is very long (as it can be in mammalian cells), then gene expression (within a single-cell context) can stop after a short burst of synthesis. From that point onwards, there will be no noise due to stochastic gene expression. Moreover, the number of copies of extremely slowly degrading proteins tends to be very high, so one might argue that the average behaviour is essentially noise-free. Finally, we note that the number of copies of most genes is limited to one in E. coli and haploid yeast, and two in diploid yeast and in macrophages; this is especially true for transcription factor genes (Nelson et al. 2004).
Figure 3.
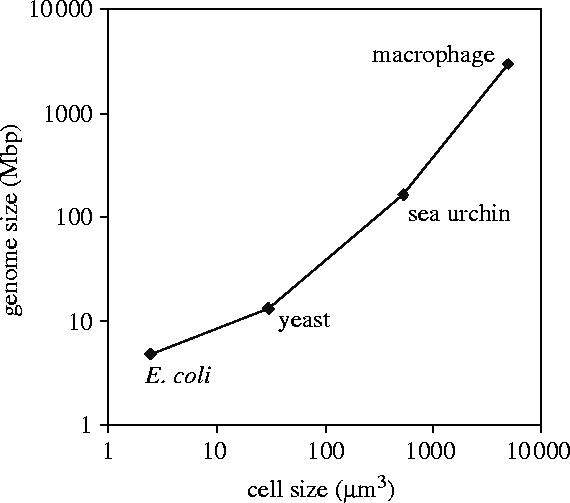
Genome size versus cell size. Comparison of genome size and cell size, for four different cell types: the bacterium Escherichia coli; the yeast Saccharomyces cerevisiae; the sea urchin Strongylocentrotus purpuratus; a human macrophage cell. To a first approximation, cell volume and genome size appear to scale linearly from bacteria, to yeast, simple animals (sea urchin embryonic cells) and mammalian macrophages. On the whole, contents of the larger cells appear to scale such that the total amount of chemical noise is approximately the same in all four cell types (see figure 5).
As we will demonstrate, the intuition that macrophage cells must have very low cell-to-cell variability due to the above size-scaling arguments turns out to be incorrect. There are two reasons for this. Firstly, as shown in figure 3, genome size grows even faster than volume as we go from E. coli to yeast to macrophages. This sharply increases the number of non-specific transcription factor–DNA interactions. As a result, we may expect transcription factor occupancy on cis-regulatory DNA to be approximately at the same level in all four organisms considered. Secondly, transcription factors, because they need to be regulated dynamically, tend to have shorter half-lives and fewer copies per cell than most structural genes, and are thus a source of extrinsic noise for the genes they regulate.
5. Model of gene expression at the single-gene scale
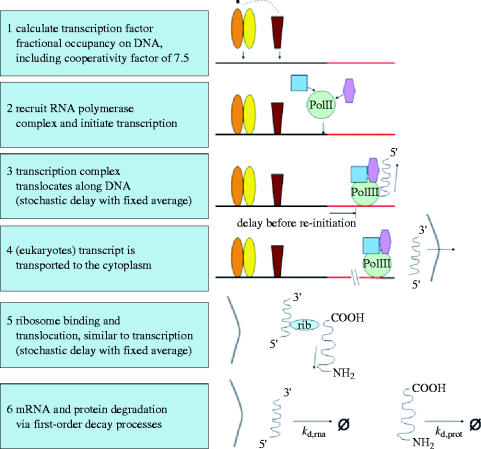
We have constructed stochastic models of gene expression in macrophages, yeast and bacteria. Our models differ from previous models (McAdams & Arkin 1997; Hasty et al. 2000; Ozbudak et al. 2002; Swain et al. 2002; Raser & O'Shea 2004) in that, instead of Langevin equations and/or formulations based purely on first order kinetics, we stochastically simulate multiple steps in transcription and translation and perform statistically large numbers of single-cell in silico experiments. Furthermore, we take into account the effect of non-specific binding of transcription factors on the average fractional activation of a gene (Bolouri & Davidson 2003). A summary of the steps in our model of gene expression is given in figure 4. Due to the time delays for transcription and translation, our stochastic model is non-Markovian (Gibson & Bruck 2000). The complete description of our model is presented, in the Dizzy model definition language (Ramsey et al. 2005), in the electronic supplementary material. Our bacteria, yeast and macrophage models differ from one another by more than cell and genome size; as far as possible, we employ species-specific parameters as described in table 1.
Figure 4.
Outline of our stochastic model of gene expression. Each step in the diagram corresponds to a sequence of steps in the stochastic process.
Table 1.
Parameters of our stochastic model of gene expression in a mammalian macrophage.
| parameter | value | source |
|---|---|---|
| genome size | 2.9×10⁹ bp | (IHGSC 2004) |
| number of genes | 25 000 | (IHGSC 2004) |
| typical coding region length | 3000 nucleotides | (Strachan & Read 1999) |
| transcription translocation rate | 1800 nucleotides min−1 | (Howe et al. 2003) |
| minimum inter-transcript distance on DNA | 140 nucleotides | (Davidson 1986) |
| RNA polymerase molecules/cell | 30 000 | (Borggrefe et al. 2001) |
| maximal transcription initiation rate | 1800/140=12.8 min−1 | (derived) |
| t1/2 mRNA | 600 min; non-transcription factors | (Yang et al. 2003) |
| t1/2 mRNA | 100 min; transcription factor genes | (Yang et al. 2003) |
| ribosome molecules per cell | 6×10⁶ | (Lehner & Cresswell 2004) |
| maximal translation initiation rate | 300/26.6=11.3/(min*mRNA) | (derived) |
| translation translocation rate | 300 codons min−1 | (Princiotta et al. 2003) |
| minimum inter-ribosome distance | 26.6 codons | (McAdams & Arkin 1997) |
| typical protein length | 470 codons | (Lodish et al. 2000) |
| t1/2 protein | 24 h for non-degrading proteins | (Lehner & Cresswell 2004) |
| t1/2 life protein | 50 min for rapidly degraded proteins | (Lehner & Cresswell 2004) |
| t1/2 life protein | 200 min for a notional average protein | (Lehner & Cresswell 2004) |
| cell volume | 5×10⁻¹² ℓ | (Freitas 2003) |
| average number of RNA molecules per cell | 0.2–1.0×10⁶ | (Nowakowski-Gashaw et al. 2002) |
| average number of protein molecules per gene | 430 000 | (Lehner & Cresswell 2004) |
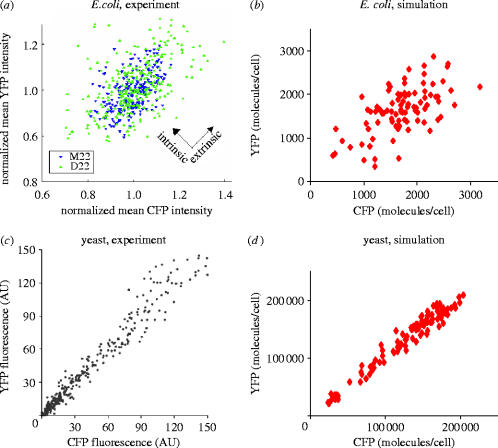
To distinguish between intrinsic and extrinsic noise, our model contains two similar reporter genes (ostensibly coding for cyan and yellow fluorescent protein, respectively) with identical promoters and identical fractional activation of gene expression. The rates of initiation of transcription and translation, and the rates of degradation for mRNA and proteins were assumed to be the same for the two reporters. The example promoter used in the studies reported herein has cis-elements for two transcription factors that bind cooperatively. Both factors must be bound for transcription to occur, in the model used in this study. However, our method is general and can capture regulation by multiple transcription factors. We used a Monte Carlo technique to simulate the stochastic dynamics of this system, under steady-state conditions, at different fractional levels of gene activation. With parameters appropriate to bacteria and yeast, our theoretical model of expression noise captures the reported characteristics of transcriptional noise well. Figure 5 shows a side-by-side comparison of our simulation results with experimental observations for E. coli and yeast. These results demonstrate that our model of transcription for yeast and bacteria captures the relationship between intrinsic and extrinsic noise, and the dependency of the intrinsic noise magnitude on the cell-averaged gene expression level.
Figure 5.
Intrinsic and extrinsic noise. (a, b) Intrinsic noise shows up as the spread of points along the y=−x axis and extrinsic noise causes the spread along the y=x axis. This is because extrinsic noise (alone) causes the two reporters to vary in an identical fashion; any differences between the two reporters (in the same cell) is attributed to intrinsic noise. An E. coli gene at low expression levels. (a) Experimental data reproduced with permission from (Elowitz et al. 2002). The data shows less intrinsic noise for strain M22 than for strain D22. (b) Simulation of the same scenario. (c, d) A yeast gene at high expression levels. (c) experimental data reproduced with permission from Raser & O'Shea (2004). (d) simulation of the same scenario. Here, CFP means cyan fluorescent protein, and YFP means yellow fluorescent protein. In the simulations, ‘CFP’ and ‘YFP’ are just the names given to our two in silico reporter genes.
We adapted our eukaryotic model of transcription and translation to the macrophage system by altering the parameters in the model to values appropriate to a mammalian macrophage. Table 1 lists the parameters which we extracted from the literature. Many of these parameters are known to adequate accuracy for our needs (e.g. the size of the genome, codon-lengths of specific proteins). Others appear to have little effect on our predictions (e.g. the numbers of polymerase and ribosome molecules reported are well in excess of the numbers of transcribing genes and transcripts, respectively). By far the most critical parameters of the models are (i) the rate of initiation of transcription and translation; and (ii) the half-lives of mRNAs and proteins. Half-lives are known to vary considerably across the transcriptome and proteome (Pratt et al. 2002; Wang et al. 2002). However, for the studies reported here the important issue is ratio of half-lives of similar proteins in protozoans and mammals. We note that—due to dilution caused by rapid cellular growth (cellular volume approximately doubling prior to every cell division)—the half-lives of mRNA and proteins in budding yeast and bacteria during exponential growth is necessarily less than the cell division time. Since mammalian cells such as macrophages grow and divide an order of magnitude more slowly, their protein half lives can be correspondingly longer, which leads to qualitatively different transcriptional noise characteristics.
Using our model system of two reporter genes, we investigated whether a macrophage gene (at an equivalent fractional level of activation) has less intrinsic noise than a yeast or bacterial gene. With a fractional occupancy of approximately 10–15% in all three models (bacteria, yeast and macrophage), we found that the coefficient of variation (the standard deviation divided by the mean) for the intrinsic noise contribution to protein abundance was not significantly different. The results for all three model organisms are shown in figure 6; the spread of data transverse to the axis of equal-gene expression represents variation due to intrinsic gene expression noise.
Figure 6.
Simulations of intrinsic and extrinsic noise in three organisms. Simulations to steady state (1500, 600 & 300 min, respectively) at occupancies of approximately 10–15% show similar coefficients of variation across species and cell sizes.
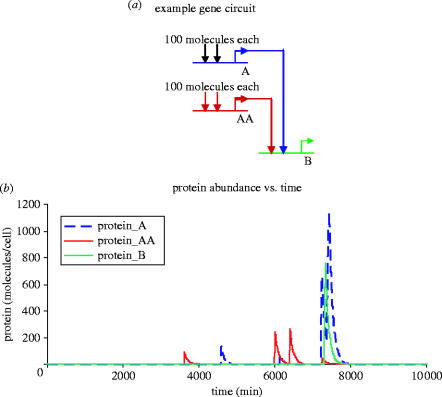
Next, we studied the stochastic dynamics of transcriptional activation. We found that in bacteria and yeast, at low gene activation, protein abundances can exhibit large transient spikes. This is due to the comparatively short lifetime for protein and mRNA in those systems, and the predominance of intrinsic noise in the mRNA concentration at low expression levels. Figure 7b shows an extreme example in the yeast model for a gene at basal (very low) activation. The protein abundance is seen to exhibit significant transient spikes that are highly correlated (with a fixed delay) with the previous production of a completed mRNA transcript. Note the simulation was performed over an artificially long period in order to capture a few examples of such activity spikes.
Figure 7.
Simple single-gene system with two transcription factors. (a) A simple gene network. Two transcription factors bind cooperatively and activate transcription in gene B. (b) Sample simulation results for a typical yeast gene, at basal activity levels (fractional saturation=0.00025). These simulations were carried out for an artificially long period (10 000 min) to capture several transcriptional spike events for illustrative purposes. Translation of the mRNA spikes into proteins results in high protein concentrations that are short in duration due to the relatively short half-life of proteins and mRNA in exponentially growing yeast cultures.
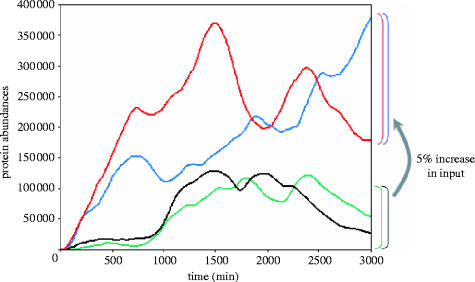
In the macrophage, we found that the protein abundance showed generally lower-frequency (slowly varying) noise. Figure 8 compares representative simulated protein levels for a macrophage gene with parameters typical of transcription factors. Transcription was activated at time zero. We simulated the dynamics of the model over a period of approximately 48 h, typical of periods over which macrophages are experimentally assayed. Note that the variability in each trace is considerable, and that it occurs on a very slow time-scale. The lack of high-frequency noise, as compared to simulated single-cell protein abundances in prokaryotes, is due to the relatively slow mRNA and protein degradation in mammalian cells. The upper two curves (red and blue) represent the gene at just 5% more transcriptional activity (higher transcription factor occupancy) than the bottom two curves (black and green). Note that, as indicated by the areas highlighted in red and blue, the two slightly more active genes have protein levels more than 10 times in excess of the 5% less activated genes for periods exceeding a day. The long-term average expression level of the less active gene pair is only about 30% lower than that of the more active gene pair. Thus, the intrinsic expression noise for each gene, when added to small, potentially stochastic variations in cellular content (here 5%) can result in very clear heterogeneity in cellular states as defined by gene expression levels.
Figure 8.
Simulated stochastic transcriptional noise in macrophages. A simulation of four protein levels in macrophage. The green and black protein levels are driven by the one transcription factor, and the red and blue protein levels are driven by another transcription factor that has an elevated (+5%) average abundance. The variations within each curves and also between the blue and red protein levels, and between the green and black protein levels, is due to the intrinsic noise in transcription. In contrast to E. coli and yeast genes, which exhibit rapidly changing (spiky) protein levels, in macrophages intrinsic variations in protein levels occur very slowly (due to much slower mRNA and protein degradation rates), on a time-scale of hours. This scenario mimics two cells with 5% random difference in their cellular content and illustrates how this small difference, when amplified by slow intrinsic variations in gene expression can result in cells that are highly heterogeneous in terms of cellular content over periods of the order of 20 h.
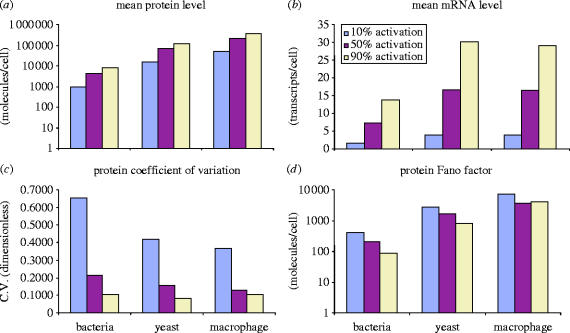
To better understand the role of transcriptional noise in macrophages, we systematically compared the steady-state noise profile of a single gene for the three model systems (bacteria, yeast and macrophage) at steady-state. A large ensemble of 7500 stochastic simulations was used, to ensure accuracy in computing the standard deviation and average protein abundance. Figures 9 and 10 summarize our findings for the cross-species comparison of single-gene expression. In figure 9, we display the average mRNA level, protein level, coefficient of variation of the protein level (standard deviation divided by the mean) and the Fano factor of the protein level (the ratio of the variance to the mean). While the coefficient of variation in the protein level is slightly less in macrophages than in yeast and bacteria, the magnitude of protein abundance noise, given by the Fano factor is twofold higher in macrophages. A Poisson process will result in a Fano factor of 1; the large Fano factor for macrophages indicates a high degree of variability. For protein abundance, a related measure of noise is the ‘burst size’ of protein production, which is the number of proteins produced over the lifetime of an mRNA transcript (Ozbudak et al. 2002). In our model, the protein burst size is determined parametrically, and is 99.25, 1004.6 and 5437.4, respectively, for bacteria, yeast and macrophage (irrespective of activation level). Considering the data in figure 2e, the twofold higher noise scale in macrophages could lead to considerable long-term heterogeneity, despite the large average abundance of a typical structural macrophage protein.
Figure 9.
Cross-species comparison of simulated gene expression noise. The results of steady-state stochastic simulations of our model of gene expression for parameters corresponding to three species are summarized. The bacterial species is E. coli; the yeast species is S. cerevisiae; the macrophage parameters were taken from mammalian data. Three different cases were simulated, corresponding to 10, 50 and 90% gene activation. (a) Average protein level is shown, on a semi-log chart. (b) Average mRNA level is shown. Yeast and macrophage have a comparable average number of transcripts in this simulation. (c) The coefficient of variation (standard deviation over the mean) of protein abundance is shown. The results are qualitatively consistent with the formula of Elowitz et al. (2002), , where ηint2 is the intrinsic noise, m is the level of expression and c1 and c2 are constants. (d) The protein Fano factor (variance over the mean) is shown. For the macrophage, the protein Fano factor appears to saturate above 50% gene expression, indicating that a minimum scale of protein variability is expected regardless of the expression level.
Figure 10.
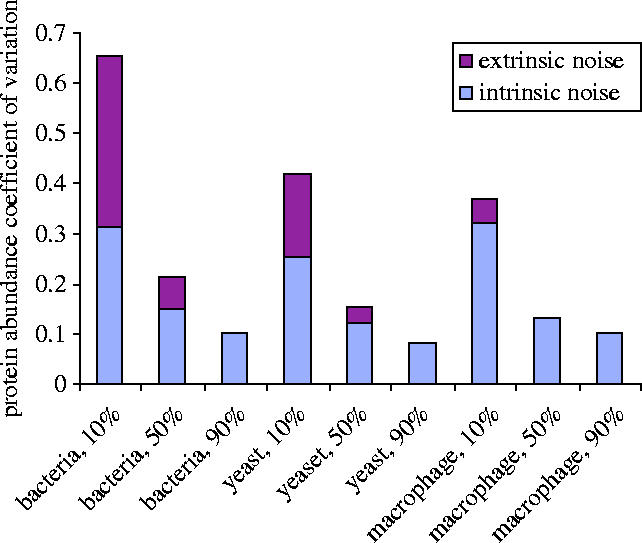
Cross-species comparison of intrinsic and extrinsic noise. Based on a single-gene stochastic simulation at steady-state, the total coefficient of variation for protein abundance was measured. Using the estimation formula for intrinsic noise , where ‘burst’ is the burst parameter (given in the main text), and ‘prot’ is the mean protein abundance, we estimated the contribution of intrinsic noise to the total coefficient of variation. The remaining component of the noise is attributed to extrinsic noise (from the transcription factor concentration fluctuations).
Using the formula of (Ozbudak et al. 2002), we estimated the intrinsic noise contribution to the variance in the protein abundance as the square root of the ratio of the ‘burst parameter’ to the average protein abundance. We compared this intrinsic noise estimate to the total average variation observed in the simulation, for the three species and conditions of 10, 50 and 90% gene activation. The results are summarized in figure 10 and confirm our observation that intrinsic noise coefficients in yeast, bacteria and macrophage are comparable at 10% activation. They also show that extrinsic noise makes an important contribution at 10% activation, but is insignificant at 90% activation.
6. Implications of transcriptional noise for organizational principles in macrophages
We showed above that macrophages can exhibit significant gene expression noise, and that they have fundamentally different noise characteristics from yeast and bacteria. In this section, we speculate that this difference can lead to different evolutionary pressures and hence different organizational principles in macrophage genetic regulatory networks. We illustrate our argument with a specific example: the feed-forward loop (FFL) network motif, which has been found to be prevalent in bacterial and yeast regulatory networks (Milo et al. 2002; Shen-Orr et al. 2002; Luscombe et al. 2004). In the context of a genetic regulatory network, the FFL can consist of three genes arranged in a three-gene cascade, with the first gene additionally acting as an input to the third gene.
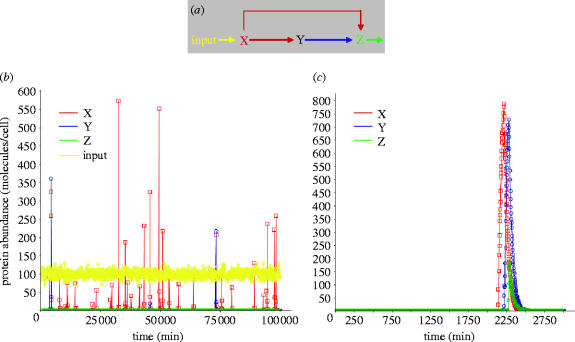
Figure 11a shows a gene network diagram with a FFL. Depending on whether each link in the motif upregulates or downregulates its target, and whether the third gene's inputs act as a logical AND or OR, the FFL can act as either a sign-sensitive delay or a sign-sensitive accelerator, and the output can either be inverted or non-inverted (Mangan & Alon 2003). Sign sensitivity means that the delay effect depends on the sign of the input transition, i.e. whether the input changes from the ‘high’ to the ‘low’ state, or vice versa.
Figure 11.
Feed-forward loop network motif. Simulation of the feed forward motif acting as a filter of intrinsic noise in yeast (a) Network model of the feed forward motif. Gene X drives both genes Y and Z. Y also drives Z. X and Y cooperatively bind and activate Z. In these simulations (b, c), the input transcription factor (yellow) is held in a basal steady state of approximately 100 molecules. The stochastic input to the red gene (X) results in occasional spikes in transcription by this gene. The blue gene (Y), which is driven by the red gene's output, is also occasionally driven briefly to an active state, but its activity is delayed compared to the red gene. Consequently, the green gene, which can only be active when both its inputs are active at the same time, is never activated. In other words, the green gene has filtered out the noise in the yellow input transcription factor and the resulting spikes of activity seen in the red and blue genes. (b) Shows simulation results over an arbitrarily long period of time in order to highlight the frequency with which transcriptional noise spikes occur in the outputs of genes X and Y (but in gene Z). (c) Example of the same circuit simulated over a more realistic time window of 48 h shows the widths of the spikes produced by X and Y, and that Y output does not overlap significantly with X output. In consequence, the spikes in X and Y activity do not translate to a significant level of activity in Z.
In E. coli and yeast, the most abundant FFL motif has ‘coherent’ upregulation for all three links (Mangan & Alon 2003). In this configuration, the FFL acts as a delay when the input to the first gene goes from a low (inactive) state to a high (active) state. When the third gene's cis-regulatory inputs combine in a logical AND, this configuration is a sign-sensitive delay, without output inversion. It can act as a filter to suppress spikes when the first gene's input is normally in the low state. Simulation results demonstrating this effect, for a simulated gene cascade implanting a FFL in yeast, are shown in figure 11b. The simulation results illustrate the noise suppression that a FFL can exert in the case of high-frequency burst-like noise on top of a low steady state input. We note, however, that unlike a low-pass filter, the FFL as described above would not delay a rapid transition of the input from the high state to the low state; in this sense, the FFL is functionally quite distinct from a feedback-type noise filter. Given that E. coli and yeast tend to have high intrinsic transcriptional noise, it is possible that the prevalence of this particular FFL type may be explained by the need to suppress propagation of spurious noise spikes through a regulatory cascade, so that downstream genes will not be activated unless the upstream controller genes switch to the high state for a minimum duration.
Recent studies have indicated that the FFL motif is also prevalent in mammalian genetic regulatory networks. A recent chromatin–immunoprecipitation study (Odom et al. 2004) mapped out the regulatory network controlled by the HNF family of transcription factors, in human pancreas and liver cells. The authors demonstrated that HNF6 is the controller of a FFL regulating the gene PCK1. Another study (Hinz et al. 2000) reported evidence that PGE2 acts through a FFL to regulate the expression of its own synthesizing enzyme (COX-2) in RAW 264.7 cells. The authors speculate that the purpose of this feed-forward interaction may be to modulate COX-2 expression in macrophages within inflamed tissues. These studies lead us to consider the general implications of a FFL in a genetic regulatory network within a macrophage. The propensity of gene expression within a macrophage to exhibit a slowly varying protein abundance (as shown in figure 7 of this paper), as opposed to the high-frequency burst-type noise observed in prokaryotes, would seem to obviate the need for a FFL implementing a sign-sensitive delay. The delay effect mediated by the middle gene (gene Y in figure 11a) would need to be of the order of several hours to act as a filter for the type of expression noise we see in macrophages. Thus, it seems unlikely that the FFL motif acts a transcriptional noise filter in macrophages. Perhaps the FFL within a macrophage regulatory network helps accelerate the de-activation of the downstream gene (Z), after the upstream inputs have switched to a low state. In this way, the FFL motif would ameliorate the effect of long protein half lives in mammalian cells.
7. Material and methods
The human IκBα cDNA was amplified from peripheral-blood leucocytes and cloned into the pEF6/V5-His vector (Invitrogen), in frame with EGFP (Clontech), and expressed under the control of the EF1-a promoter. This construct was electroporated into RAW 264.7 macrophage cells and a high-expressing clone (#28) was selected by flow cytometry and expanded. Cells were cultured in RPMI 1640/10% FCS including 25 mM HEPES and stimulated with 1 μg ml−1 pI.pC dsRNA (Sigma). Time course images were taken on a Leica TCS–SP2 laser-scanning confocal microscope. Fluorescence was excited at 488 nm and emission measured from 500 to 550 nm at 40× magnification with the detection pinhole at 600 μm diameter to give a 14 μm depth-of-field.
Whole-cell fluorescence was measured as follows. A mask was created using the entire series of images to define the extent of cellular motion over the course of the experiment. All contiguous pixels which were more than 10% above the background in any image in the series were included in the mask region. After background subtraction, the total flux within this boundary was taken as a measure of the total amount of IκBα-GFP within each cell.
All simulations were carried out with the Dizzy kinetic simulation modelling environment (Ramsey et al. 2005). An ensemble size of 7500 was used for the stochastic simulations. The stochastic simulations were carried out using the Gibson–Bruck simulator option, on an Intel Pentium 4 workstation running the Sun Java virtual machine v.1.4.2 under Fedora Core 1 Linux with kernel v.2.4.22. Steady-state was obtained using a fifth order Dormand–Prince ODE solver with fourth order error estimation. The relative and absolute error tolerances for the ODE solver were 0.0001.
8. Dizzy stochastic simulation software
Dizzy (Ramsey et al. 2005) is a stochastic simulation software package and model description language for systems of interacting biochemical species. Dizzy's simulation engine includes Gillespie's original exact stochastic algorithm (Gillespie 1976), the Gibson–Bruck optimization of this algorithm (Gibson & Bruck 2000), and the ‘Tau-leap’ approximate accelerated algorithm (Gillespie 2001). Dizzy is a stable software package which we have used extensively over the past year to model and simulate multi-gene networks stochastically (de Atauri et al. 2005). Dizzy is written in the Java programming language, and will run on any computing platform that has a Java 1.4 runtime environment. It is available under a free software and open-source license (the Lesser General Public License) and can be found on our group's web page (magnet.systemsbiology.net/dizzy).
An especially pertinent feature of Dizzy is that it allows user-defined library elements: models can be constructed in a modular, hierarchical fashion. We used this feature of Dizzy to construct an organism-specific, parameterized model of all the key steps in gene expression. Changing the parameters of the model allows us to model genes with different characteristics such as: number of regulatory factors, their concentrations over time, and the nature of their kinetic interactions; the rate of RNA polymerase recruitment and transcription initiation by the transcription factor complex; the rate of transcription along DNA; the length of transcribed DNA; the length of the mRNA, mRNA half-life; the rate of ribosome recruitment and initiation of translation; the rate of translocation along the mRNA; and protein half life. A second feature of Dizzy is the ability to estimate, using ODE simulation and the symbolic Jacobian matrix, the steady-state stochastic fluctuations for all species in the model (Orrell et al. 2005). This feature has been successfully applied to estimate the steady-state fluctuations in a nonlinear biochemical model (with 55 reaction channels and 26 chemical species) describing the galactose uptake pathway in yeast.
Acknowledgments
This work was supported in part by grant #10830302 from the National Institute of Allergy and Infectious Disease.
Footnotes
One contribution of 15 to a Dicussion Meeting Issue ‘Bioinformatics: from molecules to systems’.
Supplementary Material
This Electronic Appendix contains seven “.dizzy” files, that together can be used in the Dizzy simulation software program (http://labs.systemsbiology.net/bolouri/software/Dizzy). These Dizzy model files represent a model of a single gene in four different organisms: bacteria (Escherichia coli), yeast (Saccharomyces cerevisiate), sea urchin embryonic cell (Strongylocentrotus purpuratus), and human macrophage. The two files that are loaded directly into Dizzy are “eukaryoteSingleGene.dizzy” and “prokaryoteSingleGene.dizzy”. The eukaryoteSingleGene model definition file loads an organism-specific parameter file (yeast.dizzy, seaurchin.dizzy, or macrophage.dizzy) using an “include” statement. By choosing which include statement to uncomment (lines 27–29 of that file), you can select which organism to simulate. The prokaryoteSingleGene file loads its parameters from the bacteria.dizzy file. If there are any questions about this material, please contact Stephen Ramsey (sramsey@systemsbiology.org).
References
- Aderem A.A, Cohen D.S, Wright S.D, Cohn Z.A. Bacterial lipopolysaccharides prime macrophages for enhanced release of arachidonic acid metabolites. J. Exp. Med. 1986;164:165–179. doi: 10.1084/jem.164.1.165. 10.1084/jem.164.1.165 [DOI] [PMC free article] [PubMed] [Google Scholar]
- Arkin A.P, Ross J, McAdams H.H. Stochastic kinetic analysis of a developmental pathway bifurcation in phage λ-infected Escherichia coli cells. Genetics. 1998;149:1633–1648. doi: 10.1093/genetics/149.4.1633. [DOI] [PMC free article] [PubMed] [Google Scholar]
- Becskei A, Serrano L. Engineering stability in gene networks by autoregulation. Nature. 2000;405:590–593. doi: 10.1038/35014651. 10.1038/35014651 [DOI] [PubMed] [Google Scholar]
- Bolouri H, Davidson E.H. Transcriptional regulatory cascades in development: initial rates, not steady state, determine network kinetics. Proc. Natl Acad. Sci. USA. 2003;100:9371–9376. doi: 10.1073/pnas.1533293100. 10.1073/pnas.1533293100 [DOI] [PMC free article] [PubMed] [Google Scholar]
- Borggrefe T, Davis R, Bareket-Samish A, Kornberg R.D. Quantitation of the RNA polymerase II transcription machinery in yeast. J. Biol. Chem. 2001;276:47 150–47 153. doi: 10.1074/jbc.M109581200. 10.1074/jbc.M109581200 [DOI] [PubMed] [Google Scholar]
- Davidson E.H. 3rd edn. Academic Press; Orlando, FL: 1986. Gene activity in early development. [Google Scholar]
- de Atauri P, Orrell D, Ramsey S, Bolouri H. Evolution of ‘design’ principles in biochemical networks. IEE Syst. Biol. 2005;1:28–40. doi: 10.1049/sb:20045013. 10.1049/sb:20045013 [DOI] [PubMed] [Google Scholar]
- Elowitz M.B, Levine A.J, Siggia E.D, Swain P.S. Stochastic gene expression in a single cell. Science. 2002;297:1183–1186. doi: 10.1126/science.1070919. [DOI] [PubMed] [Google Scholar]
- Freitas R.A., Jr . Biocompatibility. vol. IIA. Landes Bioscience; Georgetown: 2003. Nanomedicine. [Google Scholar]
- Ghaemmaghami S, Huh W.K, Bower K, Howson R.W, Belle A, Dephoure N, O'Shea E.K, Weissman J.S. Global analysis of protein expression in yeast. Nature. 2003;425:737–741. doi: 10.1038/nature02046. 10.1038/nature02046 [DOI] [PubMed] [Google Scholar]
- Gibson M.A, Bruck J. Efficient exact stochastic simulation of chemical systems with many species and many channels. J. Phys. Chem. A. 2000;104:1876–1889. 10.1021/jp993732q [Google Scholar]
- Gillespie D.T. A general method for numerically simulating the stochastic time evolution of coupled chemical reactions. J. Comput. Phys. 1976;22:403–434. 10.1016/0021-9991(76)90041-3 [Google Scholar]
- Gillespie D.T. Approximate accelerated stochastic simulation of chemically reacting systems. J. Chem. Phys. 2001;115:1716–1733. 10.1063/1.1378322 [Google Scholar]
- Gordon S. Alternative activation of macrophages. Nat. Rev. Immunol. 2003;3:23–35. doi: 10.1038/nri978. 10.1038/nri978 [DOI] [PubMed] [Google Scholar]
- Hallet B. Playing Dr. Jekyll and Mr. Hyde: combined mechanisms of phase variation in bacteria. Curr. Opin. Microbiol. 2001;4:570–581. doi: 10.1016/s1369-5274(00)00253-8. 10.1016/S1369-5274(00)00253-8 [DOI] [PubMed] [Google Scholar]
- Hasty J, Pradines J, Dolnik M, Collins J.J. Noise-based switches and amplifiers for gene expression. Proc. Natl Acad. Sci. USA. 2000;97:2075–2080. doi: 10.1073/pnas.040411297. 10.1073/pnas.040411297 [DOI] [PMC free article] [PubMed] [Google Scholar]
- Hinz B, Brune K, Pahl A. Prostaglandin E2 upregulates cyclooxygenase-2 expression in lipopolysaccharide-stimulated RAW 264.7 macrophages. Biochem. Biophys. Res. Commun. 2000;272:744–748. doi: 10.1006/bbrc.2000.2859. 10.1006/bbrc.2000.2859 [DOI] [PubMed] [Google Scholar]
- Hoebe K, et al. Identification of Lps2 as a key transducer of MyD88-independent TIR signalling. Nature. 2003;424:743–748. doi: 10.1038/nature01889. 10.1038/nature01889 [DOI] [PubMed] [Google Scholar]
- Horng T, Barton G.M, Flavell R.A, Medzhitov R. The adaptor molecule TIRAP provides signalling specificity for Toll-like receptors. Nature. 2002;420:329–333. doi: 10.1038/nature01180. 10.1038/nature01180 [DOI] [PubMed] [Google Scholar]
- Howe K.J, Kane C.M, Ares M., Jr Perturbation of transcription elongation influences the fidelity of internal exon inclusion in Saccharomyces cerevisiae. RNA. 2003;9:993–1006. doi: 10.1261/rna.5390803. 10.1261/rna.5390803 [DOI] [PMC free article] [PubMed] [Google Scholar]
- Hume D.A. Probability in transcriptional regulation and its implications for leukocyte differentiation and inducible gene expression. Blood. 2000;96:2323–2328. [PubMed] [Google Scholar]
- IHGSC (International Human Genome Sequencing Consortium) Finishing the euchromatic sequence of the human genome. Nature. 2004;431:931–945. doi: 10.1038/nature03001. 10.1038/nature03001 [DOI] [PubMed] [Google Scholar]
- Lahav G, Rosenfeld N, Sigal A, Geva-Zatorsky N, Levine A.J, Elowitz M.B, Alon U. Dynamics of the p53–Mdm2 feedback loop in individual cells. Nat. Genet. 2004;36:113–114. doi: 10.1038/ng1293. 10.1038/ng1293 [DOI] [PubMed] [Google Scholar]
- Lehner P.J, Cresswell P. Recent developments in MHC-class-I-mediated antigen presentation. Curr. Opin. Immunol. 2004;16:82–89. doi: 10.1016/j.coi.2003.11.012. 10.1016/j.coi.2003.11.012 [DOI] [PubMed] [Google Scholar]
- Lodish H, Berk A, Zipursky L.S, Matsudaira P, Baltimore D, Darnell J. 4th edn. Freeman; New York: 2000. Molecular cell biology. [Google Scholar]
- Luscombe N.M, Babu M.M, Yu H, Snyder M, Teichmann S.A, Gerstein M. Genomic analysis of regulatory network dynamics reveals large topological changes. Nature. 2004;431:308–312. doi: 10.1038/nature02782. [DOI] [PubMed] [Google Scholar]
- Magee J.A, Abdulkadir S.A, Milbrandt J. Haploinsufficiency at the Nkx3.1 locus. A paradigm for stochastic, dosage-sensitive gene regulation during tumor initiation. Cancer Cell. 2003;3:273–283. doi: 10.1016/s1535-6108(03)00047-3. 10.1016/S1535-6108(03)00047-3 [DOI] [PubMed] [Google Scholar]
- Mangan S, Alon U. Structure and function of the feed-forward loop network motif. Proc. Natl Acad. Sci. USA. 2003;100:11 980–11 985. doi: 10.1073/pnas.2133841100. 10.1073/pnas.2133841100 [DOI] [PMC free article] [PubMed] [Google Scholar]
- McAdams H.H, Arkin A.P. Stochastic mechanisms in gene expression. Proc. Natl Acad. Sci. USA. 1997;94:814–819. doi: 10.1073/pnas.94.3.814. 10.1073/pnas.94.3.814 [DOI] [PMC free article] [PubMed] [Google Scholar]
- Milo R, Shen-Orr S, Itzkovitz S, Kashtan N, Chklovskii D, Alon U. Network motifs: simple building blocks of complex networks. Science. 2002;298:824–827. doi: 10.1126/science.298.5594.824. [DOI] [PubMed] [Google Scholar]
- Morishita Y, Aihara K. Noise-reduction through interaction in gene expression and biochemical reaction processes. J. Theor. Biol. 2004;228:315–325. doi: 10.1016/j.jtbi.2004.01.007. 10.1016/j.jtbi.2004.01.007 [DOI] [PubMed] [Google Scholar]
- Nau G.J, Richmond J.F, Schlesenger A, Jennings E.G, Lander E.S, Young R.A. Human macrophage activation programs induced by bacterial pathogens. Proc. Natl Acad. Sci. USA. 2002;99:1503–1508. doi: 10.1073/pnas.022649799. 10.1073/pnas.022649799 [DOI] [PMC free article] [PubMed] [Google Scholar]
- Neidhardt F.C, editor. Escherichia coli and Salmonella: cellular and molecular biology. American Society Microbiology; Washington, DC: 1996. [Google Scholar]
- Nelson C.E, Hersh B.M, Carroll S.B. The regulatory content of intergenic DNA shapes genome architecture. Genome Biol. 2004;5:R25. doi: 10.1186/gb-2004-5-4-r25. 10.1186/gb-2004-5-4-r25 [DOI] [PMC free article] [PubMed] [Google Scholar]
- Nowakowski-Gashaw I, Mrozikiewicz P.M, Roots I, Brockmöller J. Rapid quantification of CYP3A4 expression in human leukocytes by real-time reverse transcription-PCR. Clin. Chem. 2002;48:366–370. [PubMed] [Google Scholar]
- Odom D.T, et al. Control of pancreas and liver gene expression by HNF transcription factors. Science. 2004;303:1378–1381. doi: 10.1126/science.1089769. 10.1126/science.1089769 [DOI] [PMC free article] [PubMed] [Google Scholar]
- Orrell D, Bolouri H. Control of internal and external noise in genetic regulatory networks. J. Theor. Biol. 2004;230:301–312. doi: 10.1016/j.jtbi.2004.05.013. 10.1016/j.jtbi.2004.05.013 [DOI] [PubMed] [Google Scholar]
- Orrell D, Ramsey S, de Atauri P, Bolouri H. A method for estimating stochastic noise in large genetic regulatory networks. Bioinformatics. 2005;21:208–217. doi: 10.1093/bioinformatics/bth479. 10.1093/bioinformatics/bth479 [DOI] [PubMed] [Google Scholar]
- Ozbudak E.M, Thattai M, Kurtser I, Grossman A.D, van Oudenaarden A. Regulation of noise in the expression of a single gene. Nat. Genet. 2002;31:69–73. doi: 10.1038/ng869. 10.1038/ng869 [DOI] [PubMed] [Google Scholar]
- Pratt J.M, Petty J, Riba-Garcia I, Robertson D.H.L, Gaskell S.J, Oliver S.G, Beynon R.J. Dynamics of protein turnover, a missing dimension in proteomics. Mol. Cell. Proteomics. 2002;8:579–591. doi: 10.1074/mcp.m200046-mcp200. 10.1074/mcp.M200046-MCP200 [DOI] [PubMed] [Google Scholar]
- Princiotta M.F, Finzi D, Qian S.B, Gibbs J, Schuchmann S, Buttgereit F, Bennick J.R, Yewdell J.W. Quantitating protein synthesis, degradation, and endogenous antigen processing. Immunity. 2003;18:343–354. doi: 10.1016/s1074-7613(03)00051-7. 10.1016/S1074-7613(03)00051-7 [DOI] [PubMed] [Google Scholar]
- Ramsey S, Orrell D, Bolouri H. Dizzy: stochastic simulation of large-scale genetic regulatory networks. J. Bioinf. Comput. Biol. 2005;3:415–436. doi: 10.1142/s0219720005001132. 10.1142/S0219720005001132 [DOI] [PubMed] [Google Scholar]
- Raser J.M, O'Shea E.K. Control of stochasticity in eukaryotic gene expression. Science. 2004;304:1811–1814. doi: 10.1126/science.1098641. 10.1126/science.1098641 [DOI] [PMC free article] [PubMed] [Google Scholar]
- Ravasi T, Wells C, Forest A, Underhill D.M, Wainwright B.J, Aderem A, Grimmond S, Hume D.A. Generation of diversity in the innate immune system: macrophage heterogeneity arises from gene-autonomous transcriptional probability of individual inducible genes. J. Immunol. 2002;168:44–50. doi: 10.4049/jimmunol.168.1.44. [DOI] [PubMed] [Google Scholar]
- Rosenfeld N, Young J.W, Alon U, Swain P.S, Elowitz M.B. Gene regulation at the single-cell level. Science. 2005;307:1962–1965. doi: 10.1126/science.1106914. 10.1126/science.1106914 [DOI] [PubMed] [Google Scholar]
- Sato S, Nomura F, Kawai T, Takeuchi O, Muhlradt P.F, Takeda K, Akira S. Synergy and cross-tolerance between toll-like receptor (TLR) 2- and TLR4-mediated signaling pathways. J. Immunol. 2000;165:7096–7101. doi: 10.4049/jimmunol.165.12.7096. [DOI] [PubMed] [Google Scholar]
- Serizawa S, Miyamichi K, Nakatani H, Suzuki M, Saito M, Yoshihara Y, Sakano H. Negative feedback regulation ensures the one receptor–one olfactory neuron rule in mouse. Science. 2003;302:2078–2079. doi: 10.1126/science.1089122. 10.1126/science.1089122 [DOI] [PubMed] [Google Scholar]
- Shen-Orr S.S, Milo R, Alon U. Network motifs in the transcriptional regulation network of Escherichia coli. Nat. Genet. 2002;31:64–68. doi: 10.1038/ng881. 10.1038/ng881 [DOI] [PubMed] [Google Scholar]
- Strachan T, Read A.P. 2nd edn. Wiley; New York: 1999. Human molecular genetics. [Google Scholar]
- Swain P.S, Elowitz M.B, Siggia E.D. Intrinsic and extrinsic contributions to stochasticity in gene expression. Proc. Natl Acad. Sci. USA. 2002;99:12 795–12 800. doi: 10.1073/pnas.162041399. 10.1073/pnas.162041399 [DOI] [PMC free article] [PubMed] [Google Scholar]
- Takeda K, Kaisho T, Akira S. Toll-like receptors. Annu. Rev. Immunol. 2003;21:335–376. doi: 10.1146/annurev.immunol.21.120601.141126. 10.1146/annurev.immunol.21.120601.141126 [DOI] [PubMed] [Google Scholar]
- Vilar J.M, Guet C.C, Leibler S. Modeling network dynamics: the lac operon, a case study. J. Cell Biol. 2003;161:471–476. doi: 10.1083/jcb.200301125. 10.1083/jcb.200301125 [DOI] [PMC free article] [PubMed] [Google Scholar]
- Wang Y, Liu C.L, Storey J.D, Tibshirani R.J, Hershlag D, Brown P.O. Precision and functional specificity in mRNA decay. Proc. Natl Acad. Sci. USA. 2002;99:5860–5865. doi: 10.1073/pnas.092538799. 10.1073/pnas.092538799 [DOI] [PMC free article] [PubMed] [Google Scholar]
- Yamamoto M, et al. Essential role for TIRAP in activation of the signalling cascade shared by TLR2 and TLR4. Nature. 2002;420:324–329. doi: 10.1038/nature01182. 10.1038/nature01182 [DOI] [PubMed] [Google Scholar]
- Yamamoto M, Sato S, Hemmi H, Uematsu S, Hoshino K, Kaisho T, Takeuchi O, Takeda K, Akira S. TRAM is specifically involved in the Toll-like receptor 4-mediated MyD88-independent signaling pathway. Nat. Immunol. 2003;4:1144–1150. doi: 10.1038/ni986. 10.1038/ni986 [DOI] [PubMed] [Google Scholar]
- Yang E, van Nimwegen E, Zavolan M, Rajewsky N, Schroeder M, Magnasco M, Darnell J.E. Decay rates of human mRNAs: correlation with functional characteristics and sequence attributes. Genome Res. 2003;13:1863–1872. doi: 10.1101/gr.1272403. 10.1101/gr.997703 [DOI] [PMC free article] [PubMed] [Google Scholar]
Associated Data
This section collects any data citations, data availability statements, or supplementary materials included in this article.
Supplementary Materials
This Electronic Appendix contains seven “.dizzy” files, that together can be used in the Dizzy simulation software program (http://labs.systemsbiology.net/bolouri/software/Dizzy). These Dizzy model files represent a model of a single gene in four different organisms: bacteria (Escherichia coli), yeast (Saccharomyces cerevisiate), sea urchin embryonic cell (Strongylocentrotus purpuratus), and human macrophage. The two files that are loaded directly into Dizzy are “eukaryoteSingleGene.dizzy” and “prokaryoteSingleGene.dizzy”. The eukaryoteSingleGene model definition file loads an organism-specific parameter file (yeast.dizzy, seaurchin.dizzy, or macrophage.dizzy) using an “include” statement. By choosing which include statement to uncomment (lines 27–29 of that file), you can select which organism to simulate. The prokaryoteSingleGene file loads its parameters from the bacteria.dizzy file. If there are any questions about this material, please contact Stephen Ramsey (sramsey@systemsbiology.org).


