Abstract
Solar ultraviolet radiation creates an ozone layer in the atmosphere which in turn completely absorbs the most energetic fraction of this radiation. This process both warms the air, creating the stratosphere between 15 and 50 km altitude, and protects the biological activities at the Earth's surface from this damaging radiation. In the last half-century, the chemical mechanisms operating within the ozone layer have been shown to include very efficient catalytic chain reactions involving the chemical species HO, HO2, NO, NO2, Cl and ClO. The NOX and ClOX chains involve the emission at Earth's surface of stable molecules in very low concentration (N2O, CCl2F2, CCl3F, etc.) which wander in the atmosphere for as long as a century before absorbing ultraviolet radiation and decomposing to create NO and Cl in the middle of the stratospheric ozone layer. The growing emissions of synthetic chlorofluorocarbon molecules cause a significant diminution in the ozone content of the stratosphere, with the result that more solar ultraviolet-B radiation (290–320 nm wavelength) reaches the surface. This ozone loss occurs in the temperate zone latitudes in all seasons, and especially drastically since the early 1980s in the south polar springtime—the ‘Antarctic ozone hole’. The chemical reactions causing this ozone depletion are primarily based on atomic Cl and ClO, the product of its reaction with ozone. The further manufacture of chlorofluorocarbons has been banned by the 1992 revisions of the 1987 Montreal Protocol of the United Nations. Atmospheric measurements have confirmed that the Protocol has been very successful in reducing further emissions of these molecules. Recovery of the stratosphere to the ozone conditions of the 1950s will occur slowly over the rest of the twenty-first century because of the long lifetime of the precursor molecules.
Keywords: chlorofluorocarbons, ozone depletion, stratosphere, ultraviolet, Montreal Protocol, Antarctic ozone hole
1. Introduction
Homer speaks of lightning bolts after which ‘a grim reek of sulphur bursts forth’ and the air was ‘filled with reeking brimstone.’ (Homer 3000 BC). The odour was not actually the smell of sulphur dioxide associated with burning sulphur, but rather was the first recorded detection of the presence in Earth's atmosphere of another strong odour, that of ozone (O3). These molecules were formed by the passage of the lightning through the air, created by the splitting in two of the abundant molecular oxygen (O2) molecules, followed by the addition of each of the free O atoms to another O2 to form the triatomic product. In fact, most of the ozone molecules present in the atmosphere at any time have been made by this same two-step splitting-plus-combination process, although the initiating cause usually begins with very energetic solar ultraviolet (UV) radiation rather than lightning. Many thousands of years later, the modern history of ozone began with its synthesis in the laboratory of H. F. Schönbein in 1840 (Nolte 1999), although the positive confirmation of its three-oxygen-atom chemical formula came along somewhat later.
Scientific interest in high-altitude stratospheric ozone dates to 1881 when Hartley measured the spectrum of ozone in the laboratory and found that its ability to absorb UV light extended only to 293 nm at the long wavelength end (Hartley 1881a). He then connected this result with the earlier field observations (Cornu 1879) that there was a short wavelength cut-off in solar UV radiation at 293 nm. Hartley concluded that this limitation on solar UV arriving at Earth's surface was caused by the ubiquitous presence of some absorbing substance in the atmosphere, and the match between these two cut-offs identified ozone as the molecule involved (Hartley 1881b). Cornu's field work had been carried out at three different mountain altitudes, and his experiments showed that the solar cut-off was slightly less effective—a little less ozone—at higher altitudes (293.2 nm at 2570 m; 294.8 nm at 1650 m; 295.4 nm at 660 m). From the very small changes in cut-off wavelength with altitude—about 20% of the total atmosphere lies between 660 and 2570 m—Hartley further reasoned that ozone was not distributed uniformly through the atmosphere, but rather that most of it was at altitudes higher than 2570 m. These measurements were all made in the lowest part of the atmosphere, the troposphere,1 and the structure of the atmosphere at much higher altitudes was not yet fully understood in Hartley's time. However, the groundwork had been laid for our present understanding that most of the atmospheric ozone lies far overhead in the stratosphere.
Detailed knowledge of the Earth's atmospheric ozone distribution seasonally and geographically was outlined beginning in the 1920s by a series of experimenters, especially G. M. B. Dobson, who began regular measurements with an UV spectrometer—an improved version of Hartley's measurement technique. Dobson realized that careful measurements of the relative intensities of solar UV radiation at different wavelengths could be converted into quantitative estimates of the amount of ozone overhead, and his initial work near Oxford established that the amount of ozone varied from day to day and month to month. The Dobson UV-spectrometer, adapted into an instrument suitable for daily measurements in remote locations by trained technicians, became a standard instrument applied by many other scientists. With such instruments operating in various distant locations and monitored throughout the year, the global distribution of ozone was quantified in the next decades, as shown in figure 1 for four different locations (Rowland 1991)2. Tropical locations, such as Huancayo in Peru, were found to have approximately the same amount of ozone overhead year-round. Higher ozone concentrations were measured throughout the year in the temperate latitudes than in the tropics, but with a strong seasonal variation superimposed. The peak ozone values in the temperate zones in both north and south occur at the end of winter—the further north the station from Arosa to Leningrad, the higher the maximum ozone concentration. Spitzbergen (78° N) recorded the highest ozone concentrations of all, again maximizing early in the spring. No measurements were made in the south Polar region until the preliminary stages in preparation for the International Geophysical Year of 1957–1958.
Figure 1.
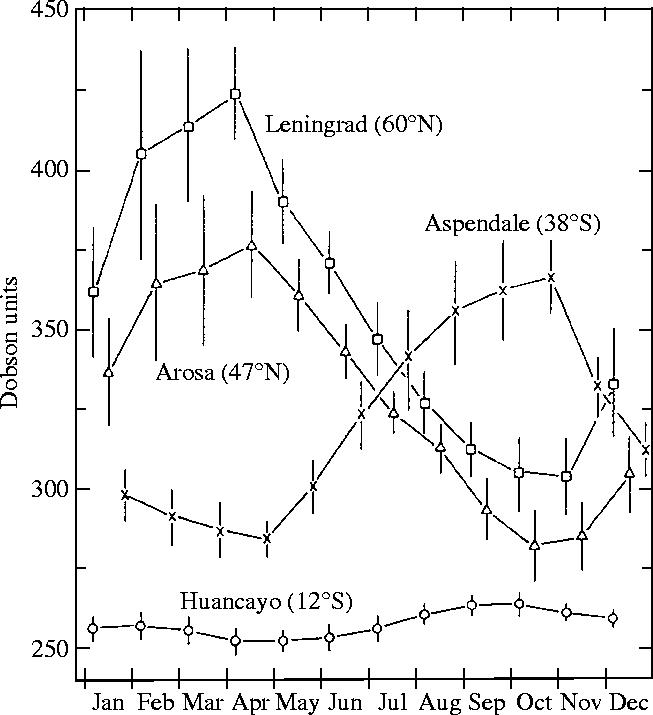
Seasonal and latitudinal variations of atmospheric ozone (Rowland 1991).
2. Solar spectrum
The radiation from the sun has wavelengths visible to humans from violet (400 nm) to red (700 nm), plus invisible infrared (>700 nm) and UV (<400 nm) wavelengths. The energy of the radiation increases as the wavelengths shorten, and the absorption of highly energetic UV radiation usually causes the decomposition of simple atmospheric molecules. In the upper atmosphere, the UV wavelengths below 242 nm can be absorbed by O2 (figure 2), initiating the sequence of reactions of equations (2.1)–(2.3).
| (2.1) |
| (2.2) |
| (2.3) |
The O3 molecules formed in (2.2) can in turn absorb visible UV radiation, as in (2.3), with absorption increasing greatly in strength at shorter wavelengths in the UV. Through these processes, plus others discussed later, a balance of ozone is maintained by which an average of three parts in 107 of all of the atmospheric molecules are present as ozone, versus 21% as O2. About 90% of these ozone molecules are present at altitudes between 10 and 50 km, i.e. mostly in the stratosphere where the mixing ratio of O3, its fraction of all atmospheric molecules, can rise as high as one part in 105. (For comparison, the regulatory control mechanisms in urban surface locations typically become applicable when the O3 mixing ratios exceed one part in 107.)
Figure 2.
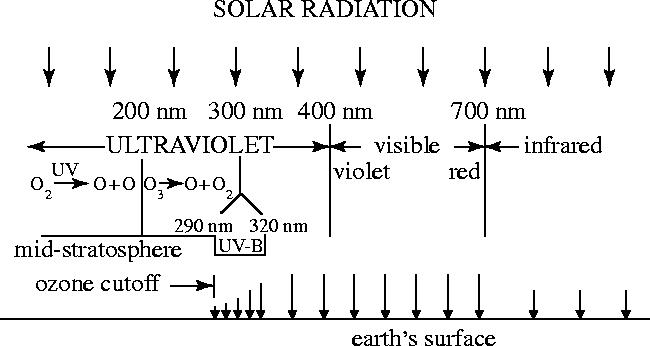
Schematic of vertical distribution of chlorine from methyl chloride.
Because both O2 and O3 can absorb short wavelength UV radiation, no solar radiation with wavelengths less than 290 nm (the ‘ozone cut-off’ for instruments more sensitive than Cornu's) penetrates below the stratosphere. The solar UV energy absorbed in (2.3) is converted into heat by processes such as energy transfer to M in (2.2), providing a thermal source in the 30–50 km range. This influx of heat creates the stratosphere, and is responsible for maintaining its positive temperature gradient versus altitude. This increase in temperature with increasing altitude creates a very stable, stratified atmospheric regime with a very slow turnover time of several years. The ozone layer thus performs two important physical processes: (i) it prevents the arrival at Earth's surface—and its exposed biology—of short wavelength UV radiation less than 290 nm and (ii) changes this UV energy into heat, necessary for the continued existence of the stratosphere.
3. Chapman reactions for ozone formation
The logical source for this atmospheric ozone was the short wavelength UV photolysis of molecular oxygen by equation (2.1), followed by combination of atomic oxygen with another O2, as shown in equation (2.2). But why did the amounts of ozone not continue to increase from reactions (2.1) to (2.3) if there existed no other removal reaction for O atoms but reaction (2.2)—which was not a permanent removal? Why was the concentration of stratospheric ozone not highest in the tropics, where the solar radiation was most intense? Also, why were the highest ozone concentrations of all found above Spitzbergen, Norway, in polar air masses, which had just emerged from several months of total darkness? In 1930 Chapman provided a successful qualitative explanation for this unexpected latitudinal and seasonal distribution of ozone by completing the sequence with reaction (3.1) (Chapman 1930). This provided the crucial step for closure by explaining that O3 returned back to O2 by intercepting some of the O atoms also released by exposure to sunlight.
| (3.1) |
With both the formation and destruction processes for ozone driven by sunlight and located predominantly in the upper stratosphere of thetropics, the ozone geographical distribution must have a more complicated explanation. The amounts of ozone found everywhere then depend upon a complex interplay between the molecular transformations of the chemical species and meteorological transport of these reactants to other altitudes and latitudes. But, semi-quantitatively, the chemical origin, the high-latitude location and spring equinox timing of the ozone maxima had been rationalized.
Quantitative limitations still existed in calculations of the total global ozone burden for several reasons, including lack of precision measurements of (i) the kinetic reaction rates for (2.1) to (3.1), (ii) solar UV spectra and intensities in the higher levels of Earth's atmosphere and beyond and (iii) knowledge of the global meteorological transport patterns in the stratosphere. During the ensuing 30 years with rapidly improving kinetic measurements and especially with early rocket and balloon-based and eventually satellite observations of the radiation from the unshielded sun, Chapman's four ‘oxygen’ reactions nevertheless still provided a satisfactory explanation for the origin, magnitude and distribution of atmospheric ozone.
4. Free radical reactions for ozone removal
The modern era of stratospheric ozone studies began in the 1950s with proposals that the detailed ozone source and sink—i.e. removal processes—calculations might not be in balance. Rocket experiments were well under way, and extensive data was now available for the upper reaches of the atmosphere and for outer space. Too, the equipment for studies of chemical kinetics had improved greatly. The conclusion began to be formed: less ozone, perhaps by a factor of two, was actually present in the atmosphere than would be expected if the Chapman reactions were the only significant contributors to its creation and removal. Because the formation reactions for ozone seemed solidly based, the ‘missing’ factor was more likely that some additional removal process must exist for ozone (Dütsch 1970).
In the mid-1960s the first choice for the missing sink fell on a free radical catalytic chain initiated by HO radicals in reactions (4.1) and (4.2), using hydrogen atoms brought into the stratosphere as water vapour (Bates & Nicolet 1950).
| (4.1) |
| (4.2) |
The two reactions together sum to the equivalent of equation (3.1) and are frequently designated as the HOX catalytic chain. The chain is catalytic because the HO radical used up in reaction (4.1) is regenerated in reaction (4.2), and the sequence can be repeated over and over until some other reaction intervenes for either HO or HO2.
However, with further measurement of the rates for these reactions, this proposal by itself was clearly insufficient to close the gap between the calculated production and destruction rates for ozone, largely because the HOX reaction sequence was most significant at the top of the stratosphere, above the altitudes where most of the ozone is found. The discussion had, however, expanded the scientific thinking beyond the Chapman reactions, and had brought free radical reactions into the picture. In the present understanding, ozone sources and sinks are balanced with the additional chemistry of a series of free radical catalytic chains involving species containing not only hydrogen, but also nitrogen and chlorine. The defining characteristic of these free radicals is that each is an electrically neutral chemical species possessing an odd number of electrons—e.g. for HO nine, and HO2 17. The far more abundant stable chemical molecules—in the atmosphere, and elsewhere as well—such as oxygen, nitrogen, carbon dioxide, methane, etc.—all have an even number of electrons.
The odd-electron species are chemically reactive because they can achieve even-number stability by collecting another electron. But when they find that next electron, its source is usually an even-electron molecule, as illustrated in both reactions (4.1) and (4.2). The overall reaction then does not reduce the number of free radicals, but rather just changes its identity, as from HO to HO2 in equation (4.1) and back again in (4.2). In the atmosphere, with the overall ratio of odd-electron to even-electron molecules running 1 to 108 or more, radical collisions with other radicals are quite rare. Nonetheless, they are still very important because only in the radical–radical reactions is it possible for the chain reactions to be terminated. When the succession of free radical reactions steadily converts some chemicals to other forms, as with O3+O→O2+O2 from equation (4.1) and (4.2) without removing the HOX radicals, the catalytic chain can remove many thousands of molecules for each initial radical formed.
This HOX chain plus two other chain reactions are the most important in the present-day atmosphere, although a number of others exist. These other two most important chains involve chemical species containing nitrogen or chlorine, as in the NOX reactions (4.3) and (4.4) and the ClOX reactions of (4.5) and (4.6).
| (4.3) |
| (4.4) |
| (4.5) |
| (4.6) |
Again, the sum of each of these pairs of reactions is the equivalent of reaction (3.1). Cumulatively, the addition of free radical chain reactions (4.1) to (4.6) to the original Chapman oxygen reactions can bring the calculated global ozone quantities in the atmosphere into agreement with the actual measured amounts.
Most descriptions of ozone production and loss are described in terms of ‘odd oxygen’ (i.e. the summed concentrations of O3 plus O) in contrast to the very abundant ‘even’ oxygen O2. For example, the photochemical destruction of O3 in equation (2.3) does not result in permanent ozone removal because, as is usually the case, the O atom immediately re-forms O3 in reaction (2.2). In this odd oxygen calculus, equations (2.2) and (2.3) have values of zero, equation (2.1) has +2, equation (3.1) has the value −2, and equations (4.1)–(4.6) each have the value of −1. The overall removal of ozone can thus be considered to be the steady conversion of odd oxygen back to even oxygen.
5. Reservoir molecules and human activities
The inclusion of catalytic chain reactions in the ozone balance requires description of the initial sources of the chain carriers, and the possibility for either temporary or permanent interruption of the chains by the formation of reservoir compounds from the interactions of radicals from two separate chains (e.g. 2 HO+M→H2O2+M; ClO+NO2+M→ClONO2+M). In both of these cases, the energy released in the formation of a chemical bond joining the two radicals must be carried away by collision with another molecule, and this third participant is generally designated as M because collision with almost any molecule can accept this transfer of excess energy. Some reservoirs are only temporary, usually because they are readily photodecomposed by solar UV radiation. Occasionally, the reservoirs are unreactive enough to become permanent repositories for the chain carriers. Furthermore, the realization over the last three decades that some of the sources for the chain carriers have been substantially augmented by human activities raised major concerns about the possibilities that significant ozone depletion might occur in the near future (Crutzen 1971; Johnston 1971; Molina & Rowland 1974).
The major method for introducing chain-carrying chemical species into the stratosphere is the release into the troposphere of chemical compounds sufficiently inert that a significant fraction of them survive to drift into the much more intense solar UV radiation of the mid-stratosphere, which can break the molecule apart into a pair of free radicals. An important aspect of ‘inertness’ is the necessity that the molecule be transparent to solar radiation with wavelengths longer than the ozone cut-off at 290 nm—otherwise, destruction would quickly occur within the daylight troposphere. The greatly increased photochemical susceptibility of these unreactive molecules at altitudes of 30 km or higher is necessarily preceded by atmospheric mixing to altitudes above most of the O2 and O3 that absorb solar UV by equations (2.1) and especially (2.3).
A second method for delivering chain carriers to stratospheric altitudes is direct injection. Large volcanic eruptions can introduce other volatile molecules when the explosive plume rises all of the way into the stratosphere, but experimental study of actual events has shown that no more than a small fraction of chain precursors are started through this process. Most volcanic eruption plumes do not reach the stratosphere, and the gaseous content of water-soluble molecules such as hydrogen chloride (HCl) is greatly reduced by dissolution into the water droplets raining back as the plume cools. Alternatively, direct chemical formation of NO can be accomplished in the stratosphere by raising the natural air mixture of N2+O2 to an extremely high temperature as occurs in the fireball of an atmospheric nuclear weapons test (Bauer 1979; Chang et al. 1979), or through the engine of a high-flying aircraft such as the Anglo-French Concorde (NAS 1975).
At the beginning of the twentieth century, sources had already existed in the natural atmosphere for aeons that serve as precursors for the delivery of HO, NO and Cl into the stratosphere, although most of the unreactive precursors had not yet been identified as atmospheric components, and none of the chain processes had been discovered until the latter half of the century. Entrance to the stratosphere is essentially limited meteorologically to large air masses that rise in deep convection in the tropics and pass through the cold trap (usually about −78 °C) of the tropical tropopause, the temperature minimum separating the stratosphere from the troposphere below. Water vapour has always been one of the primary molecules delivering hydrogen into the stratosphere, where transformation to HO occurs. At the tropopause, the water content of the air passing upward is limited to about 3 p.p.m.3—that is, very dry in comparison with amounts up to 3 parts per hundred near the surface in the tropics. These rising air masses also transport many other trace gaseous molecules without regard to their molecular weights—the gravitational separation of atmospheric components by molecular diffusion is overwhelmed by small-scale turbulence and large convective motions to altitudes of 100 km or more, far above the 50 km top of the stratosphere.
These tropical storms will also carry upward trace gases in the troposphere with low enough boiling points that they too are able to pass through the cold trap at the tropopause. These include hydrogen delivery while chemically bound in methane (CH4) or molecular hydrogen (H2), nitrogen atoms (for the NO radical) in nitrous oxide (N2O), and chlorine atoms in methyl chloride (CH3Cl). The definite detections in the remote atmosphere of methane at about 1 p.p.m. (Migeotte 1949) and nitrous oxide at 0.3 p.p.m. (Adel 1949) were not established until 1948 and 1937, respectively. Methyl chloride at about 0.6 p.p.b. was not even recognized as a regular atmospheric component until concerns had already been expressed about chlorine in the gaseous chlorofluorocarbon (CFC) compounds (Rowland & Molina 1975). The possibility that the atmospheric concentrations of several of these precursor molecules might be increasing because of the activities of mankind was not recognized until the 1970s.
Both methane and methyl chloride have sinks in the lower atmosphere through reaction with HO radical, as in equations (5.1) and (5.2). Most of these molecules are destroyed in the lower atmosphere with lifetimes of about 8 years for methane, and 1.3 years for methyl chloride (WMO 2003).
| (5.1) |
| (5.2) |
Nevertheless, their abundance is large enough and tropospheric mixing occurs on a time scale of months so that appreciable concentrations exist in the upper troposphere in tropical latitudes, and are swept into the stratosphere. Both chemical compounds are still subject to HO attack in the stratosphere and eventually release Cl atoms and additional HO there.
The measured tropospheric concentrations of CH3Cl are now approximately 550 p.p.t., with a small seasonal effect with lower concentrations in the summer for both the Northern and Southern Hemispheres (WMO 2003). The currently available data suggest that the stratospheric mixing ratio of Cl summed over all chemical species present a century ago—before large-scale industrial synthesis of volatile chlorinated compounds—was not much larger than that furnished by CH3Cl alone (i.e. <600 p.p.t.). Measurement of the amounts of methyl chloride in glacial ice cores does indicate that its atmospheric concentration in the nineteenth century was probably slightly less than now, perhaps 450–500 p.p.t. (WMO 2003). One important source of CH3Cl is the burning of forests or agricultural waste (‘biomass burning’); the former was always part of our natural surroundings even in prehistoric times, while the latter has probably grown in intensity in the past two centuries.
Because gaseous mixing in the stratosphere is not affected by changes in chemical form, the mixing ratio (or mole fraction in chemical terminology), of all forms of chlorine resulting from CH3Cl and its decomposition products will be essentially constant throughout the atmosphere from the surface to 50 km and above, as shown schematically in figure 3. Although the chemical form of the Cl is initially CH3Cl in the troposphere, smaller and smaller fractions survive intact to higher altitudes, and the released Cl fraction is distributed among the available forms of inorganic chlorine— chiefly the chain components, Cl and ClO, and the temporary reservoirs HCl, ClONO2, and HOCl. Redistribution of Cl among these compounds is controlled by the various chemical and photochemical reactions that affect these molecules at each altitude (WMO 2003). The lower temperatures of the stratosphere, as low as −67 °C at 20 km in temperate latitudes and −90 °C at polar latitudes, strongly affect the rates of some of the chemical reactions (JPL 2003). However, the intensity of energetic solar UV radiation becomes rapidly greater at higher altitudes with more and more of the O2 and O3 molecules now beneath. Both HOCl and ClONO2 have significant absorption cross-sections at wavelengths longer than 293 nm (JPL 2003) and are subject to solar photodecomposition throughout the atmosphere, albeit more intensively at higher altitudes.
Figure 3.
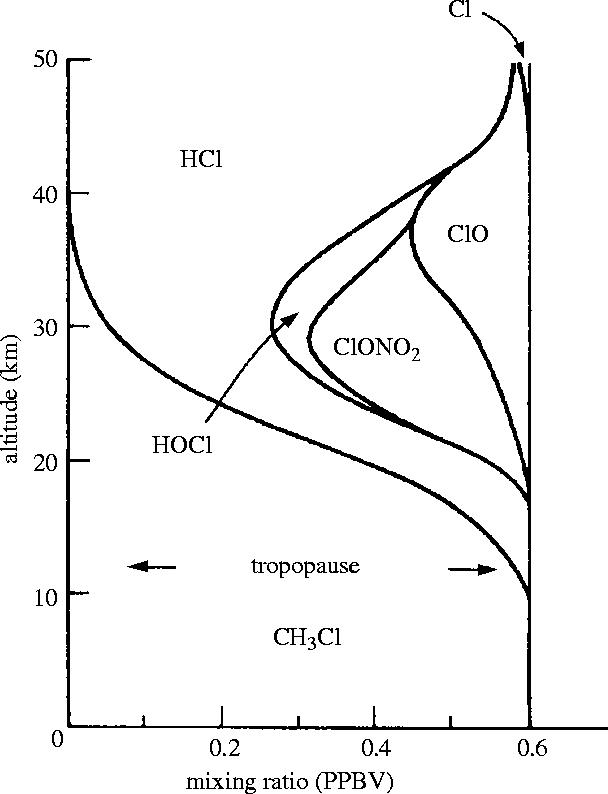
Schematic of vertical distribution of chlorine from methyl chloride.
The total amount of hydrogen in the stratosphere is essentially the amount summed over all of the gaseous chemical species penetrating through the tropopause, i.e. essentially H2O plus CH4 plus H2. The mixing ratio of CH4 at the 50 km level (the top of the stratosphere) is only about one-eighth the value at the tropopause, with the remaining seven-eighths already oxidized and largely converted to H2O. Satellite simultaneous measurements of the concentrations of both CH4 and H2O in the stratosphere have confirmed that the sum of hydrogen present is nearly constant for all stratospheric latitudes and altitudes (Jones et al. 1986) at 12–13 p.p.m. (e.g. 3 p.p.m. H2O×2 H atoms/molecule plus 1.5 p.p.m. CH4×4 H atoms/molecule plus 0.5 p.p.m. H2×2 atoms/molecule.) The contribution of hydrogen from CH3Cl with 3 H atoms per molecule×0.00055 p.p.m. is a negligible 0.002 p.p.m. Molecular H2O is much more stable in the stratosphere than either CH4 or CH3Cl, with the consequence that only a minor fraction of the hydrogen is present in the free radical forms HO and HO2, or more reactive reservoir compounds such as nitric acid (HONO2), hypochlorous acid (HOCl) or hydrogen peroxide (H2O2).
Unlike methyl chloride, the measurements of the past 20 years have clearly shown that the tropospheric concentrations of methane have been increasing on a global scale (figure 4), from about 1.52 p.p.m. in 1978 to 1.78 p.p.m. in 2003 (Blake & Rowland 1988; Dlugokencky et al. 1998; Simpson et al. 2002 plus additional data). A corollary consequence is that the amounts of hydrogen transported into the stratosphere have also been steadily increasing. If H2O content penetrating upward through the tropical tropopause has remained constant at an average of about 3 p.p.m., then the observed change in methane would raise total H from 13.1 p.p.m.v. in 1978 to 14.1 p.p.m.v. in 2004. Measurements of methane in glacial ice cores have established that the atmospheric CH4 level was about 0.75 p.p.m. in 1800 (Etheridge et al. 1998), and as low as 0.35 p.p.m. 20 000 years ago during the coldest part of the last ice age. In fact, the measured CH4 concentration in the atmosphere has not exceeded 0.8 p.p.m. in the past 420 000 years (Chappelaz et al. 1990) until the increases of the past 200 years. Thus, the total delivery of hydrogen to the stratosphere has increased by 50% to its present level from about 9 p.p.m. two centuries ago. This conclusion depends implicitly on the plausible assumption, untestable in the absence of any pertinent data, that the average temperature of the tropical tropopause—and thereby control of the freeze-drying of air entering the stratosphere—has remained unchanged during that period.
Figure 4.
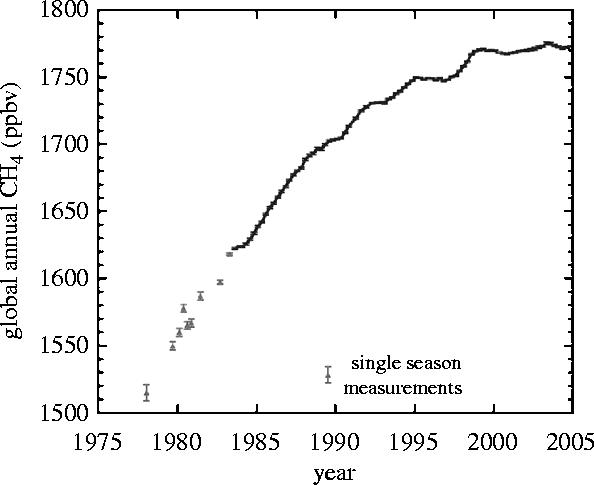
Moving average of four successive seasonal measurements. (Simpson et al. 2002 plus unpublished data.)
The extent to which this doubling in CH4 concentrations over the past 200 years is anthropogenic in origin has some quantitative uncertainty, but all of the major biological CH4 emission sources (cattle, rice paddies, swamps) and the non-biological sources associated with fossil fuels have been perturbed by mankind during the past two centuries (Cicerone & Oremland 1988). An increase in total hydrogen in the stratosphere then impacts directly on the ambient ozone concentrations through altered levels of HO and HO2, and indirectly from the likely increase with more water vapour present in both frequency of formation and total volume of clouds in the stratosphere. The role of polar stratospheric clouds (PSCs) in stratospheric ozone depletion in the Antarctic polar vortex is particularly important, as discussed later.
Direct emission of the NOX free radicals into the troposphere, or formation there by the action of lightning, have little effect on the stratosphere, because rainout removes oxygen-bonded N from the atmosphere as nitric acid or in other water-soluble chemical forms. The major source of NO and NO2 in the stratosphere is N2O emitted at the surface, as first recognized by Crutzen (1970). This concept of important stratospheric free radical concentrations supported by trace gas precursors in the troposphere brought a new emphasis on both the complications of stratospheric chemistry and realization of the potential importance of compounds released by mankind in vanishingly small quantities.
The state of atmospheric knowledge at the end of the 1960s is well illustrated by the published scientific papers from the 1969 International Symposium in Heidelberg on atmospheric trace constituents and atmospheric circulation. At this symposium, Dütsch used 17 chemical reactions and eight chemical species, involving only atoms of H and O (O, O2, O3, H, HO, HO2, H2O and H2O2) to describe stratospheric chemistry. The state of current chemical understanding by the atmospheric scientific community is underscored by his added comment that these were the ‘only reactions that are of importance under stratospheric conditions’ (Dütsch 1970). In the same symposium, the problems of measurement of N2O in the troposphere are discussed in some detail, with a conclusion that a calculated atmospheric lifetime of 70 years is possible, if the limiting factor is photochemical destruction in the stratosphere. However, the uncertainties were emphasized: ‘seasonal variations and other observations seem to indicate shorter atmospheric lifetimes, however, suggesting additional destruction processes’ (Schütz et al. 1970). Our present knowledge, however, indicates that N2O has no significant tropospheric sink and an average lifetime in the atmosphere of 120 years (WMO 2003). Its most important sources are microbiological activity in the soil and the oceans, resulting from side pathways during the creation of N2 from the nitrification of NH3 or the denitrification of NO3−. In the stratosphere, N2O can be destroyed either by direct photolysis, as in equation (5.3) or by reaction with electronically excited O(1D) atoms in equation (5.4). Approximately 90% of N2O removal occurs by photolysis, so that most N atoms delivered to the stratosphere as N2O are converted directly into inert N2.
| (5.3) |
| (5.4) |
The lesser pathway for N2O by equation (5.4) is nevertheless quite important because it is the major source of stratospheric NOX. The electronically excited O(1D) atoms needed for reaction (5.4) in both the troposphere and the stratosphere are formed by equation (5.5) when initiated by UV radiation with wavelengths shorter than 314 nm. The reaction of O(1D) with H2O vapour in the atmosphere by equation (5.6) is the ultimate source for hydroxyl radical, HO, the primary oxidant for CH4, CH3Cl and many other trace compounds introduced into the atmosphere.
| (5.5) |
| (5.6) |
6. Anthropogenic increases in precursor concentrations
The natural transport to the stratosphere of H2O, CH4, N2O and CH3Cl established a complex chemistry that regulated the concentrations of ozone and a substantial number of reservoir compounds formed by the chain-terminating combination reactions of the various free radical chain carriers: HONO2, HO2NO2, N2O5, H2O2, HCl, ClONO2, HOCl, ClOOCl. As the concentrations of stable precursors increase in the troposphere, more molecules are caught in the tropical updrafts into the stratosphere and the release of the corresponding free radicals responds quickly to these alterations in their support base. The global average concentration of N2O has been increasing recently at a rate of 0.2% per year (WMO 2003) to a 2003 value of 317 p.p.b. Again, ice core studies have shown that the atmospheric concentration of N2O was relatively stable from AD 1000 to AD 1800 at 275 p.p.b., with a progressive rise over the past two centuries (WMO 2003). Several potential causes for this increase have been postulated, including combustion of fossil fuel and the increased use of nitrogenous fertilizers in agriculture. However, detailed quantitative evaluation of such sources has remained difficult. This slow rate of increase but with a long lifetime means that the new sources are now larger than the removal processes by 25% or more.
7. Chlorofluorocarbon compounds
During the last 30 years, the most striking increases in stratospheric free radical concentrations have been those associated with the ClOX chains because of the rapid, widespread increase in global usage of volatile synthetic organochlorine compounds. The starting point for the emphasis in our research group on these molecules was my learning in 1972 of the detection by Lovelock of the ubiquitous atmospheric presence of the synthetic molecule CCl3F (Lovelock et al. 1973), a substance for which no natural sources have been found. Lovelock had earlier invented an extremely sensitive detection system employing electron capture (EC) by trace impurities, and attached it to the column of effluent gases from a gas chromatograph (GC), a device which very efficiently separates a mixture of its gases into its individual components. This EC/GC apparatus increased the sensitivity of measurement for some compounds by a factor of one million, and opened the path for studying important atmospheric chemistry for substances with concentrations less than 10 p.p.b.—often very much less. Lovelock initially established that CCl3F was always detectable in the atmosphere near his home in western Ireland, even when the winds came in from the Atlantic. He then showed that CCl3F was also present in all of the air samples taken during the 1971 voyage of the R. V. Shackleton from England to Antarctica, as graphed in figure 5. The 40–70 p.p.t. quantities found in Earth's troposphere were roughly comparable to the total amount manufactured up to that date, indicating both that most of this material had escaped into the atmosphere, and that it had at least a moderately long atmospheric lifetime. The EC/GC instrument is especially sensitive for CCl3F, as well as for many other similar molecules in this CFC class, i.e. molecules which contain only atoms of carbon, chlorine and fluorine. It is not particularly sensitive for CH3Cl, but the interest in CFCs brought quick attention and detection to other organochlorine compounds.
Figure 5.
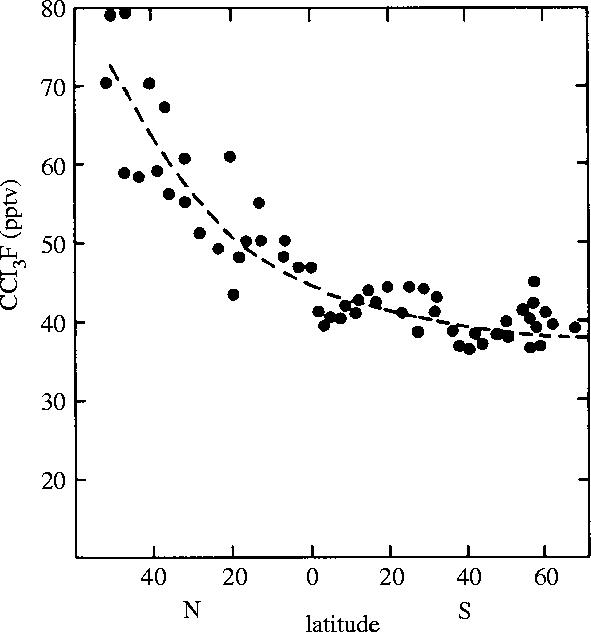
Latitudinal distribution of CCl3F in surface air 1971 (Lovelock et al. 1973).
The appearance in the atmosphere of a new, man-made molecule provided a scientific chemical challenge. Was enough known about the physicochemical behaviour under atmospheric conditions of molecules such as CCl3F to allow prediction of its fate, once released into the environment? In 1973, my research had already been sponsored for 17 years by the US Atomic Energy Commission, and I added to my yearly A.E.C. renewal submission an additional proposal of a predictive study of the atmospheric chemistry of CCl3F. The A.E.C. agreed to permit this new venture, subject only to the requirement that I shift some of the funding already scheduled for other research in our group.
When Dr Mario Molina joined the research group as a postdoctoral research associate later in 1973, he elected the CFC problem among several offered to him, and we began our scientific search for the ultimate fate of such molecules. At the time, neither of us had any significant experience in treating chemical problems of the atmosphere, and each of us was now operating well away from our previous areas of expertise—his, laser chemistry, and mine, radioactivity.
Concern for the chemistry of the stratosphere had been greatly boosted in the early 1970s by discussions of the potential release of NOX from supersonic aircraft such as the Concorde and the proposed Boeing SST, for each of which a future market for as many as 500 aircraft was contemplated if and when introduced commercially. In 1971 the US congress discontinued support for the Boeing project, but mandated an intensive (1971–1974) Climatic Impact Assessment Program through the US Department of Transportation to explore possible stratospheric consequences of supersonic aircraft flight (CIAP 1975). The concerns arose both because of the great increase in speed—e.g. ‘sonic booms’—and also because normal supersonic flight lies at much higher altitudes, 17–20 km, than used by current commercial jet aircraft. This C.I.A.P. program provided a very large increase in knowledge of the stratosphere, especially about the HOX and NOX chain reactions.
However, essentially none of the stratospheric chlorine chemistry described above for methyl chloride was yet known—chlorinated chemicals had simply not been part of the global tropospheric or stratospheric discussion. The initial concerns for stratospheric chlorine chemistry entered the picture with consideration of the direct release in the stratosphere of HCl during very large volcanic eruptions (Stolarski & Cicerone 1974), and from the first stage rockets (fuelled with chlorine-containing compounds) scheduled for the launches of the US Space Shuttle fleet. They identified the possibility of the ClOX chain of reactions (4.5) and (4.6), and concluded that volcanoes would not be a significant source of stratospheric chlorine. No stratospheric measurements of any chlorine-containing compound were yet available at this time.
Our search for any removal process which might affect CCl3F did not start with the stratosphere, however, but began instead with the kinds of reactions which normally affect molecules released to the atmosphere at the surface of the Earth. Several classes exist of well-established tropospheric sinks—chemical transformation or physical removal processes—in the lower atmosphere. One or more of these are applicable for most chemicals released at ground level, and are illustrated here with several chlorine-containing materials.
Coloured species such as the green molecular chlorine, Cl2, absorb visible solar radiation, and photodissociate afterward into individual atoms, requiring about an hour in sunlight;
Highly polar molecules such as HCl are transparent to solar radiation, but are water soluble and dissolve in raindrops to form hydrochloric acid, and are physically and irreversibly removed from the atmosphere when the drops actually fall, requiring a few months on the average; and
Almost all compounds containing carbon-hydrogen bonds, for example CH3Cl, can be oxidized throughout the oxygen-rich atmosphere, usually by hydroxyl radical with the formation of water, as illustrated earlier in reaction (5.2).
However, CCl3F and the other CFCs such as CCl2F2 and CCl2FCClF24 are transparent to visible solar radiation and to those wavelengths of UV which penetrate to the lower atmosphere; are negligibly soluble in water; and do not react with HO, O2, O3 or other oxidizing agents in the lower atmosphere.
When none of these usual decomposition routes is open, what happens to such long-lived molecules?
All polyatomic compounds are capable of absorbing some UV radiation if the wavelength is short enough. At the 50 km top of the stratosphere, the process is so rapid that a CFC molecule would last at most a few weeks if directly released there. However, CFC molecules in the lower atmosphere are protected against this very energetic UV radiation by its absorption by prior reaction at higher altitudes with O2 or O3. The CCl3F molecule was known from laboratory studies to be able to absorb UV radiation at wavelengths <230 nm. But to encounter such solar radiation the molecule must first drift through the atmosphere to altitudes higher than most of the O2 and O3 molecules—to approximately 30 km altitude, with more than 98% of the atmosphere lying below. In this rarefied air, the CFC molecules are exposed to very short wavelength UV radiation and decompose with the release of Cl atoms, as in equations (7.1) and (7.2).
| (7.1) |
| (7.2) |
In 1974, Molina and I calculated the vertical profile of the mixing ratio to be expected for CCl3F in the stratosphere, using several different sets of eddy diffusion coefficients—the parameter used to simulate latitudinally and longitudinally averaged vertical motions in a one-dimensional (1D) atmospheric model of a three-dimensional world. (These eddy diffusion coefficients had been devised by other modellers to simulate the rocket-observations of the vertical distributions of CH4 and other gases in middle latitudes.) The resulting vertical profiles for CCl3F are all quite similar, as illustrated in figure 6, because the decomposition rate for this molecule escalates very rapidly with increasing altitude in the 20 to 30 km range. With each of these eddy parameters, our estimated average lifetime for CCl3F in the atmosphere was in the range from 40 to 60 years. The lifetimes calculated for the weaker UV absorption of CCl2F2 varied from 75 to 150 years (Rowland & Molina 1975). The answer then to our original scientific question is that the eventual fate of the CFC molecules is photodissociation in the mid-stratosphere around an altitude of 30 km with the release of atomic chlorine, usually after many decades of wandering at lower altitudes. The best current values for the atmospheric lifetimes of these gases still fall within these ranges calculated 30 years ago.
Figure 6.
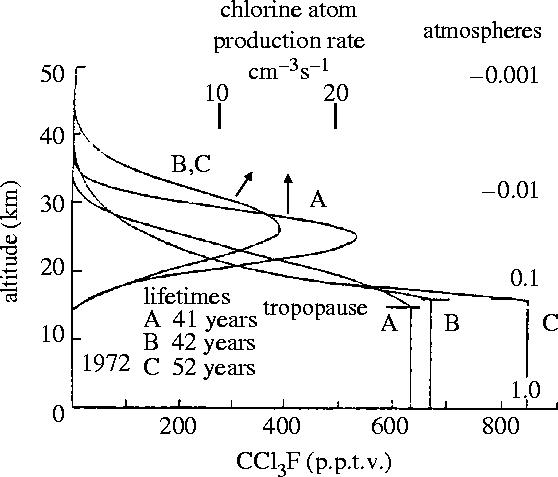
Calculated vertical profile for CCl3F, 30° N (Rowland & Molina 1975).
But what is the fate of these chlorine atoms at an altitude of 30 km?
8. Chlorine chemistry in the stratosphere
The major chemical components of the mid-stratosphere are now well-known, and their reaction rate constants with atomic Cl have been measured in the laboratory many times by many research groups (JPL 2003). By combining these data, the conclusion is readily reached that almost all chlorine atoms react initially with ozone by reaction (4.5), forming another free radical, ClO. This probability is about 1000 times more likely than reaction with methane, as in equation (8.1).
| (8.1) |
The sequential questions of the ultimate sinks, first for CCl3F and then for Cl, have thus been answered, and the question then moves on to the ClO product from reaction (4.5): what happens to this radical at 30 km?
Two important answers appear: reaction with O atoms in (4.6) or with NO in (8.2).
| (8.2) |
The combination of reactions (4.5) and (4.6) completes the ClOX chain reaction equivalent of reaction (3.1), as described earlier. On the other hand, reactions (4.5) plus (8.2) sum to a null effect with no net change in any chemical species—the NO2 product from (8.2) quickly photolyses to release an O atom which then forms O3. The mole fraction of O atoms rises much more rapidly with increasing altitude than for NO, so that the ozone-depleting ClOX chain dominates above 30 km. The HOX chain plays the major role still higher in the upper stratosphere and above.
Reaction (8.1) terminates the ClOX chain entirely, substituting CH3 as the reactive radical instead. If the HCl product were unreactive in the stratosphere, then the number of ozone molecules removed per Cl atom released would average only about 1000 until (8.1) stepped in, and further ozone removal stopped. However, HCl is only a temporary reservoir because it also is reactive with HO radical by reaction (8.3), returning the Cl atom to initiate still another chain. Two other ClOX chain interruptions are also important—the reactions of ClO with NO2 in equation (8.4) to form chlorine nitrate (ClONO2), and with HO2 in equation (8.5) to form hypochlorous acid (HOCl). In both of these cases, the reservoir is only temporary, vulnerable to solar photolysis, releasing the Cl atom to start another chain.
| (8.3) |
| (8.4) |
| (8.5) |
9. Growth in the use of chlorofluorocarbons
The technological characteristics of the CFC class of compounds include (a) inertness under most room temperature conditions; (b) liquid phase accessibility at pressures near one atmosphere; and (c) good solvent characteristics for many impurities. After initial synthesis in 1928 intended for use as the coolant fluid in refrigerators, demand grew steadily, and continued at 10% per year from 1950 to 1975 for uses as varied as propellant gases for aerosol sprays, coolant gases in automobile air conditioners, cleaning solvents for microelectronics, and blowing of polymeric foams.
When Molina and I extrapolated the 1972 emission levels of CCl3F and CCl2F2 many decades into the mid-twenty-first century future in our numerical models, the accumulating atmospheric CFC concentrations reached several parts per billion. Moreover, the reactivity of the ClOX chain equalled or exceeded that of the existing NOX and HOX chains at altitudes of 35–40 km. In these future-looking calculations, the total stratospheric ozone concentrations at equilibrium were diminished by 10% or more, with even larger calculated future ozone losses if the yearly CFC emission levels continued to increase steadily as they had been for the several previous decades (Molina & Rowland 1974; Rowland & Molina 1975). Indeed, this was the likely future for atmospheric chlorine abundance without any of the regulatory controls which eventually came into play (Prather et al. 1996).
Molina and I concluded that the consequences from such future ozone losses were so worrisome that CFC releases to the atmosphere should be discontinued, and recommended that their production and emission should be banned on a worldwide basis. The economic and political aspects of this recommendation are mostly beyond the scope of this scientific discussion. However, one of the responses to our proposal of regulatory action for CFCs was a heightened scientific scepticism with demand for experimental verification of our calculations in the actual atmosphere. Two of the initial questions which arose were: (i) whether the much-heavier-than-air CFCs—the molecular weight of 137 for CCl3F is 4.7 times that of air—could even reach the stratosphere and (ii) whether the consideration of possible tropospheric sinks as described above might have omitted some additional processes which could affect the CFCs on a decadal time scale.
Our original calculations about the behaviour of the CFC species in the stratosphere included predictions of the expected vertical distribution of the CFCs, as shown in figure 6 for CCl3F. The mixing ratio was expected to be nearly uniform throughout the troposphere because of the rapid mixing characteristic of that layer, and then fall off rapidly above the tropopause, effectively reaching zero above an altitude of about 35 km. During 1975, two different research groups sent up high altitude balloons with pay-loads of evacuated spherical containers equipped with pressure-sensitive valves which would open automatically at various stratospheric pressures, and recovered air samples from the stratosphere at different pressure/altitude levels. The mixing ratios for CCl3F measured in 1975 (figure 7) were in excellent agreement (Heidt et al. 1975; Schmeltekopf et al. 1975) with the vertical profiles calculated by us in the previous year. This close fit between theory and experiment demonstrates both that: (i) the CFCs do readily mix upward into the stratosphere and (ii) they are decomposed there by UV radiation at the predicted altitudes.
Figure 7.
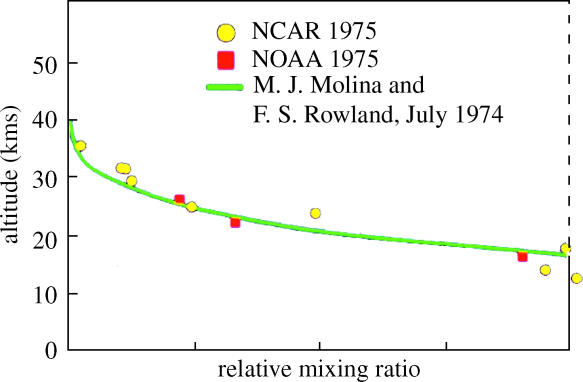
Experimental versus calculated vertical profiles for CCl3F (NCAR, Heidt et al. 1975; NOAA, Schmeltekopf et al. 1975).
Attention then turned to the possibility of undetected tropospheric sinks. The rapid tropospheric removal processes discussed earlier (photolysis, rainout, oxidation) had been readily eliminated. Nevertheless, the 50–100 year estimated lifetimes for the various CFCs left room for the possibility of an accumulation of minor sinks, or even of an unsuspected tropospheric removal process. While laboratory and atmospheric tests can be conducted appropriate to each proposed individual sink, an even more comprehensive approach is the measurement of the sum for all tropospheric processes, including any unknown one not yet specifically identified. This can be accomplished by measurement of the actual lifetime of the CFCs in the atmosphere itself, but this requires accurate knowledge both of the amounts and timing of the release of a particular CFC into the atmosphere and the amounts still there. Because the CFCs are entirely of synthetic origin under controlled manufacturing circumstances, these quantities are known with some precision, and the possibility existed that sufficient accuracy might be attainable for this test.
Measurements of the global burden of nearly inert molecules such as the CFCs require assessment of the concentrations to be found over the entire range of latitudes, especially across the equatorial intertropical convergence zone (ITCZ) which invisibly separates the meteorological patterns of the Northern and Southern Hemispheres. The west–east global mixing processes across longitudinal lines are sufficiently rapid that good estimates can be obtained without representation from all longitudes, so that a set of samples collected over a short time period in remote locations from far north to far south can give an excellent snapshot of the global atmospheric burden. Figure 8 illustrates our latitudinal measurements of CCl3F in 1979 in comparison to Lovelock's data (from figure 5) taken 8 years earlier, while figure 9 displays our latitudinal CCl3F data in 1987 after the passage of another 8 years (Rowland 1991). On this occasion, we were also able to get air samples back from Antarctica, which showed that the concentrations there were essentially the same as in the southern portions of Chile and New Zealand.
Figure 8.
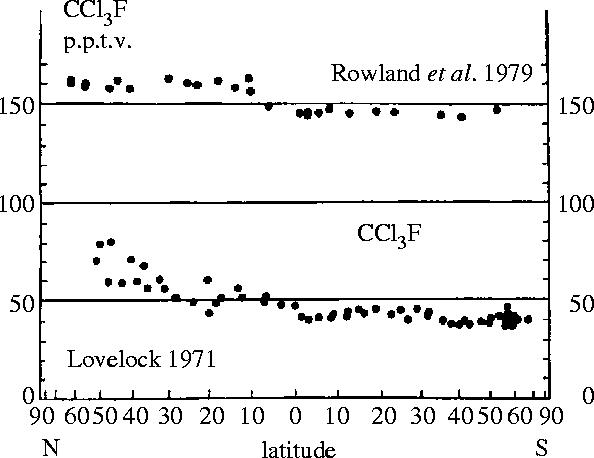
Latitudinal distribution of CCl3F, 1971 and 1979 (Lovelock et al. 1973; Rowland 1991).
Figure 9.
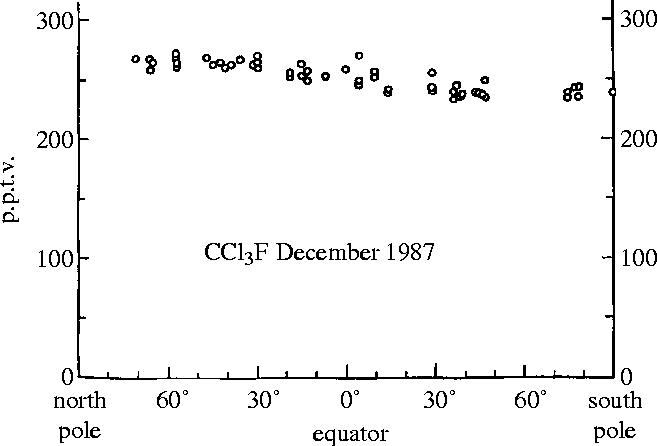
Latitudinal distribution of CCl3F in 1987.
These figures clearly show that the CCl3F concentrations had increased by about 100 p.p.t. in each of these 8 year intervals, accumulating rapidly, as expected for molecules with long atmospheric lifetimes, and even more so because the yearly sources themselves were also growing steadily. A very extensive data set since 1978 with multiple daily automatic measurements at four locations, one in each latitudinal quadrant, has been used for progressively more accurate estimates of the atmospheric lifetimes, now put at 45 years for CCl3F and 100 years for Cl2F2, respectively (Prinn et al. 1987; WMO 2003). Both lifetime estimates are well within our estimated ranges made 30 years ago.
No evidence for a tropospheric sink of even minor quantitative significance has been found for any of the CFCs; all of the related compounds with C–H bonds react with HO in analogues to reaction (5.2) and consequently have significantly shorter atmospheric lifetimes. The water solubility of the CFCs is very low, but not zero, and a very small fraction of the CFCs does go into the oceans. Whether these molecules are ultimately destroyed there, or merely temporarily stored for a few decades is not yet certain. The fate of the CFC compounds really does lie in their solar UV photolysis in the mid-stratosphere.
A typical measurement with our analytical system for the CFCs and other electron-capturing compounds is shown in figure 10 for an air sample collected through an external air intake on a C-130 Hercules aircraft 850 miles south of New Zealand in 1995. Even in this remote location, at least 16 different low molecular weight compounds containing F, Cl or Br atoms—all much heavier than air—are readily detected in a routine measurement.
Figure 10.
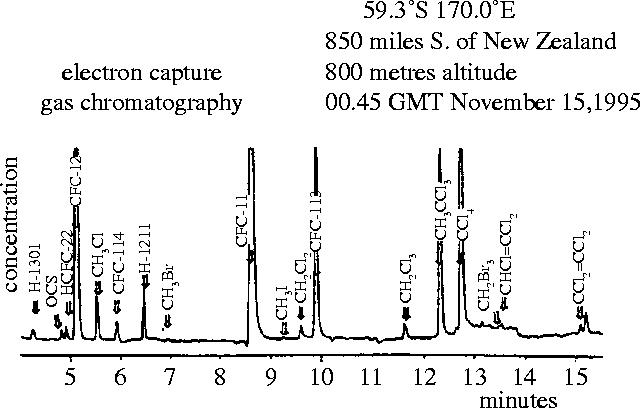
Typical ECGC measurements of chloro and bromo compounds.
10. Springtime loss of ozone in the Antarctic
The greatest surprise in the CFC–ozone story was revealed in the spring of 1985, with the detection by Farman and his colleagues of massive springtime losses of ozone over their British Antarctic Survey station at Halley Bay, Antarctica (75.5° South Latitude; Farman et al. 1985). The B.A.S. established this station at Halley Bay in preparation for the International Geophysical Year of 1957–1958, and equipped it with a standard Dobson UV spectrometer for the measurement of total ozone. The principle of this instrument relies on measuring the intensity ratio between two wavelengths of solar UV, one almost unaffected by ozone, and the other at a shorter wavelength moderately absorbed. Although the UV absorbing characteristics of ozone vary continuously with wavelength, the UV region is often divided for convenience in description into three arbitrary wavelength regions: UV-A, 400–315 nm, most of which reaches the Earth's surface; UV-B, 315–280 nm, some of which reaches the surface; and UV-C, <280 nm, none of which reaches the surface. (The wavelength borderlines are themselves arbitrary, and 320 and 290 nm are often chosen in the definitions.) A typical Dobson measurement will depend upon one wavelength in the UV-B region versus one from UV-A, e.g. the frequently used pair of 311.45 nm in the UV-B sector versus 332.4 nm for UV-A. The more ozone in the stratosphere, the larger the ratio of UV-A to UV-B.
With no significant prior information about Antarctic meteorology in 1956, Dobson anticipated finding a maximum over Halley Bay at the end of spring, similar to that previously observed at Spitzbergen, Norway. However, the stratospheric ozone content over the Antarctic station, instead of increasing steadily through the autumn and winter, as observed in the north, remained essentially constant through the autumn and winter darkness, and into mid-spring. The concentrations then increased sharply to a peak in mid-November, as illustrated in figure 11 for their first three years of observations during 1956–1959. The Dobson instrument can also be operated—but with much poorer precision—with the moon as the light source, as illustrated by the open circles in the winter in figure 11. Dobson recognized that the differences from Spitzbergen were caused by a very strong blocking Antarctic polar vortex, which, until its break-down in mid-spring sunlight, prevented the arrival over the south polar region of ozone-richer stratospheric air from the temperate zone.
Figure 11.
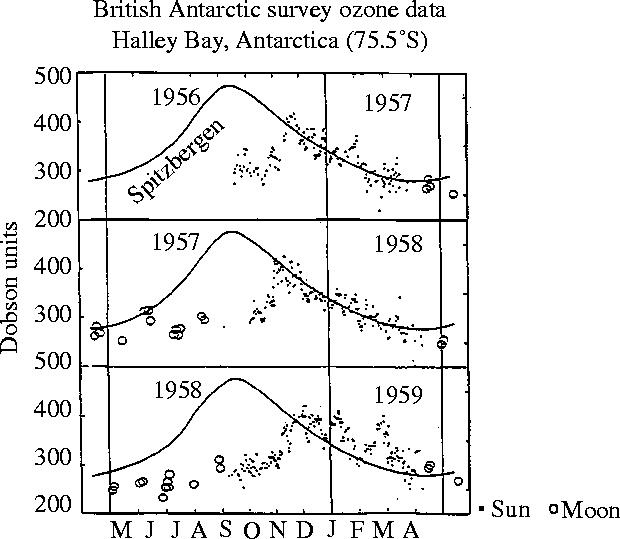
Ozone observations, Halley Bay, Antarctica, 1956–1959. Spitzbergen data displaced by six months.
This pattern of level ozone values into mid-spring was observed over Halley Bay throughout the 1960s and early 1970s. However, in the late 1970s, the average October ozone concentrations over Halley Bay began to decrease, dropping below 200 Dobson units (DU) in 1984 versus the 300–320 DU values of the 1960s (figure 12). The loss of ozone begins soon after the end of the polar winter darkness, and proceeds very rapidly for the next several weeks into mid-October. This totally unexpected phenomenon was first publicly reported in May, 1985, together with the hypothesis that the ozone decrease was correlated with the increasing CFC concentrations in the atmosphere (Farman et al. 1985).
Figure 12.
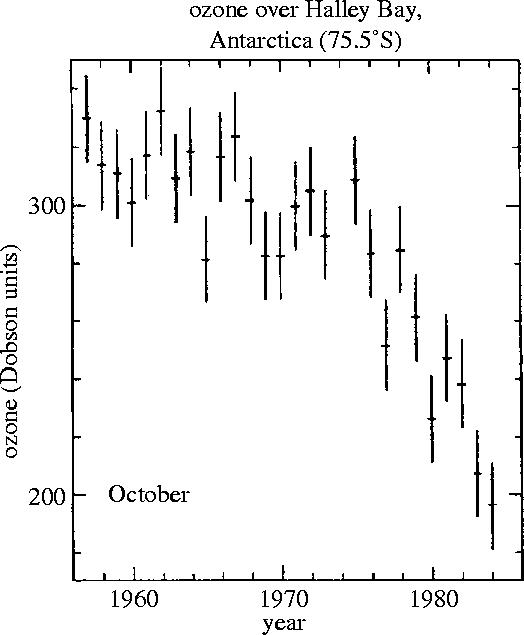
October ozone observations, Halley Bay, 1957–1984. (Adapted from Farman et al. 1985.)
These observations of substantially less ozone over Halley Bay in October in the 1980s were quickly shown to be characteristic of the entire south polar region by the measurements from the total ozone mapping spectrometer (TOMS) instrument on the Nimbus-7 satellite (Stolarski et al. 1986). This instrument also measures ozone from the ratio of two UV wavelengths, utilizing UV reflected back from the troposphere through the stratosphere to the satellite. More than 100 000 daily TOMS ozone measurements taken over the entire sunlit Southern Hemisphere are expressed in colour-coded Dobson unit contour plots in figures 13–16 for a typical early October day each in 1979, 1983, 1987 and 2003. In these TOMS displays, the lowest October ozone values fell rapidly from 250 DU in 1979 to 175 DU in 1983 and to 125 DU in 1987. The area with ozone readings below 220 DU, i.e. the size of the ‘ozone hole’, now typically reaches a maximum of about 30 million square kilometres, about 6% of the Earth's surface.
Figure 13.
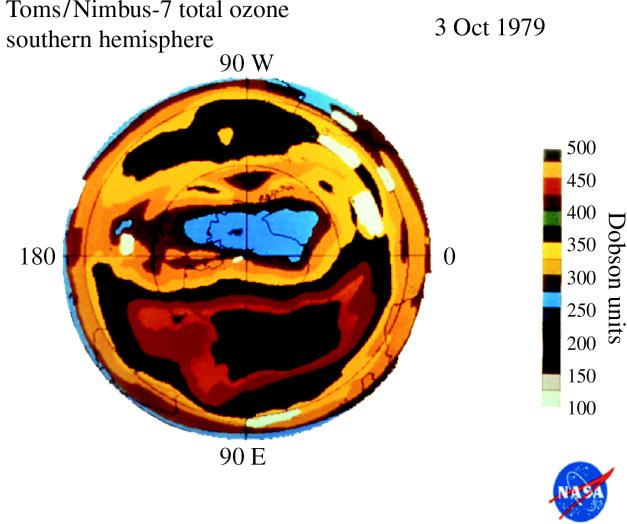
Southern Hemisphere ozone, 3 Oct 1979 (white spaces=no data).
Figure 14.
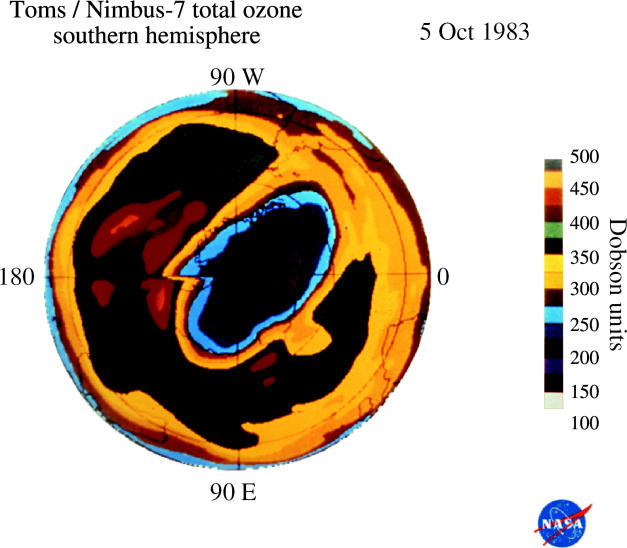
Southern Hemisphere ozone, 5 Oct 1983.
Figure 15.
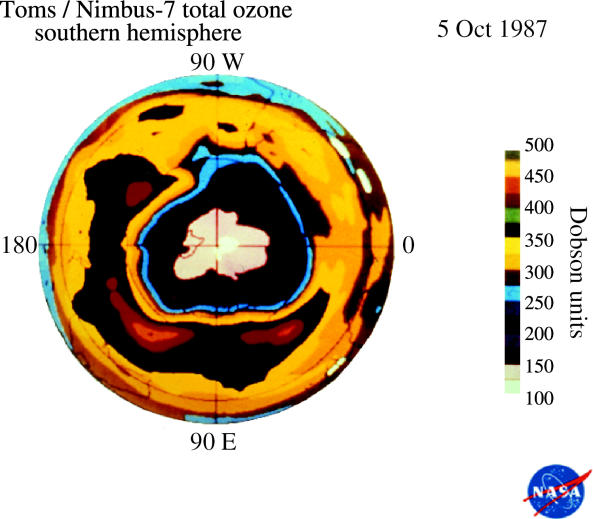
Southern Hemisphere ozone, 5 Oct 1987.
Figure 16.
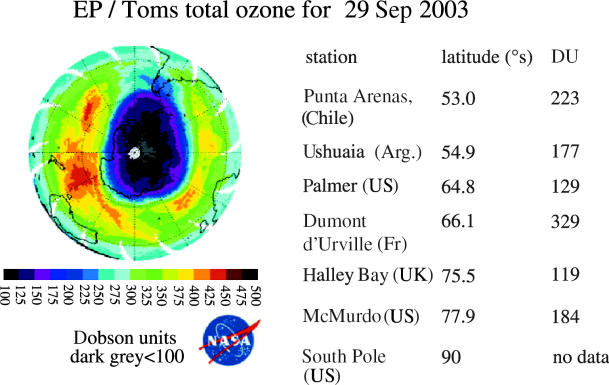
Earth probe TOMS, Southern Hemisphere, 29 Sep 2003 (white space=no data).
The data for figures 13–15 were all taken with the original Nimbus-7 TOMS instrument, which lasted for more than 14 years, eventually failing in May 1993. TOMS instruments on other satellites have provided a comparable source for subsequent measurements, including one sending back data from the Earth Probe satellite since 1996. The indicated ozone loss in 2003, 2004, and again in 2005, was generally comparable to the typical loss observed from about 1985 to the present.
The Antarctic ozone loss is often not symmetrical about the South Pole, extending especially strongly towards the Atlantic sector (figure 16). This can result in extremely low ozone values for various national bases along the Antarctic peninsula and for the cities of Ushuaia in Argentina and Punta Arenas in Chile, as listed in the figure. The years 1988 and 2002 in this two-decade series exhibited substantially different patterns of ozone loss, with the latter ‘ozone hole’ separating in two in mid-November and rapidly disappearing. However, the subsequent years have exhibited the more typical form of ‘ozone hole’ found for most of the period since 1985.
A totally different kind of ozone measurement, utilizing its chemical capability for oxidizing iodide ion to elemental iodine, has been used on daily balloon sondes, which report temperature and ozone to altitudes of 30–35 km. The chemical instruments on the sondes, unlike the TOMS instruments on the satellites do not require sunlight for the measurement, and work just as well in mid-winter in the polar darkness. A July sonde (figure 17) shows the ozone maxima and temperature minima lying between altitudes of 14 and 22 km over the South Pole. During September the ozone concentrations fall rapidly in this altitude range, with about six vertical kilometres nearly devoid of ozone by the end of September, as shown for 1999 in figure 17. The dashed line at −78 °C represents a temperature cold enough for PSCs to form, as discussed below.
Figure 17.
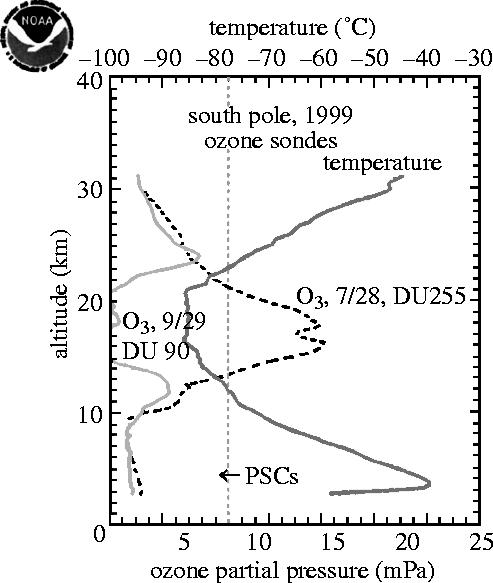
Vertical profiles, O3 and temperature, South Pole 1999. PSC, polar stratospheric cloud.
11. Chemistry of the polar stratosphere
Numerous theories were suggested in explanation for this new observation of heavy seasonal Antarctic ozone loss and can generally be classified into three types: (i) natural change in the dynamics of the Antarctic stratosphere; (ii) change in the natural chemistry of NOX in the stratosphere or (iii) chemical changes induced by mankind, especially through the introduction of artificial chlorine-containing compounds such as the CFCs. A lowering of the springtime stratospheric temperatures was observed to accompany the observations of ozone loss, and was briefly suggested as a leading cause for its destruction (Angell 1986; Chubachi & Kajawara 1986; Newman & Schoeberl 1986; Sekiguchi 1986; Singer 1989). However, regular balloon sonde measurements of stratospheric temperatures and vertical ozone profiles had been measured by Farman and colleagues throughout the winter for decades prior to the onset of this special ozone loss. The sonde temperature values for August and September in the early 1980s were known to have fallen well within the range observed from 1957 to 1975—that is, no unusual temperature change as the winter cold settled in. The deviations towards lower stratospheric temperatures in the 1980s began in October, and represented not a cooling but instead a slower warm-up from the wintertime minimum. The depletion of ozone each September meant that much less ozone was present when the sun reappeared as spring approached, and therefore, less solar radiation was absorbed by ozone, and the temperature warmed up much more slowly than it had during the 1957–1975 period.
While the decreases in average amounts of Antarctic ozone are most marked in October, a steady erosion has taken place in the ozone concentrations over Halley Bay throughout all of the sunlit months, as shown in table 1. With less ozone present, less UV radiation is intercepted, and less heat is released and a pattern of lower stratospheric temperatures over the Antarctic has been established.
Table 1.
Antarctic ozone, in Dobson units monthly averages, Halley Bay (75.5° S) monthly data averaged over 11 year periods. (Monthly ozone data from British Antarctic Survey Halley Website (J. Shanklin).)
| month | ||||||
|---|---|---|---|---|---|---|
| years | October | November | December | January | February | March |
| 1956–1966 | 304±13 | 351±32 | 355±15 | 319±13 | 299±11 | 297±17 |
| 1967–1977 | 284±17 | 343±27 | 341±12 | 313±5 | 288±13 | 278±12 |
| 1978–1988 | 218±36 | 277±44 | 323±17 | 298±11 | 278±8 | 268±12 |
| 1989–1999 | 142±13 | 201±26 | 274±22 | 277±8 | 264±9 | 259±11 |
| per cent ozone reduction | ||||||
| 89s/56s | 53 | 43 | 23 | 13 | 12 | 13 |
| 89s/78s | 35 | 28 | 15 | 7 | 5 | 3 |
Three polar expeditions in 1986 and 1987 provided the scientific basis for the conclusion that the ozone losses over Antarctica were indeed the consequences of chemical reactions driven by the much higher stratospheric chlorine concentrations of the mid-1980s versus those of 1956–1975. Two of these expeditions were ground-based at the US installation at McMurdo, Antarctica. In 1986, an unexpected second maximum was detected (figure 18) in the vertical profile of the free radical ClO, as measured by ground-based millimetre wave emission spectroscopy (deZafra et al. 1987). The ClO radicals formed by reaction (4.5) are the ‘smoking gun’ for ozone destruction by atomic chlorine, and the higher altitude maximum shown in figure 18 occurred at the altitudes expected for the homogeneous gas phase reaction cycle of (4.5) and (4.6) (see page 772).
Figure 18.
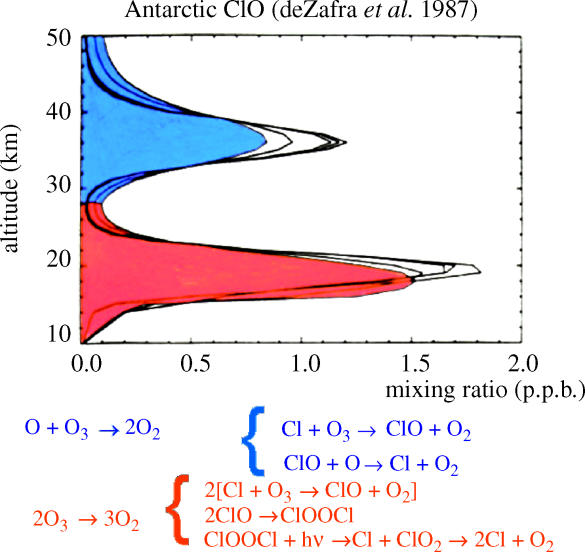
Vertical profile of ClO (McMurdo 1986) (progressive best fits to data).
However, the larger and unexpected maximum in ClO concentration was found in the lower stratosphere, and reached parts per billion concentrations coincident with the 15–21 altitude range of major ozone loss.
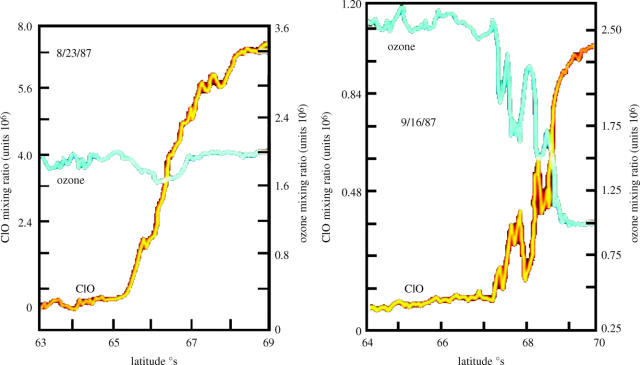
These results were then followed in 1987 by in situ measurements of ClO and O3 within the polar vortex by instruments on the high-flying (18 km) ER-2 aircraft (Anderson et al. 1989). These experiments were carried out from a base in Punta Arenas, Chile (53° S latitude), and the ER-2 entered the polar vortex over the Antarctic peninsula. Anderson's data (figure 19a) on the first successful flight on August 23 showed clearly the parts per billion levels of ClO over Antarctica. However, the simultaneous ER-2 data for ozone showed little or no change in concentration inside or outside the polar vortex. At this late-winter date, sunlight had only been available in the Antarctic stratosphere for a few days. In contrast, 24 days later on September 16, the ClO levels (figure 19b) over Antarctica were again in the parts per billion range, but by this time approximately two-thirds of the ozone within the polar vortex at this altitude had already disappeared. The edge of the Antarctic polar vortex was particularly ragged on September 16 and the high values of ClO and low values of ozone tracked each other in near-perfect anti-correlation.
Figure 19.
ER-2 measurements of ClO and O3, 1987 (Anderson 1989).
The chlorine chemistry of the Antarctic lower stratosphere has some substantial differences from that of the upper stratosphere in the temperate and tropical zones. Because the concentration of O atoms is very low in the polar lower stratosphere when the sun is barely above the horizon, reaction (4.6) is quite slow and the second step in the usual ClOX chain is no longer effective. At these altitudes the winter temperatures drop into the range from −80 to −85 °C (see figure 17), low enough for the formation of PSCs, which can contain both nitric acid (HONO2) and H2O (McCormick et al. 1982; Crutzen & Arnold 1986; Toon et al. 1986; WMO 2003). Such low temperatures and the accompanying clouds are much less common over the North Pole for meteorological reasons, and are not generally found in the temperate zone stratosphere at all. However, the same air mass is held throughout the winter within the south polar vortex, and a greater temperature drop within is facilitated by the long months of total darkness, during which PSC formation can readily occur.
In 1984, my colleague Sato found that two additional chemical reactions involving chlorine nitrate, (11.1) and (11.2), proceeded very rapidly in laboratory vessels, even when coated with materials well known not to favour surface reactions (Sato & Rowland 1984; Rowland et al. 1986; Rowland 1990).
| (11.1) |
| (11.2) |
When the Antarctic ozone hole appeared, two-dimensional models (now with variable latitude in addition to the vertical parameter of the one-dimensional models) of the atmosphere could not even qualitatively account for such rapid ozone losses without the addition of very rapid reactions such as (11.1) and (11.2) to the usual reactions of chlorinated species (Solomon et al. 1986). Even these additions still left a major quantitative problem in explaining the ozone loss.
Laboratory experiments with icy surfaces analogous to those believed present as PSCs then demonstrated that both (11.1) and (11.2) occurred very rapidly and were very important in the Antarctic itself (Molina et al. 1987; Tolbert et al. 1987). The PSCs furnish active surfaces on which heterogeneous chemical reactions can occur, and which are required to make these reactions take place. The products Cl2 and HOCl are then released from the PSC surface back into the gas phase, where they are photolysed to release Cl atoms when the sun returns from its wintertime absence. The HONO2 from such reactions can remain in these clouds, tending to denitrify the gaseous part of the air mass. When cold enough, sufficient additional water molecules can accumulate, enlarging the PSC particles enough to make them fall by gravitation, dehydrating the air mass as well (WMO 2003).
An important aspect of the denitrification process is the very low residual concentrations of gaseous NO and NO2, severely curtailing the formation reaction for chlorine nitrate by reaction (8.4). Without this removal process, the ClO concentrations rise to mixing ratios in the parts per billion range, and begin to react in significant numbers with other ClO radicals to form the dimer ClOOCl shown in equation (11.3). The chlorine oxide dimer, ClOOCl, can then be destroyed by sunlight in equation (11.4), releasing one Cl atom each in (11.4) and (11.5). The sum of reaction (4.5) taken twice plus (11.3), (11.4) and (11.5) is shown in equation (11.6): two O3 molecules are transformed into three O2 molecules without any need for the involvement of free O atoms (Molina & Molina 1987).
| (11.3) |
| (11.4) |
| (11.5) |
| (11.6) |
This dimer cycle is the key to rapid Antarctic ozone loss. When O atoms or NO radicals do not quickly attack ClO, the latter's concentration builds up high enough to bring in the ClO dimer method of destroying ozone, which operates without needing the O atoms which are critical to the higher altitude ozone loss mechanism and are essentially absent at low altitudes.
12. Other halogen species
The fluorine atoms carried into the stratosphere by the CFCs are also reactive, and will attack ozone to form FO and O2 in direct analogy to the Cl attack in (4.5), and can be returned to atomic F by reaction with O, in analogy with equation (4.6). However, the competing reaction of F atoms with CH4 to form HF is considerably faster than its Cl atom counterpart, and breaks up the FOX chain after about 100 cycles. The biggest difference then arises between the ClOX and FOX chains—HF is a very stable molecule, and does not react with HO radical, or anything else in the stratosphere. So the FOX chain never gets restarted. The approximate chain reaction yield per F atom released is about 100 molecules of ozone lost, negligible alongside the 100 000 ozone molecules lost per Cl atom released.
Much smaller amounts of bromine are used commercially, much of it for the manufacture of fire prevention agents known as Halons (WMO 2003). These include Halons 1301 (CBrF3), 1211 (CBrClF2) and 2402 (CBrF2CBrF2), all of which have atmospheric lifetimes of several decades. Each is now present in the atmosphere in several parts per trillion quantities. In addition, about half of the atmospheric load of bromine comes from methyl bromide (CH3Br) which has both natural and artificial sources. This compound has a rather short atmospheric lifetime of about eight months (WMO 2003). Of course, the shorter the observed lifetime, the larger the sources needed to maintain a given concentration in the atmosphere. A very large fraction of the bromine lost from methyl bromide decomposition takes place in the troposphere with no stratospheric consequences. However, a BrOX chain does exist in the stratosphere in analogy with ClOX, but with few escape routes from the chain because, unlike Cl and F, the reaction of Br with CH4 is energetically quite unfavourable and does not occur. As a consequence, Br atoms released in the stratosphere tend to stay in the chain mode most of the time. The most significant chain involving bromine relies on the cross reaction of BrO with ClO, parallel to the ClO dimer reaction, and ultimately releasing one Cl atom and one Br atom. Atomic bromine, per atom, is about 20–50 times as efficient as Cl in destroying ozone under various stratospheric conditions. However, the total precursor Br concentration lies in the 20 p.p.t. range versus about 3000 p.p.t. for Cl sources (WMO 2003). The Br chains are important but not the dominant contributor to stratospheric ozone loss under most conditions.
13. Ozone losses in the northern temperate zone
By 1985, the several existing statistical evaluations of the archived data from the ground-based Dobson ozone stations in the Northern Hemisphere indicated that no significant loss in total ozone had occurred there (WMO 1986). The longest continuing series of these ozone measurements without any significant breaks has been carried out since August 1931 in the Swiss Alpine community of Arosa. Although the complete dataset contains individual total ozone measurements for most days, the usual statistical treatments have concentrated on the monthly average ozone levels. In 1986, Neil Harris and I reexamined this Arosa monthly data series, treating it not as a single comprehensive set covering all of the seasons, but as a collection of 12 separate data sets, one for each calendar month. The interannual ozone comparisons in figure 1 show very substantial seasonal differences in the variability of the monthly averages. While each year individually exhibits the normal north temperate zone pattern of maximum ozone values around the spring equinox, and a minimum at the beginning of autumn, the year-to-year variability in average ozone concentration for each month is much greater for the January-to-April period than it is for July-to-October. When this 56 year data series from Arosa was separated into two, the 39 year 1931–1969 and 17 year 1970–1986 periods, the significant result emerged that less ozone was measured for several of the autumn-to-winter months after 1970 than in the previous four decades (Harris & Rowland 1986). Figure 20 shows this wintertime ozone loss at Arosa with the inclusion of data from 1987 to 1988.
Figure 20.
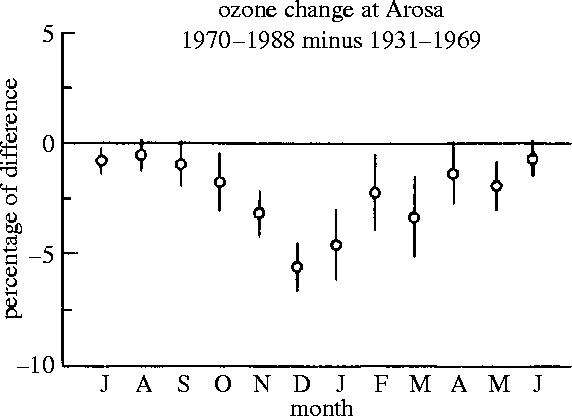
Differences in average O3 concentrations, (1970–1988) versus (1931–1969).
We then extended this inquiry to the monthly averages from two US ozone stations, Caribou, Maine, and Bismarck, North Dakota. All three of these stations coincidentally are located at 47° North Latitude, but the US stations only began taking data in 1963. When the data for 1965–1975 were compared with 1976–1986, the two US stations also exhibited wintertime losses. This comparison of consecutive 11 year periods minimizes any influence of 11 year solar cycle variations in UV emission on the evaluation of the longer term trends. Subsequently, the WMO/NASA Ozone Trends Panel examined all 18 of the ozone stations between 35 and 60° N which had at least 22 years of data (again, enough for two complete 11 year solar cycles), and found that all of them had less wintertime ozone in 1976–1986 than in the earlier period, as shown in figure 21 (Rowland et al. 1989, WMO 1990). The previous statistical analyses which had not detected ozone loss (WMO 1986) had generally not included the most recent years of new data. In addition, they had adopted a premise that ozone loss, if it occurred, would be the same in all seasons, and heavily weighted their detection calculations towards the summer when the natural variability was least, allowing the wintertime losses to be obscured by the much more heavily weighted summertime smaller variations with time.
Figure 21.
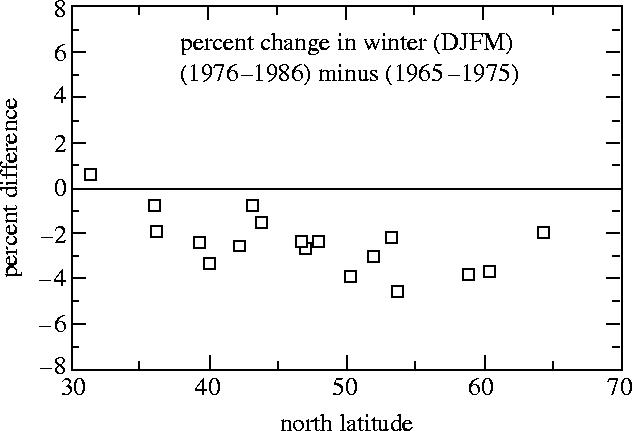
Per cent ozone change, (1976–1986) versus (1965–1975) Northern Hemisphere Dobson stations.
An earlier National Academy of Sciences/National Research Council report had concluded that loss of ozone had already been observed in the atmosphere at the altitudes between 35 and 40 km for which the ClOX chain reaction of (4.5)+(4.6) was predicted to be most effective (NAS 1982/NRC 1982); however, no indication of total ozone loss had been detected at that time. The Ozone Trends Panel Report was the first assessment document to assert that statistically significant total stratospheric ozone loss was now observed over the north temperate latitude zone. This meant of course that more UV-B radiation was now reaching the Earth's surface. Unlike the Antarctic region, this geographical zone included the highly populated areas of North America, Europe, the Soviet Union, China and Japan, and raised the question of the effects of additional exposure to solar UV-B radiation for billions of humans.
The combination of very large springtime losses of ozone over Antarctica directly attributable to man-made chlorine compounds, together with measurable ozone losses in the north temperate zone—for which the CFCs were the obvious suspects—brought a rapid change in the attitudes of the CFC-producers and many of the users. A complete phase-out of CFC production and uses became an announced, widely accepted goal.
14. The montreal protocol for regulation of CFCs
Regulations for the control of CFC emissions had first been enacted during the late 1970s for the use of CCl3F and CCl2F2 as propellant gases for aerosol sprays, but only in the United States, Canada, Sweden, and Norway. Because the US accounted for about half of the world CFC use at this time, with the majority of it as propellant gases, these bans accounted for about one-third of the current total global use. The United Nations agreed in March 1985 to the ‘Vienna Convention for the Protection of the Ozone Layer’, with the charge to ‘take appropriate measures in accordance with the provisions of this convention…to protect human health and the environment against adverse effects resulting or likely to result from human activities which modify or are likely to modify the ozone layer’ (Benedick 1998; Andersen & Sarma 2002).
Then, in September 1987, a further agreement, the ‘Montreal Protocol on Substances That Deplete the Ozone Layer’, called for scaled reductions on the production of CFCs, ending with a 50% cutback in CFC production averaged over the 12 months beginning July 1, 1998. The terms of the Montreal Protocol called for periodic revisits to the regulations, and a meeting in London in 1990 changed the restricted production into an outright phase-out by January 1, 2000. A further U.N. meeting in Copenhagen in 1992 accelerated the deadline for the phaseout of CFCs to January 1, 1996, for the major industrial countries (with a 10 year delay for developing countries), and also included regulations for compounds such as methylchloroform (CH3CCl3), carbon tetrachloride (CCl4), and the bromine-containing Halons, i.e. CBrF3, CBrClF2 and CBrF2CBrF2 (Benedick 1998). Further minor adjustments were made in Montreal in 1997 and Beijing in 1999 (Andersen & Sarma 2002).
15. Changes in ultraviolet flux at Earth's surface
Most of the measurements of total ozone, including the Dobson and TOMS data, actually depend upon the ratio of two wavelengths of solar UV radiation, as described earlier. A change in the amount of ozone along the path of the UV radiation is inferred from a change in the wavelength intensities of the detected radiation. In these cases, the existence of a correlation with the same instrument between reported ozone and the UV-B/UV-A dual wavelength ratio under clear sky conditions is essentially a tautology. Less reported ozone means either more UV-B or less UV-A or a mixture of both. Because no mechanisms for significant changes in the intensity of solar UV-A radiation have been put forward, an increase in the UV-B/UV-A ratio has often been directly expressed as the corresponding diminution in total ozone.
Nonetheless, after reports of a decrease in average ozone over the United States were reported based on the Dobson technique, direct UV-B measurements over the United States were also reported to show decreasing amounts of radiation reaching the surface (Scotto et al. 1988) and were widely quoted for the next decade. These UV-B measurements were made with a Robertson–Berger meter, which, unlike the strongly collimated Dobson instrument, has a flat surface accepting solar radiation from all angles above the surface, even after many scattering processes have caused multiple changes in the direction of the radiation. When the goal is measurement of total exposure to UV radiation, instruments accepting both direct and scattered solar radiation are much more pertinent because the latter is usually a very significant fraction of the total.
The R–B meter also is a broad-band instrument combining all wavelengths of UV-B into a single UV response, with no separate record of intensity at any particular wavelength. The detector itself has a built-in weighting factor designed to mimic the erythemal (sunburn) response of human skin. This logical inconsistency in the data between the Dobson and the R–B instrument records was finally settled by demonstration that side-by-side measurements with two instruments showed an anti-correlation between ozone concentration and UV-B intensity on an absolute scale (Kerr & McElroy 1993). Separately, the decade-long calibration records for the R–B meters were found to have sufficient gaps and other problems to make the dataset completely unsatisfactory for the evaluation of long-term trends in UV-B radiation (Weatherhead et al. 1997).
This absence of well calibrated, precision absolute measurements of UV radiation over a decade or more illustrated the weakness of the existing system for UV-B measurements. As a consequence, spectrometers capable of absolute measurements versus wavelength across the entire UV and visible spectrum were developed and deployed in various locations, especially in the Southern Hemisphere, including three Antarctic stations—South Pole, McMurdo (78° S) and Palmer (64° S)—as well as Ushuaia, Argentina (55° S), and Barrow, Alaska (71° N). These instruments also are flat panel detectors, accepting both direct and scattered solar radiation because the goal is assessment of total UV-B exposure (Booth & Madronich 1994; Booth et al. 2001) rather than measurement of stratospheric ozone. Multiple scattering is especially important under the highly reflective surface conditions of polar ice and snow.
The Antarctic polar vortex, and the low ozone concentrations contained within it during recent Octobers mean that the possibility now exists for much higher UV-B exposures in the southern latitudes than in previous times. During October 2004, the ozone hole varied in elongation, while rotating clockwise when viewed from above, and on one occasion swept over the inhabited parts of the southern tip of South America. As illustrated in figures 22 and 23 for October 7 and 12, 2004, the ozone overhead in Ushuaia, Argentina, and Punta Arenas, Chile, dropped from more than 300 Dobson units to less than 200 DU within 5 days. Meanwhile, the Halley Bay station and the South Pole remained well below 200 DU for about two months. The polar area with ozone readings less than 200 DU currently reaches a typical maximum size early in October of 25–30 million square kilometres.
Figure 22.
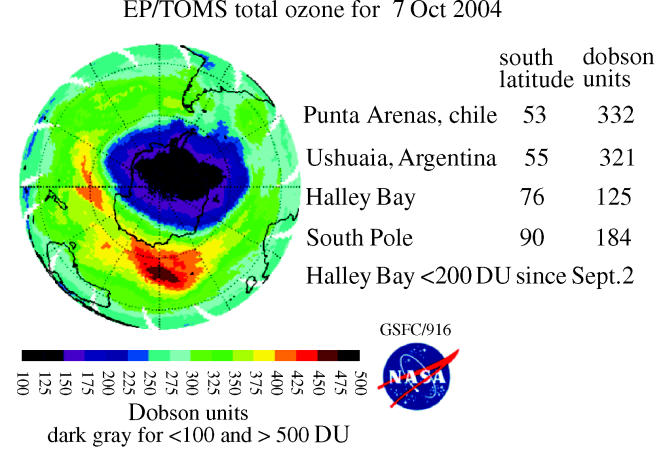
TOMS Southern Hemisphere ozone, Punta Arenas and Ushuaia outside the ‘hole’.
Figure 23.
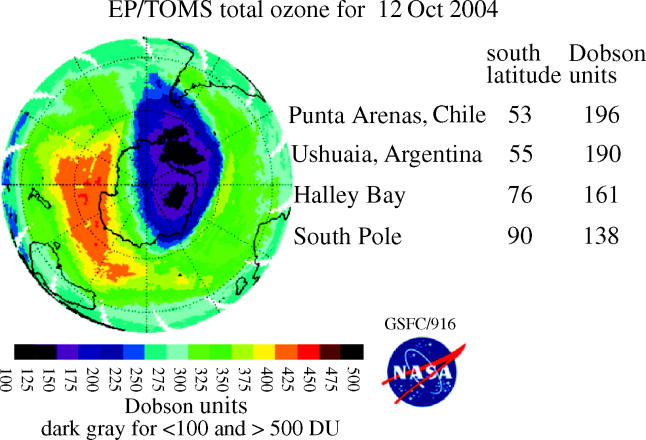
TOMS Southern Hemisphere ozone, Punta Arenas and Ushuaia in the ‘hole’.
Most concerns about UV effects on biology are directed towards the UV-B range because none of the UV-C radiation gets down to Earth's surface, and UV-A radiation at the surface is so intense that all species exposed to sunlight without some internal mechanism for dealing with UV-A would long since have become extinct. The effects of UV-B on humans and many other species are intimately connected with the UV absorption characteristics of DNA, which parallel that of ozone in the rapid increase with shorter wavelengths. In the 295 nm region of UV, relatively little UV-B normally makes it to the surface, and therefore, can be substantially multiplied if the total ozone level is depleted in a major way. At the same time, this 295 nm radiation is strongly absorbed by DNA, enhancing the biological effectiveness of this absorption.
The intensity of UV radiation at the surface is dependent upon the solar zenith angle and upon the amount of ozone. When the ozone hole sweeps over Ushuaia in southern Argentina the UV intensity at 295 nm can vary by a factor of 100 within a few days, as illustrated in figure 24. The maximum daily intensity observed over an entire year for the UV Index (UV erythemally weighted=sunburn response of human skin) at Palmer (64° S) in the Antarctic peninsula now exceeds that in San Diego (32° N) by about 25%, as illustrated for the decade 1991–2001 in figure 25. The UV Index for Barrow in northern Alaska reaches a maximum daily value about half of that in San Diego.
Figure 24.
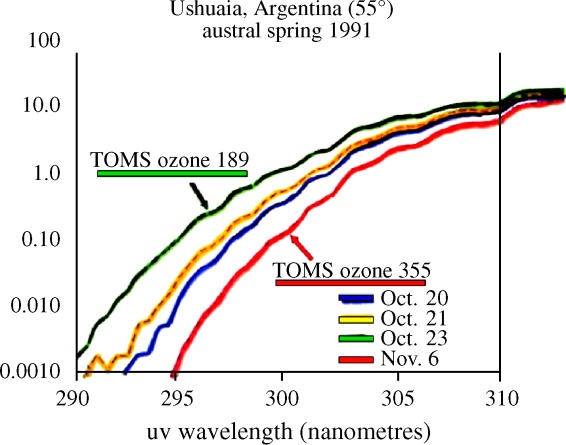
UV-B intensities at surface on 4 different days.
Figure 25.
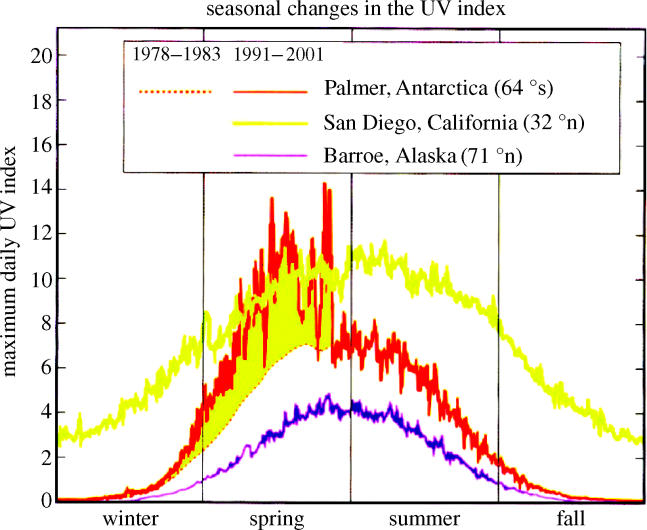
UV index, 1991–2001, Barrow, Palmer and San Diego.
The biological effects of the Southern Hemispheric change in maximum exposure intensity are then dependent on the nature of the biological response. For example, the incidences of basal and squamous cell skin cancer, the most common kinds, are generally considered, because of the great increase in incidence with age, to be the consequence of repeated cumulative, exposures to UV-B radiation (deGruijl 1999; DeFabo 2000; DeFabo et al. 2004). In contrast, malignant melanoma is often attributed to a single, very intense exposure, which might well be much more likely in the southern regions of Argentina and Chile during the periods when the ozone hole has greatly reduced the protective shield from overhead ozone. These increased exposures are less likely to affect humans because they can take protective measures, but plants and animals receive much more UV-B during ozone hole episodes than was common a few decades ago.
16. Ozone and CFC concentrations after the montreal protocol
The passage of the Montreal Protocol had an immediate effect on the emissions of the regulated gases, in most cases faster than actually required by the protocol terms. The most striking effect has been the rapid decrease in the CH3CCl3 concentrations in the atmosphere. This compound has a short atmospheric lifetime of about 5 years because of its reactivity towards HO radicals, and major releases to the atmosphere stopped early in the 1990s in response to the scheduled ban. The CH3CCl3 concentrations had reached about 140 p.p.t. by 1992, and have now decreased to about 22 p.p.t. in mid-2004. With three atoms per molecule, this change alone has already reduced the total organochlorine content in the troposphere by about 350 p.p.t. However, with 85% of CH3CCl3 already gone and no remaining important short-lived contributor to the total organochlorine burden left in the atmosphere, the rapid reduction in total chlorine found for the past decade will cease. Instead, the reduction will proceed at the average of the 2 and 1% per year rates, respectively, calculated for CCl3F and CCl2F2. For example, the total ban on CCl2F2 is expected to reduce its atmospheric burden by only about 50 p.p.t. (out of 540 p.p.t.) in the next decade.
17. Changing ozone and CFC concentrations since 1990
Ozone concentrations in the stratosphere continued to fall in the early 1990s. The measured ozone overhead at the South Pole was only 91 DU on October 12, 1993, and the vertical profile data from the corresponding balloon sonde indicated that all ozone had been removed from a 6 km altitude band between 15 and 21 km, as shown earlier in figure 17.
The TOMS satellite registered many new record daily lows (compared to the same calendar day in all earlier years) in early 1992, and then for nearly 13 months from mid-April, 1992, a new record daily low global ozone value was measured every day; the measurement series ended when the TOMS instrument finally failed on May 7, 1993, after more than 14 years. The ozone data interpretations during this period were complicated by the eruption of Mount Pinatubo in the Philippines in June 1991. This volcano, while not providing any significant amount of HCl to the stratosphere, did introduce particulate surfaces on which reactions could occur similar to those taking place on the PSC surfaces. The ozone measurements during the immediate post-Pinatubo years are usually interpreted as including augmented losses from the additional surfaces furnished by the volcanic eruption. By 1995, the north temperate zone total ozone losses approached 10% during winter and spring and 5% in the summer and autumn (WMO 1995).
The most recent international report on the state of the stratospheric ozone layer (WMO 2003) indicates not much further change over the last few years, with an average ozone loss relative to the 1980 levels of 6% for the Southern Hemisphere mid-latitudes, and 3% for the Northern Hemisphere mid-latitudes. The tropics continue not to exhibit any significant change in ozone levels, while both polar regions show extensive ozone loss—especially the Antarctic where the ozone hole remains a very prominent feature (WMO 2003).
In contrast, the measured tropospheric concentrations of the various halocarbon gases deviated in the 1990s in response to the restrictions of the Montreal Protocol from their earlier pattern of steady increases. The concentrations of the three major CFCs, which had risen almost linearly during the 1980s, markedly slowed this pace, and by 1995–1997 had essentially levelled off, and are now decreasing for CCl3F (figure 26) and CCl2FCClF2, and almost level for CCl2F2 (also figure 26).
Figure 26.
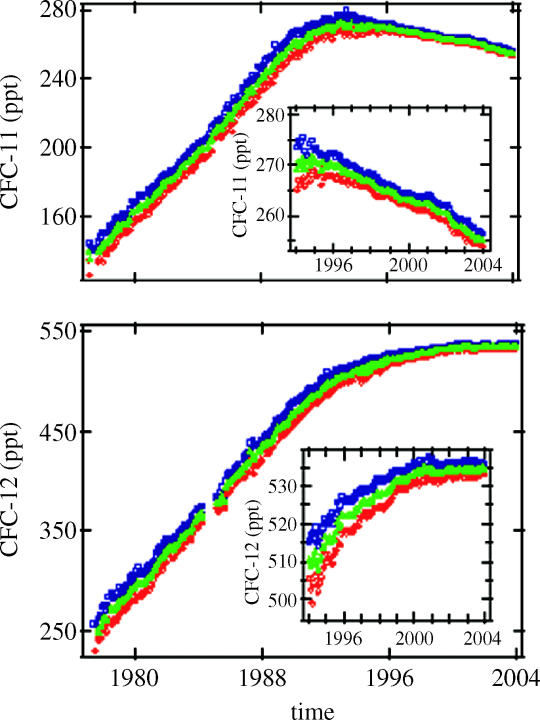
Change in surface concentrations of CCl3F and CCl2F2.
The situation at the end of 2004 remains a mixed one. The three most important CFC molecules have atmospheric lifetimes measured from many decades to a century, with the consequence that there will be significant quantities of these compounds present in the atmosphere throughout the twenty-first century. As an example, the mixing ratio of CCl2F2 is expected, with no further additions, still to be 200 p.p.t. in the year 2100, 75 p.p.t. in 2200, and about 28 p.p.t. in the year 2300. However, because the major contributors to the ozone losses are the man-made chlorine and bromine compounds controlled by the Montreal Protocol, the amount of organochlorine in the troposphere passed through a maximum around 1995.
The most recent WMO report has concluded (2003) ‘over the time scale of the next 50 years, the stratospheric ozone layer is expected to ‘recover’ from the effects. However, because of other atmospheric changes, future ozone levels may differ from those in the past’. They attributed the ozone losses near 40 km altitude to ‘purely gas phase chlorine chemistry’, the basic original prediction made by Molina and Rowland 30 years earlier. The initially surprising losses in the lower stratosphere in the polar regions were described in this way: ‘heterogeneous chemistry in or on PSCs causes the conversion of stable chlorine reservoirs to more active forms. Ozone loss then occurs through reactions involving chlorine and bromine species’ (WMO 2003).
The major springtime losses in the Antarctic will probably continue somewhat beyond the mid-twenty-first century. When the weighted effects of bromine compounds are added in, the peak in tropospheric halocarbon concentrations occurred a few years ago. With a delay time of 5–7 years for full equilibration upward into the stratosphere, the ozone loss now appears to be approximately at a balance point, and normal year-to-year fluctuations will make it hard to be certain that ‘ozone recovery’ is actually underway for another decade or more. During this half-century, the atmosphere will remain loaded with chlorine and bromine compounds, and a volcanic eruption—especially if much larger than Pinatubo in 1991, which was the largest in the past half century—might cause increases in the particulate surface area in the stratosphere and cause for several years transitory large ozone decreases until the excess particulates settled out of the atmosphere.
Prominent among the ‘other changes in the atmosphere’ which might influence total ozone depletion is the changing temperature structure of the stratosphere caused by the steady increase in greenhouse gases, especially carbon dioxide. One effect of more atmospheric carbon dioxide is to decrease temperatures in the stratosphere, and this could lead to more extensive cloud formation, and more particulate surface areas as well. The potential for substantial increases in particulate surfaces, and consequently more extensive ozone depletion, is most likely to have an effect in the Arctic stratosphere where the temperatures are closer to the borderline for PSC formation. However, within the limitations just expressed about volcanic or PSC surface areas, the threat of extensive further stratospheric ozone depletion during the twenty-first century appears to be under control.
The present understanding of stratospheric chemistry has made great forward strides in the past three decades. Furthermore, the extensive atmospheric monitoring programmes, which have now been instituted around the world will continue to provide experimental tests and verification of the validity of our current understanding. The citation accompanying the 1995 Nobel Prize in chemistry used the phrase ‘our salvation from a global environmental problem that could have catastrophic consequences’ in its description of the scientific endeavours to that date concerning stratospheric ozone depletion. The succeeding decade seems to have generally provided confirmatory data without big surprises on the ozone front, but the greenhouse effect, global warming and abrupt climate change are presenting much more forbidding scientific, economic and political challenges.
Endnotes
The troposphere extends from the surface to an altitude which varies both with the latitude, reaching 17 km over the tropics and 6–10 km in polar regions, and the season, being slightly higher in the summer months. The temperature decreases with increasing altitude in the troposphere until it reaches the tropopause region and then begins to increase at higher altitudes. This region of rising temperature with increasing altitude is the stratosphere which extends up to an altitude of 50 km. Ninety per cent of the atmosphere is in the troposphere, with only 0.2% lying above the stratosphere.
The measurement unit for atmospheric ozone has been named the Dobson unit in his honour. The official definition is that one DU is the thickness in units of hundredths of a millimetre that the entire ozone column would occupy at standard temperature and pressure (0 °C and one atmosphere). One DU represents about 2.69×10¹⁶ molecules cm−2 and is approximately one part in 109 of the molecules in the atmosphere. The global average ozone content of the atmosphere is approximately 300 DU or 3×10⁻⁷ of the atmosphere.
Chemical notation frequently designates fractional composition versus total weight, especially for liquids and solids. At other times the fraction is compared to the total number of molecules, expressed interchangeably as ‘mole fraction’ or ‘mixing ratio’. Here, we use the mole fraction notation, and the US numbering system: p.p.m., parts per million, 10−6; p.p.b., parts per billion, 10−9; p.p.t., parts per trillion, 10−12.
These three chlorofluorocarbons (CFCs) have been the major formulations which have found extensive technical use. The CFCs are often industrially identified by a numerical formula which gives the number of F atoms in the units digit, number of H atoms plus 1 in the tens digit, and number of C atoms minus 1 in the hundreds digit: CCl3F→CFC-11, dropping the 0 from 011; CCl2F2→CFC-12, and CCl2FCClF2 → CFC-113. During the past two decades, the hydrogen-containing species have been distinguished from the fully halogenated CFCs by subdivision into two new categories of HCFCs (e.g. CHClF2→HCFC-22) and HFCs (e.g. CH2FCF3→HFC-134a, with the ‘a’ distinguishing this molecule from its isomer HFC-134, CHF2CHF2. The new description emphasizes the absence of Cl in the second case, and their fairly rapid removal through tropospheric reaction with HO—with less need for regulation—in both. Descriptions of the CFCs in the technical and public literature often identify the molecules only by these numerical designations. They are also frequently described by the trademark names of the manufacturer, of which the best known are the duPont ‘Freons’ such a Freon-12.
References
- Adel A. Selected topics in the infrared spectroscopy of the solar system. In: Kuiper G.P, editor. The atmospheres of the Earth and planets. University of Chicago Press; Chicago, IL: 1949. p. 269. [Google Scholar]
- Anderson J.G. Ozone depletion, greenhouse gases, and climate change. National Research Council; 1989. Free radicals in the Earth's atmosphere: measurement and interpretation; pp. 56–65. [Google Scholar]
- Andersen, S. O. & Sarma, K. M. 2002 Protecting the ozone layer. The United Nations History, United Nations Environment Programme.
- Anderson J.G, Brune W.H, Proffitt M.H. Ozone destruction by chorine radicals within the Antarctic vortex: the spatial and temporal evolution of ClO–O3 anticorrelation based on in situ ER-2 data. J. Geophys. Res. 1989;94:11 465–11 479. [Google Scholar]
- Angell J.K. The close relationship between Antarctic total ozone depletion and cooling of the Antarctic lower stratosphere. Geophys. Res. Lett. 1986;13:1240–1243. [Google Scholar]
- Bates D.R, Nicolet M. The photochemistry of atmospheric water vapor. J. Geophys. Res. 1950;55:301–327. [Google Scholar]
- Bauer E. A catalog of perturbing influences on stratospheric ozone, 1955–1975. J. Geophys. Res. 1979;84:6929–6940. [Google Scholar]
- Benedick R.E. New directions in safeguarding the planet. Harvard University Press; Cambridge, MA: 1998. Ozone diplomacy; p. 449. revised. [Google Scholar]
- Blake D.R, Rowland F.S. Continuing Worldwide increase in tropospheric methane. Science. 1988;239:1129–1131. doi: 10.1126/science.239.4844.1129. [DOI] [PubMed] [Google Scholar]
- Booth C.R, Madronich S. Radiation amplification factors: improved formula accounts for large increases in ultraviolet radiation associated with Antarctic ozone depletion. In: Weiler C.S, Penhale P.A, editors. Antarctic research series. vol. 62. American Geophysical Union; Washington, DC: 1994. pp. 39–42. [Google Scholar]
- Booth C.R, Bernhard G, Ehramjian J.C, Quang V.V, Lynch S.A. Biospherical Instruments Inc.; San Diego: 2001. NSF polar programs UV spectroradiometer network 1999–2000 operations report; p. 219. [Google Scholar]
- Chang J.S, Duewer W.H, Wuebbles D.J. The atmospheric nuclear tests of the 1950's and 1960's: a possible test of ozone depletion theories. J. Geophys. Res. 1979;84:1755–1765. [Google Scholar]
- Chapman S. A theory of upper atmospheric ozone. Mem. R. Meteorol. Soc. 1930;3:103–125. [Google Scholar]
- Chappellaz J, Barnola J.M, Raynaud D, Krotkevich Y.S, Lorius C. Ice-core record of atmospheric methane over the past 160,000 years. Nature. 1990;345:127–131. 10.1038/345127a0 [Google Scholar]
- Chubachi S, Kajawara R. Total ozone variations at Syowa, Antarctica. Geophys. Res. Lett. 1986;13:1197–1198. [Google Scholar]
- Grobecker A.J, editor. CIAP (Climatic Impacts Assessment Program) Monogr. 1. The natural stratosphere of 1974. US Department of Transportation, DOT-TST-75-51; Washington, DC: 1975. [Google Scholar]
- Cicerone R.J, Oremland R.S. Biogeochemical aspects of atmospheric methane. Global Biogeochem. Cycles. 1988;2:299–327. [Google Scholar]
- Cornu M.-A. Sur la limite ultra-violette du spectra solaire. Compt. Rendus. 1879;88:1101–1108. [Google Scholar]
- Crutzen P.J. The influence of nitrogen oxides on the atmospheric ozone content. R. Meteorol. Soc. Q. J. 1970;96:320–325. [Google Scholar]
- Crutzen P.J. Ozone production rates in an oxygen–hydrogen–nitrogen oxide atmosphere. J. Geophys. Res. 1971;76:7311–7327. [Google Scholar]
- Crutzen P, Arnold F. Nitric acid cloud formation in the cold Antarctic stratosphere: a major cause for the springtime “ozone hole”. Nature. 1986;324:651–655. 10.1038/324651a0 [Google Scholar]
- DeFabo E.C. Ultraviolet-B radiation and stratospheric ozone loss: potential impacts on human health in the Arctic. Int. J. Circumpolar Health. 2000;59:4–8. [PubMed] [Google Scholar]
- DeFabo E.C, Noonan F.P, Fears T, Merlino G. Ultraviolet B but not Ultraviolet A radiation initiates melanoma. Cancer Research. 2004;64:6372–6376. doi: 10.1158/0008-5472.CAN-04-1454. 10.1158/0008-5472.CAN-04-1454 [DOI] [PubMed] [Google Scholar]
- DeGruijl Skin cancer and solar UV radiation. Eur. J. Cancer. 1999;35:2003–2009. doi: 10.1016/s0959-8049(99)00283-x. 10.1016/S0959-8049(99)00283-X [DOI] [PubMed] [Google Scholar]
- deZafra R.L, Jaramillo M, Parrish A, Solomon P, Barrett J. High concentrations of chlorine monoxide at low altitudes in the Antarctic spring stratosphere: Diurnal variation. Nature. 1987;328:408–411. 10.1038/328408a0 [Google Scholar]
- Dlugokencky E, Masarie K, Lang P, Tans P. Continuing decline in the growth rate of the atmospheric methane burden. Nature. 1998;393:447–450. 10.1038/30934 [Google Scholar]
- Dütsch H.U. Atmospheric ozone—a short review. J. Geophys. Res. 1970;75:1707–1712. [Google Scholar]
- Etheridge D, Steele L, Francey R, Langenfelds R. Atmospheric methane between 1000 AD and the present: evidence of anthropogenic emissions and climatic variability. J. Geophys. Res. 1998;103:15 979–15 993. 10.1029/98JD00923 [Google Scholar]
- Farman J.C, Gardiner B.G, Shanklin J.D. Large losses of ozone in Antarctica reveal seasonal ClOx/NOx interaction. Nature. 1985;315:207–210. 10.1038/315207a0 [Google Scholar]
- Harris N.R.P, Rowland F.S. Trends in total ozone at Arosa. EOS. 1986;67:875. [Google Scholar]
- Hartley W.N. On the absorption spectrum of ozone. J. Chem. Soc. 1881a;39:57–61. [Google Scholar]
- Hartley W.N. On the absorption of solar rays by atmospheric ozone. J. Chem. Soc. 1881b;39:111–128. [Google Scholar]
- Heidt L.E, Lueb R, Pollock W, Ehhalt D.H. Stratospheric profiles of CCl3F and CCl2F2. Geophys. Res. Lett. 1975;2:445–447. [Google Scholar]
- Homer 3000 BC (?) The Iliad. ‘As a huge oak goes down at a stroke from Father Zeus, ripped by the roots and a grim reek of sulphur bursts forth…’ Book 14, lines 489–494 The Odyssey ‘Then, then in the same breath Zeus hit the craft with a lightning bolt and thunder. Round, she spun, reeling under the impact, filled with reeking brimstone’ Book 12, lines 447–449 and Book 14, lines 344–346 (duplicate passages) translations by Robert Fagles.
- Johnston H.S. Reduction of stratospheric ozone by nitrogen oxide catalysts from supersonic transport exhaust. Science. 1971;173:517–522. doi: 10.1126/science.173.3996.517. [DOI] [PubMed] [Google Scholar]
- Jones R.L, Pyle J.A, Harries J.E, Zavody A.M, Russell J.M, Gille J.C. The water vapor budget of the stratosphere studied using LIMS and SAMS satellite data. Q. J. R. Meterol. Soc. 1986;112:1127–1143. 10.1256/smsqj.47411 [Google Scholar]
- JPL (Jet Propulsion Laboratory) Publication 02-25 2003 Chemical kinetics and photochemical data for use in atmospheric studies, Evaluation number 14.
- Kerr J.B, McElroy C.T. Evidence for large upward trends of ultraviolet-B radiation linked to ozone depletion. Science. 1993;262:1032–1034. doi: 10.1126/science.262.5136.1032. [DOI] [PubMed] [Google Scholar]
- Lovelock J.E, Maggs R.J, Wade R.J. Halogenated hydrocarbons in and over the Atlantic. Nature. 1973;241:194–196. 10.1038/241194a0 [Google Scholar]
- McCormick M.P, Steele H.M, Hamill P, Chu W.P, Swissler T.J. Polar stratospheric cloud sightings by SAM II. J. Atmos. Sci. 1982;3:1387–1397. 10.1175/1520-0469(1982)039%3C1387:PSCSBS%3E2.0.CO;2 [Google Scholar]
- Migeotte M.V. On the presence of CH4, N2O and NH3 in the Earth's atmosphere. In: Kuiper G.P, editor. The atmospheres of the Earth and planets. University of Chicago Press; Chicago, IL: 1949. p. 284. [Google Scholar]
- Molina L.T, Molina M.J. Production of Cl2O2 from the self-reaction of the ClO radical. J. Phys. Chem. 1987;91:433–436. 10.1021/j100286a035 [Google Scholar]
- Molina M.J, Rowland F.S. Chlorine atom-catalysed destruction of ozone. Nature. 1974;249:810–812. 10.1038/249810a0 [Google Scholar]
- Molina M.J, Tso T.-L, Molina L.T, Wang F.C.-Y. Antarctic stratospheric chemistry of chlorine nitrate, hydrogen chloride and ice. Release of active chlorine. Science. 1987;238:1253–1260. doi: 10.1126/science.238.4831.1253. [DOI] [PubMed] [Google Scholar]
- NAS (National Academy of Sciences) Climatic Impact Committee; Washington, DC: 1975. Environmental Impact of stratospheric flight, biological and climatic effects of aircraft emissions in the stratosphere. [Google Scholar]
- NAS (National Academy of Sciences) 1982 causes and effects of stratospheric ozone reduction: an update. Washington, DC, Commission on Chemistry & Physics. Ozone depletion, Commission on Biology. Effects increased solar ultraviolet radiation. 339 pp.
- Newman P, Schoeberl M. October Antarctic temperature and total ozone trends from 1979–1985. Geophys. Res. Lett. 1986;13:1206–1209. [Google Scholar]
- Nolte P. Christian Friedrich Schönbein: Ein Leben fur die Chemie, Sonderreihe A der Metzinger Heimatblatter. Band. 1999;5:312. [Google Scholar]
- Prather M, Midgley P, Rowland F.S, Stolarski R. The ozone layer: the road not taken. Nature. 1996;381:551–554. 10.1038/381551a0 [Google Scholar]
- Prinn R, Cunnold D, Rasmussen R, Simmonds P.K, Alyea F, Crawford A, Fraser P, Rosen R. Atmospheric trends in methylchloroform and the global average for the hydroxyl radical. Science. 1987;238:945–950. doi: 10.1126/science.238.4829.945. [DOI] [PubMed] [Google Scholar]
- Rowland F.S. Stratospheric ozone depletion by chlorofluorocarbons. Ambio. 1990;19:281–292. [Google Scholar]
- Rowland F.S. Stratospheric ozone depletion. Annu. Rev. Phys. Chem. 1991;42:731–768. 10.1146/annurev.pc.42.100191.003503 [Google Scholar]
- Rowland F.S, Molina M.J. Chlorofluoromethanes in the environment. Rev. Geophys. Space Phys. 1975;13:1–35. [Google Scholar]
- Rowland F.S, Sato H, Khwaja H, Elliott S.M. The hydrolysis of chlorine nitrate and its possible atmospheric significance. J. Phys. Chem. 1986;90:1985–1988. 10.1021/j100401a001 [Google Scholar]
- Rowland F.S, Harris N.R.P, Bojkov R.D, Bloomfield P. Statistical error analyses of ozone trends: winter depletion in the northern hemisphere. In: Bojkov R.D, Fabian P, editors. Ozone in the Atmosphere. Deepak Publishing; Hampton, VA: 1989. pp. 71–75. [Google Scholar]
- Sato, H. & Rowland, F. S. 1984 Paper presented at the International Meeting on Current Issues in our Understanding of the Stratosphere and the Future of the Ozone Layer, Feldafing, West Germany.
- Schmeltekopf A.L, et al. Measurements of stratospheric CFCl3, CF2Cl2 and N2O. Geophys. Res. Lett. 1975;2:393–396. [Google Scholar]
- Schütz K, Junge C, Beck R, Albrecht B. Studies of atmospheric N2O. J. Geophys. Res. 1970;75:2230–2246. [Google Scholar]
- Scotto J, Cotton G, Urbach F, Berger D, Fears T. Biologically effective ultraviolet radiation: surface measurements in the United States, 1974 to 1985. Science. 1988;239:762–764. doi: 10.1126/science.3340857. [DOI] [PubMed] [Google Scholar]
- Sekiguchi Y. Antarctic temperature and total ozone trends from 1979–1985. Geophys. Res. Lett. 1986;13:1206–1209. [Google Scholar]
- Simpson I, Blake D.R, Rowland F.S, Chen T.-Y. Implications of the recent fluctuations in the growth rate of tropospheric methane. Geophys. Res. Lett. 2002;29:117-1–117-4. plus supplementary data. [Google Scholar]
- Singer S.F. Stratospheric ozone: science and policy. In: Singer S.F, editor. Global climate change. Paragon House; New York: 1989. pp. 157–162. [Google Scholar]
- Solomon S, Garcia R.R, Rowland F.S, Wuebbles D.J. On the depletion of Antarctic ozone. Nature. 1986;321:755–758. 10.1038/321755a0 [Google Scholar]
- Stolarski R, Cicerone R.J. Stratospheric chlorine: a possible sink for ozone. Can. J. Chem. 1974;52:1610–1615. [Google Scholar]
- Stolarski R.S, Krueger A.J, Schoeberl M.R, McPeters R.D, Newman P.A, Alpert J.C. Nimbus 7 SBUV/TOMS measurements of the springtime Antarctic ozone decrease. Nature. 1986;322:808–811. 10.1038/322808a0 [Google Scholar]
- Tolbert M.A, Rossi M.J, Malhotra R, Golden D.M. Reaction of chlorine nitrate with hydrogen chloride and water at Antarctic stratospheric temperatures. Science. 1987;238:1258–1260. doi: 10.1126/science.238.4831.1258. [DOI] [PubMed] [Google Scholar]
- Toon O.B, Hamill P, Turco R.P, Pinto J. Condensation of HNO3 and HCl in the winter polar stratosphere. Geophys. Res. Lett. 1986;13:1284–1287. [Google Scholar]
- Weatherhead E.C, Tiao G.C, Reinsel G.E, Frederick J.E, DeLuisi J.J, Choi D.S, Tam W.K. Analysis of long-term behavior of ultraviolet radiation measured by Robertson–Berger meters at 14 sites in the United States. J. Geophys. Res. 1997;102:8737–8754. 10.1029/96JD03590 [Google Scholar]
- WMO (World Meteorological Organization) Report No. 16, 3 Volumes 1986, Atmospheric ozone 1985, Global ozone research and monitoring project, 1150 p.
- WMO (World Meteorological Organization) Report No. 18 Volume 1, 1990 Report of the International Ozone Trends Panel, Chapter Four, ‘Trends in Total column ozone measurements’, Rowland, F. S., Chair, pp. 181–382.
- WMO (World Meteorological Organization) Report No. 47, 2003 Scientific assessment of ozone depletion: 2002, Global research and monitoring project.


