

Abstract
The transcription activator SREBP-1c (sterol-regulatory-element-binding protein-1c) is induced by insulin in the liver and is considered a master regulator of lipogenic genes such as FASN (fatty acid synthase). The question of whether SREBP-1c is also a mediator of insulin action on the regulatory enzyme of glucose metabolism GCK (glucokinase) is controversial. In the present paper, we induced SREBP-1c to various levels with insulin or the liver X receptor ligand T0901317 in primary hepatocytes and asked if these levels correlated with those of GCK or FASN mRNA expression, using the latter as positive control. Insulin and T0901317 triggered the accumulation of precursor and processed forms of SREBP-1c to similar levels and with comparable kinetics, and both effectors together caused synergistic increases in SREBP-1c protein levels. These effects were accompanied by commensurate elevation of FASN mRNA, notably by a synergistic response to both effectors. By contrast, GCK mRNA was unresponsive to T0901317 and was induced only by insulin. Treatment of hepatocytes with insulin and/or T0901317 resulted in the recruitment of SREBP-1c to the FASN promoter as shown by chromatin immunoprecipitation, whereas SREBP-1c did not bind to the GCK promoter. Lastly, we observed that the glycogen synthase kinase-3 inhibitor SB216763 produced a small increase in SREBP-1c protein level, which was further augmented in the presence of T0901317. The level of FASN mRNA varied in parallel with SREBP-1c, while GCK mRNA was unaffected. Collectively, these results showed that increases in SREBP-1c were neither necessary nor sufficient for GCK induction in hepatocytes, while at the same time they underscored the role of SREBP-1c as a key regulator of FASN.
Keywords: fatty acid synthase, glucokinase, glycogen synthase kinase-3, insulin, liver
Abbreviations: ACC, acetyl-CoA carboxylase; CAT, chloramphenicol acetyltransferase; ChIP, chromatin immunoprecipitation; CYP7A1, cytochrome P450, family 7, subfamily A, polypeptide 1; ECL, enhanced chemiluminescence; FAK, focal adhesion kinase; FASN, fatty acid synthase; FBS, foetal bovine serum; GCK, glucokinase; GSK-3, glycogen synthase kinase-3; LXR, liver X receptor; LXRE1, LXR binding element 1; qPCR, quantitative PCR; RT, reverse transcription; SREBP-1c, sterol-regulatory-element-binding protein 1c; SRE, sterol-regulatory element
INTRODUCTION
In hepatocytes, insulin, in the presence of sufficient glucose levels, stimulates the transcription of a battery of genes, such as those encoding the two critical enzymes of lipogenesis ACC (acetyl-CoA carboxylase) and FASN (fatty acid synthase) [1,2]. The transcriptional activator SREBP-1c (sterol-regulatory-element-binding protein-1c) is considered to be a master regulator for the co-ordinate induction of the lipogenic genes [3], on the basis of the following evidence. Firstly, binding sites for SREBP-1c, called SREs (sterol-regulatory elements), were identified in the promoters of ACC and FASN amongst others [4–7]. Second, SREBP-1c is itself transcriptionally induced in hepatocytes in response to insulin, suggesting that it might act as an early response gene for insulin and in turn up-regulate the transcription of secondary target genes [8–10]. Third, overexpression of active SREBP-1c in the livers of transgenic animals, or in hepatocytes transduced with viral vectors, is accompanied by co-ordinate increases in the levels of the lipogenic enzymes [11,12]. Last, the induction of the lipogenic genes during the fasting-refeeding transition is reduced in the livers of mice with targeted inactivation of the SREBP genes [13].
GCK (glucokinase) is a flux-controlling enzyme for glycogen synthesis and glycolysis in the liver [14]. It is robustly induced at the transcriptional level in insulin-treated animals or in hepatocytes challenged with insulin [15,16]. Insulin induction of hepatic GCK is essential for restraining hepatic glucose output, an important facet of glucose homoeostasis. Whether liver GCK, like the lipogenic enzymes, might be a target gene for SREBP-1c-mediated induction has remained controversial. Overexpression of mature SREBP-1c in hepatocytes resulted in marked elevations of GCK mRNA in one study [12] but not in another [17]. More recently, DNA elements of the SRE type were identified in the rat GCK gene promoter and binding of SREBP-1c to the GCK promoter in the livers of fasted-re-fed rats was detected by ChIP (chromatin immunoprecipitation) [18]. However, we and others have argued that the induction of hepatic SREBP-1c gene expression by insulin was too slow to account for the transcriptional stimulation of the GCK gene [19,20]. Furthermore, knockdown of SREBP-1c in hepatocytes using small interfering RNA failed to inhibit insulin induction of GCK [20].
Our objective was to obtain evidence for or against a determinant role of SREBP-1c in insulin induction of GCK in primary hepatocytes, using the induction of FASN as a positive control. The time-course of accumulation of SREBP-1c mRNA and protein after insulin stimulation of hepatocytes was established and compared with the kinetics of induction of FASN and GCK mRNA. Hepatocytes were also challenged with the LXR (liver X receptor) agonist T0901317 or the GSK-3 (glycogen synthase kinase-3) inhibitor SB216763 to induce SREBP-1c to various levels and to correlate these levels with the increases in FASN and GCK mRNAs. Importantly, the binding of SREBP-1c to the FASN and GCK promoters during the induction process was assayed using ChIP assays.
EXPERIMENTAL
Materials
The LXR ligand T0901317 was purchased from Alexis Corporation and the GSK-3 inhibitor SB216763 from Tocris Bioscience.
The following products were from Santa Cruz Biotechnology Inc.: protein A/G PLUS-Agarose (sc-2003), rabbit anti-SREBP-1 antibody (H-160; sc-8984), mouse monoclonal anti-SREBP1 antibody (2A4; sc-13551) and normal rabbit IgG (sc-2027). Rabbit antibodies to FAK (focal adhesion kinase) phosphorylated at Ser722 was purchased from BioSource International Inc. The JumpStart™ ReadyMix™ Taq system was from Sigma. The RNeasy Mini Kit for isolation of RNA was from Qiagen Gmbh. The ImProm-II RT (reverse transcription) system was from Promega Corporation and the SYBR® Green PCR Master Mix from Applied Biosystems. The SuperSignal West Dura Extended Duration and the SuperSignal West Pico Substrates for ECL (enhanced chemiluminescence) were bought from Pierce Biotechnology.
Primary culture of hepatocytes
Hepatocytes from adult male Wistar rats fasted for 2 days prior to the experiments were isolated and placed in culture as described previously [21], except that gentamycin at a concentration of 50 μg/ml was used as the antibiotic in all perfusion and culture media. The cells were allowed to attach to culture dishes for 3 h in seeding medium containing 10% (v/v) FBS (foetal bovine serum) and further cultured for 4 to 5 h in maintenance medium containing 4% (v/v) FBS and 10−8 M dexamethasone. Culture was then continued in serum-free dexamethasone-containing medium until the end of the experiments. Insulin and other effectors were generally added to cells 23 h after seeding, or as specified in the Figure legends. Stock solutions of T0901317 and SB216763 were in DMSO. The final concentration of DMSO in culture medium was at most 0.8% and was also present in the medium of control cells.
ChIP assay
Hepatocytes in 15-cm-diameter dishes containing 15×106 cells per dish (two dishes per treatment condition) were washed with ice-cold PBS containing 10 mM sodium phosphate buffer, pH 7.4, and 140 mM NaCl. A cross-linking solution containing 1% (w/v) formaldehyde in PBS (20 ml per dish) was added to the monolayers to fix the cells. After 10 min at room temperature (20 °C), the cross-linking solution was removed and a stop solution containing 125 mM glycine in PBS (20 ml per dish) was added for 5 min at room temperature to terminate the cross-linking. Cells were washed in ice-cold PBS and scraped into 3.5 ml of ice-cold PBS containing 1 mM PMSF, 2 μg/ml aprotinin and 2 μg/ml leupeptin. The cells were centrifuged at 500 g at 4 °C for 5 min and resuspended in 1.4 ml of ChIP lysis buffer [30 mM Tris/HCl, pH 8.0, 6 mM Na2EDTA, 0.2% SDS, 1% (w/v) Triton X-100 and protease inhibitors as above]. The cells were lysed by three cycles of freezing-thawing and vigorous vortexing. The lysates were placed in an ice-slurry and sonicated using a W380 sonicator (Ultrasonics Heat Systems) fitted with a microprobe and set at 5 s, 50% duty cycle, output 5/10 for a total time of 5 min to shear DNA to an average fragment length of 500 bp. The samples were centrifuged at 12000 g at 4 °C for 10 min and the supernatants were collected and diluted 1:1 with a dilution buffer [335 mM NaCl, 1% (w/v) Triton X-100, 2 μg/ml aprotinin and 2 μg/ml leupeptin]. To reduce non-specific adsorption during subsequent immunoprecipitation, 1.6 ml samples of sheared chromatin were incubated with 40 μl of packed protein A/G PLUS-Agarose beads that had been saturated with salmon sperm DNA and equilibrated with 15 mM Tris/HCl, pH 8.0, 167 mM NaCl, 3 mM Na2EDTA, 0.1% SDS, 1% (w/v) Triton X-100 and protease inhibitors. After 3 h of mixing on a rocking platform at 4 °C, the beads were pelleted by centrifugation at 13000g for 2 min at 20 °C, and the supernatants were divided into two 600 μl aliquots for incubation with specific antibodies or preimmune rabbit IgGs and a 250 μl sample that was stored at 4 °C as input chromatin.
The samples of precleared chromatin were incubated overnight at 4 °C with 24 μg of rabbit anti-SREBP-1 (H-160) antibody or non-immune rabbit IgGs. Next, 20 μl of protein A/G-PLUS-Agarose beads, prepared as described above, were added to the samples and incubated for 4 h at 4 °C with constant rocking. The agarose beads were pelleted and washed several times at room temperature with the following buffers: four washes with 700 μl of NaCl wash buffer [20 mM Tris/HCl, pH 8.0, 300 mM NaCl, 2 mM Na2EDTA, 0.1% SDS and 1% (w/v) Triton X-100]; three washes with LiCl wash buffer [10 mM Tris/HCl, pH 8.0, 300 mM LiCl, 2 mM Na2EDTA, 1% (w/v) Nonidet P-40 and 1% sodium deoxycholate]; and two washes with TE buffer (10 mM Tris/HCl, pH 8.0 and 1 mM Na2EDTA). Chromatin complexes were eluted from the washed beads by three sequential incubations at room temperature (twice for 15 min and once for 45 min) in 90 μl of elution buffer [100 mM NaHCO3 and 1% (w/v) SDS]. To reverse the cross-links and digest RNA, NaCl was added to a final concentration of 300 mM with 30 μg/ml RNase A and the samples were incubated at 67 °C for 5 h. Proteins were digested with 55 μg/ml of proteinase K at 55 °C for 12 h. The DNA was isolated by phenol/chloroform extraction and ethanol precipitation using 10 μg of glycogen as a carrier. The DNA precipitates were dissolved in 20 μl of TE buffer diluted one in three in water. The samples of input chromatin were subjected to similar procedures for reversal of cross-links, digestion of RNA and protein, and isolation of DNA. The DNA concentration in input chromatin samples was assayed by measuring the light absorbance at 260 nm.
The isolated DNA samples were subjected to PCR for the amplification of gene regions of interest using the JumpStart™ ReadyMix™ Taq system in 50 μl reactions. Samples of 10 ng of input DNA or 0.2 to 1 μl of immunoprecipitated DNA (normalized to the yield of DNA in chromatin input) were used as template. The PCR program included 33 to 35 cycles with denaturation at 95 °C, annealing at 57 °C and elongation at 72 °C, each for 30 s except for the initial three cycles during which the denaturation step was for 45 s and annealing for 60 s and the final cycle in which the elongation step was for 5 min. Each PCR reaction was performed in duplex mode, with one pair of primers for amplification of the GCK or FASN promoter and one pair of primers for a fragment of intron 8 in the GCK gene. This region was devoid of putative SREs according to computer analysis using the TESS (transcription element search system) and served to estimate non-specific chromatin binding during the immunoprecipitation procedure. The forward and reverse primers for the GCK promoter were: 5′-GGCTCCTCATGCCTACCTGTTTCG-3′ and 5′-GGCTCCTGAAATACCCTGCCTAGTG-3′, encompassing the promoter region from −267 to −17 relative to the start of transcription. The forward and reverse primers for the FASN promoter were: 5′-GCGCGGGCATCACCCCACCGACG-3′ and 5′-CGGCCTGCCATCCCGGAACCCCG-3′, encompassing the promoter region from−157 to +116. The forward and reverse primers for intron 8 of the GCK gene were: 5′-GTTCCTTTTACAGCAAGCCAGGCC-3′ and 5′-GATGGCAGTGCCATATTCTCCGAG-3′. For analysis, the PCR products were electrophoresed in 2.5% agarose gels in 90 mM Tris, 90 mM boric acid, 2 mM EDTA containing 1 μg/ml ethidium bromide. The gels were imaged under UV-light transillumination using a ChemiDoc XRS instrument (BioRad) and fluorescent light emission of the promoter and intron bands was quantified using the Quantity One software (BioRad). The ratio of promoter band intensity to intron band intensity was calculated. Results were expressed as fold-enrichment relative to the value in control cells.
Isolation of RNA and mRNA assays
Total RNA was isolated from hepatocytes grown in 10-cm diameter culture dishes using the RNeasy Mini Kit. Samples of RNA (1 μg) were reverse transcribed using the ImProm-II RT system according to the manufacturer's instructions, using random primers and 4 mM MgCl2 in a total reaction volume of 20 μl. At the end of this reaction, samples of the reaction mixes were diluted 1:100 with water and 5 μl aliquots of diluted mix were subjected in triplicate to qPCR (quantitative PCR) in 96-well format using SYBR® Green Master Mix in total reaction volumes of 25 μl. The primers were used at a concentration of 0.2 μM. Primer pairs for each mRNA were selected in separate exons. Moreover, one primer of each pair was designed to straddle an exon-exon junction. The sequences of the GCK primers were: forward, 5′-ACAAGTGGAGAGCGACTCCG-3′ and reverse, 5′-GAGTGGACACGCTTTCACAGG-3′. The sequences of the FASN primers were: forward, 5′-CAGGTGTGTGATGGGAAGG-3′ and reverse, 5′-CCGTACACTCACTCGAGGC-3′. The sequences of the SREBP-1c primers were: forward, 5′-CATGGATTGCACATTTGAAGAC-3′; reverse, 5′-GCAGGAGAAGAGAAGCTCTCAG-3′. The sequences of the CYP7A1 (cytochrome P450, family 7, subfamily A, polypeptide 1) primers were: forward, 5′-CTACCCAGACCCTTTGACTTTC-3′; reverse, 5′-CTGATCCGAAGGGCATGTAG-3′. Calibrator mRNAs were the mRNAs for ribosomal protein S26 or ribosomal protein S29 in various experiments. The sequences of the primers for ribosomal protein S26 mRNA were: forward, 5′-GTCTTCGACGCTTACGTGC-3′; reverse, 5′-CAGGTCTGAATCGTGGTGG-3′. The sequences of the primers for ribosomal protein S29 mRNA were: forward, 5′-GCTGAACATGTGCCGACAGT-3′; reverse, 5′-GGTCGCTTAGTCCAACTTAATGAAG-3′. Real-time qPCR was performed in the Prism 7000 Sequence Detection System (Applied Biosystems). Relative mRNA levels were calculated by the ΔCt method using as reference the RNA from cells before addition of effectors (time-point 0) or cells incubated with the vehicle DMSO, as specified in the Figure legends. ΔCt values for test mRNAs were corrected for ΔCt values of the calibrator mRNA, which were minimal in all cases.
Isolation of protein and immunoblotting
Hepatocytes in six-well plates (1×10⁶ cells per well) were washed in 2 ml of ice-cold PBS. To extract total cell protein for SREBP1 analysis, monolayers were overlaid with 170 μl of ice-cold lysis buffer (10 mM Hepes, pH 7.9, 10 mM KCl, 1 mM Na2EDTA, 0.5 mM EGTA, 1 mM dithiothreitol, 0.6% Nonidet P-40, 0.5 mM sodium orthovanadate, 0.2 mM benzamidine, 1 mM PMSF, 2 μg/ml aprotinin and 2 μg/ml leupeptin). The dishes were placed on ice for 10 min and cells were scraped in the lysis buffer with plastic spatulas. The lysates were collected in microfuge tubes and were mixed by vigorous vortexing for 1 min. The lysed cells were centrifuged at 13000 g at 4 °C for 10 min. The protein concentration of the supernatants was measured using the Bradford method, and proteins were resolved by electrophoresis in 8% (w/v) polyacrylamide gels, containing SDS, generally using 50 μg of protein per lane. Transfer to nitrocellulose membranes and immunoblotting were as described previously [21,22]. Mouse monoclonal anti-SREBP1 antibody (2A4) was used for immunoblotting. Immunoreactive bands were revealed by ECL using the SuperSignal West Dura Extended Duration Substrate (Pierce) and exposure to X-ray film. Films were scanned on an ImageScanner from Amersham Biosciences and quantification of band density was done using the ImageQuant software (Amersham Biosciences). Cell extracts for analysis of phosphorylated FAK were prepared as described above, except that the lysis buffer was Cell Lysis Buffer from Cell Signaling Technology, supplemented with 1 mM dithiothreitol and 1 mM PMSF. Immunoblots of phosphorylated FAK were processed for ECL detection using the conventional SuperSignal West Pico Substrate.
RESULTS
Effects of T0901317 and insulin on binding of SREBP-1c to the FASN and GCK promoters
The occupancy of the FASN and GCK gene promoters by SREBP-1c was investigated in hepatocytes treated with the LXR agonist T0901317 and insulin, two known inducers of SREBP-1c. Primary hepatocytes were cultured in the presence of T0901317 for 17 h. Where provided, insulin was added to the cells, in the continued presence of T0901317, for the last hour of treatment. At the end of these treatments, the hepatocytes were processed for ChIP analysis in order to assay the binding of SREBP-1c to the FASN and GCK promoters. The SREBP1 ChIP samples were subjected to duplex PCR reactions, with amplification of both the promoter region of interest and a region in intron 8 of the GCK gene, which was used as neutral DNA, presumably devoid of SREBP-1c binding sites. As shown in Figure 1(A), specific binding of SREBP-1c was detected on the FASN promoter after treatment of the hepatocytes for 17 h with T0901317 alone. The addition of insulin to the T0901317-treated cells for the last hour of treatment did not appear to enhance SREBP-1c binding to the FASN promoter. In sharp contrast, we were unable to detect specific binding of SREBP-1c to the GCK promoter region after each of these treatments. The GCK promoter segment amplified by PCR was the region in which putative SREBP-1c binding sites were identified by other authors [18]. A quantitative analysis of four separate experiments (Figure 1B) shows an approx. 3.5-fold enrichment of the FASN promoter region in SREBP1 chromatin immunoprecipitates from hepatocytes treated with T0901317 alone, and no further enrichment upon addition of insulin for the last hour of treatment. There was no enrichment of the GCK promoter region in the same ChIP samples, indicating the apparent failure of SREBP-1c to bind to the GCK promoter under conditions in which the transactivator was recruited to the FASN promoter (Figure 1B). Control immunoprecipitates using non-specific rabbit IgGs instead of the anti-SREBP1 (H-160) antibody did not display enrichment of either promoter under any treatment (results not shown).
Figure 1. Recruitment of SREBP-1c to the FASN promoter and lack of binding to the GCK promoter in hepatocytes induced for SREBP-1c expression by T0901317.
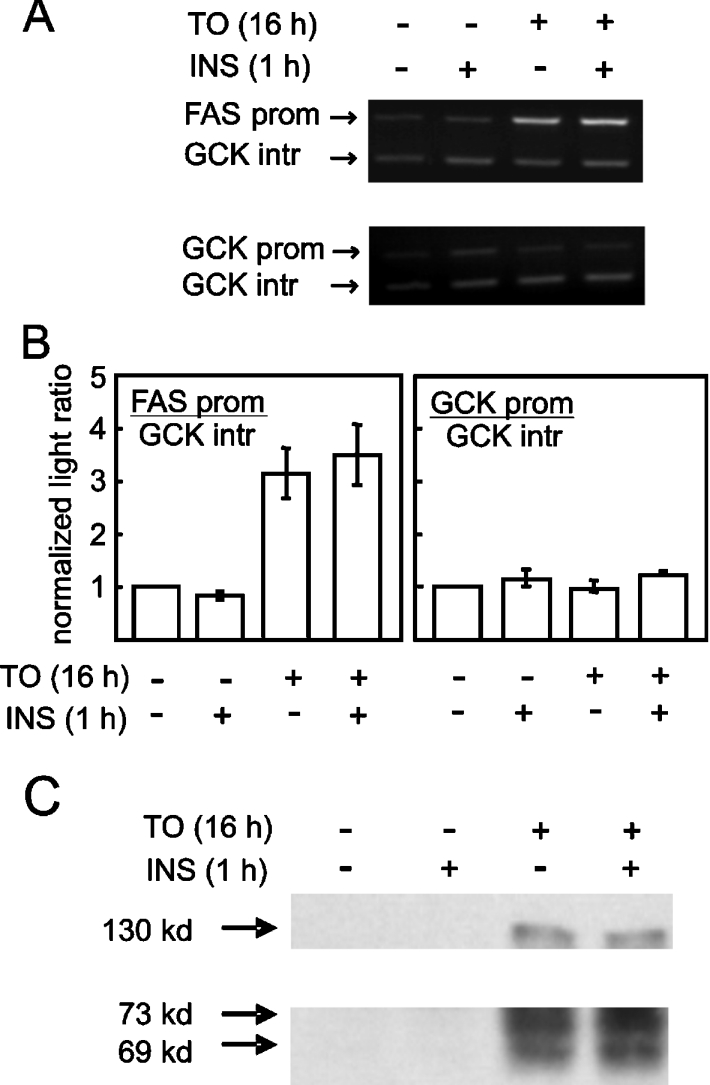
Primary rat hepatocytes were placed in culture as described in the Experimental procedures section. After 8 h, the hepatocytes were stimulated with 10 μM T0901317 and culture was continued in the presence of T0901317 for 17 h. Where indicated, cells were induced with 30 nM insulin in addition to T0901317 for the last hour of treatment. Other hepatocytes were treated with insulin alone for 1 h. The cells were then harvested for ChIP assay of SREBP-1c binding to the FASN and GCK promoters (panels A and B) or for immunoblot analysis of SREBP-1c precursor and processed forms (C). (A) FASN and GCK promoter products and GCK intron product after PCR amplification of ChIP with anti-SREBP1 antibody. The specific gene regions were amplified by PCR and products were electrophoresed in agarose gels containing ethidium bromide. The images represent gels visualized by UV transillumination. (B) Enrichment of the FASN promoter (left-hand panel) but not the GCK promoter (right-hand panel) in chromatin precipitated with anti-SREBP1 antibody after the indicated cell treatments. Enrichment factor was calculated as described in the Experimental procedures section. Results are means±S.E.M. of three separate experiments. Control immunoprecipitates generated with normal rabbit IgG did not reveal significant enrichment of either promoter under any condition (results not shown). (C) Immunoblot of SREBP-1c precursor (upper panel) and processed forms (lower panel) in hepatocytes under various treatments. The experiment was performed three times with similar results. kd=kDa.
The stimulation of SREBP-1c binding to the FASN promoter in hepatocytes treated with T0901317 alone, with no further enhancement by the addition of insulin for 1 h, was unexpected. According to a recent study by Hegarty et al. [23], one would predict that the precursor form of SREBP-1c would mostly accumulate in hepatocytes induced with T0901317 alone, and that processing to the active transactivator capable of binding to target genes would require subsequent insulin action. This discrepancy prompted us to perform immunoblot analyses of the SREBP1 forms in hepatocytes under the present treatment conditions. As shown in Figure 1(C), treatment for 17 h with T0901317 alone induced the appearance of an immunoreactive protein with an apparent molecular mass of 130 kDa, compatible with the full-length precursor form of SREBP-1c. More importantly, treatment with T0901317 alone was sufficient to elicit the de novo appearance of two processed forms of SREBP1 with apparent molecular masses of 69 and 73 kDa, consistent with the mature forms of the SREBP-1c that are known to migrate as a doublet in SDS/PAGE [24,25]. The abundance of these forms were not further increased in hepatocytes treated sequentially with T0901317 alone for 16 h, and then with both T0901317 and insulin for a further hour prior to harvest. Additionally, the 130 kDa SREBP1 precursor was not depleted in hepatocytes subjected to insulin action during the last hour of T0901317 treatment compared with hepatocytes treated with T0901317 alone, again failing to support the notion of a specific effect of insulin on the processing of SREBP-1c (Figure 1C). The monoclonal antibody used in our experiments, as well as in the study by Hegarty et al. [23], was raised against a polypeptide region common to both SREBP-1a and SREBP-1c and would in principle recognize both SREBP1 isoforms. However, SREBP-1c is by far the predominant isoform expressed in liver and primary hepatocytes. Moreover, SREBP-1c is the only isoform known to be inducible in hepatocytes under the conditions reported in the present paper.
Acute effects of insulin and T0901317 on SREBP-1c mRNA and protein levels
The next experiments were aimed at defining the time-course of effects of insulin and T0901317 on the levels of expression of SREBP-1c and putative target genes. Changes in SREBP-1c mRNA level in hepatocytes were measured over 8 h following the addition of insulin and T0901317, separately or in combination, to the culture medium. As shown in Figure 2(A), insulin caused a slow increase in SREBP-1c mRNA of approx. 2-fold after 1 h, 3-fold after 4 h and 12-fold after 8 h. Induction by T0901317 was more rapid, with a 4-fold induction after 1 h and a 6-fold induction at the 4 h time point. At the 8 h end-point, the effect of T0901317 was similar to that of insulin. The most striking finding was the highly synergistic response of hepatocytes to the combined treatment with insulin plus LXR agonist. In these hepatocytes, SREBP-1c mRNA increased 15-fold above basal after 1 h of treatment and reached levels more than 100-fold above basal at 8 h (Figure 2A).
Figure 2. Synergistic induction of SREBP-1c mRNA and protein by insulin and T0901317.

Primary hepatocytes were cultured for 23 h prior to addition of 30 nM insulin or 10 μM T0901317 or both together. At the indicated time points, cells were processed for isolation of total RNA or protein. (A) Time course of increase in SREBP-1c mRNA after addition of 30 nM insulin (□) or 10 μM T0901317 (○) or insulin plus T0901317 (△). mRNA levels were assayed by RT-qPCR. Results are the means±S.E.M. for four separate experiments. Note that the y-axis is discontinuous, with different scales in lower and upper parts of the plot. (B) Time-course of increase in 130 kDa SREBP-1c precursor (upper panel) and 69 and 73 kDa processed SREBP-1c (lower panel). The experiment was repeated three times with similar results. kd=kDa.
In parallel with the mRNA measurements, SREBP-1c expression was analysed at the protein level in hepatocytes acutely treated with insulin and T0901317. Neither precursor nor processed forms of SREBP-1c could be detected by immunoblotting analysis in the hepatocytes maintained in culture medium without inducer. After addition of insulin or T0901317 to the cells, traces of the processed 69 and 73 kDa forms of SREBP-1c became discernible after 1 h and the levels of these forms steadily increased between the 2 and 4 h time points (Figure 2B). The signal for the 130 kDa SREBP-1c presursor was in general weaker and became visible only after 4 h of treatment with either insulin or T0901317. Overall, the effect of T0901317 on processed SREBP-1c appeared to be slightly faster than the effect of insulin, in line with the stronger increase of SREBP-1c mRNA noted in T0901317-treated cells at early time points. Also consistent with the mRNA data, the combined treatment with insulin plus T0901317 exerted strong synergism on the levels of SREBP-1c protein forms. Most importantly, these experiments again provided no evidence for the preferential accumulation of full-length SREBP-1c precursor during treatment with T0901317. If anything, the ratio of the amounts of precursor over cleaved forms of SREBP-1c appeared somewhat lower in T0901317-treated compared with the insulin-treated hepatocytes.
Acute effects of insulin and T0901317 on SREBP-1c binding to putative target genes and on levels of cognate mRNAs
Having defined the early time-course of induction of SREBP-1c in hepatocytes challenged with insulin and T0901317, we investigated the binding of this transactivator to putative target promoters and the kinetics of changes in levels of the corresponding mRNAs. The occupancy of the FASN promoter by SREBP-1c as analysed by ChIP in untreated hepatocytes or hepatocytes treated for 4 h with insulin, T0901317 or both effectors, is shown in Figure 3(A). Insulin alone triggered the recruitment of SREBP-1c to the FASN promoter and the effect was further enhanced in hepatocytes treated with both insulin and T0901317. Stimulation with T0901317 alone produced only a small effect. The profile of induction of FASN mRNA in hepatocytes was investigated in parallel. As shown in Figure 3(C), treatment of the hepatocytes with T0901317 alone resulted in a modest 2- to 3-fold induction of FASN mRNA over the 8 h time course. Insulin was a more effective inducer, with 4- and 7-fold increases of FASN mRNA at 1 and 4 h of treatment respectively. When supplied together to hepatocytes, insulin and T0901317 produced additive effects on FASN mRNA which reached a level 15-fold above basal after 8 h of treatment. Together, these data are compatible with a key role of SREBP-1c in the transcriptional induction of the FASN gene in hepatocytes by insulin and LXR agonists.
Figure 3. Differential effects of insulin and T0901317 on binding of SREBP-1c to the FASN and GCK promoters and induction of mRNA expression.

Hepatocytes were cultured for 23 h prior to addition of 30 nM insulin or 10 μM T0901317 or both together. The cells were assayed for binding of SREBP-1c to the FASN (A) and GCK (B) promoters by ChIP, 4 h after addition of the inducers. Quantification was performed as described in the Experimental procedures. Results are means±S.E.M. of four independent experiments. Total RNA was isolated from hepatocytes at the indicated time points. Relative FASN (C), GCK (D) and CYP7A1 (E) mRNAs levels are shown for hepatocytes stimulated with 30 nM insulin (□) or 10 μM T0901317 (○) or insulin plus T0901317 (△). The mRNA assays were performed by RT-qPCR. Results are means±S.E.M. for at least four separate experiments.
The response of the GCK gene differed markedly from that of FAS. First, the ChIP assay failed to detect any binding of SREBP-1c to the GCK promoter under any of the conditions studied (Figure 3B). This was notably true in hepatocytes treated with insulin, in which the GCK mRNA was rapidly and massively induced, as expected from our previous studies (Figure 3D). Thus, insulin triggers robust induction of liver GCK without recruitment of SREBP-1c to its promoter. The second major difference with the FASN gene was the complete lack of effect on GCK of the LXR agonist T0901317, either by itself or in conjunction with insulin. The lack of effect of T0901317 on GCK mRNA was not due to inactivity of the treatment in the present hepatocytes. As shown in Figure 3(E), the key target gene of activated LXR in rodent species [26], CYP7A1, was rapidly and strongly induced by T0901317. Also in agreement with published results [27], and markedly different from GCK mRNA, the level of CYP7A1 mRNA was repressed in hepatocytes treated with insulin.
Role of GSK-3 in the regulation of SREBP-1c and target genes
Recent evidence indicated that the protein kinase GSK-3 could phosphorylate mature SREBP-1c, resulting in its ubiquitination and proteasomal degradation [28,29]. Since GSK-3 is inactivated in insulin stimulated cells through site-specific phosphorylation by protein kinase B [30], the possibility arose that increased stability of SREBP-1c, in addition to stimulated synthesis via mRNA induction, might contribute to the increase in SREBP-1c protein levels after cell stimulation by insulin. We wanted to test the effect of a pharmacological inhibitor of GSK-3, SB216763, on SREBP-1c and on potential target mRNAs in hepatocytes. The degree of inhibition of GSK-3 was estimated by analysing site-specific phosphorylation of Ser722 in FAK. This protein was recently shown to be an authentic substrate, both in vitro and in vivo, for phosphorylation at Ser722 by GSK-3 [31]. The phosphorylation state of Ser722 of FAK was therefore used as a reporter of GSK-3 activity in hepatocytes. In the current experiments, FAK phosphorylation at Ser722 was shown to be reduced dose-dependently by SB216763. The inhibition with 10 μM SB216763 was stronger (Figure 4A), faster and sustained for longer (Figure 4B) compared with that produced by 30 nM insulin (used as a maximal concentration of insulin in the hepatocyte system).
Figure 4. Inhibition of GSK3 by SB216763 and induction of SREBP-1c protein.
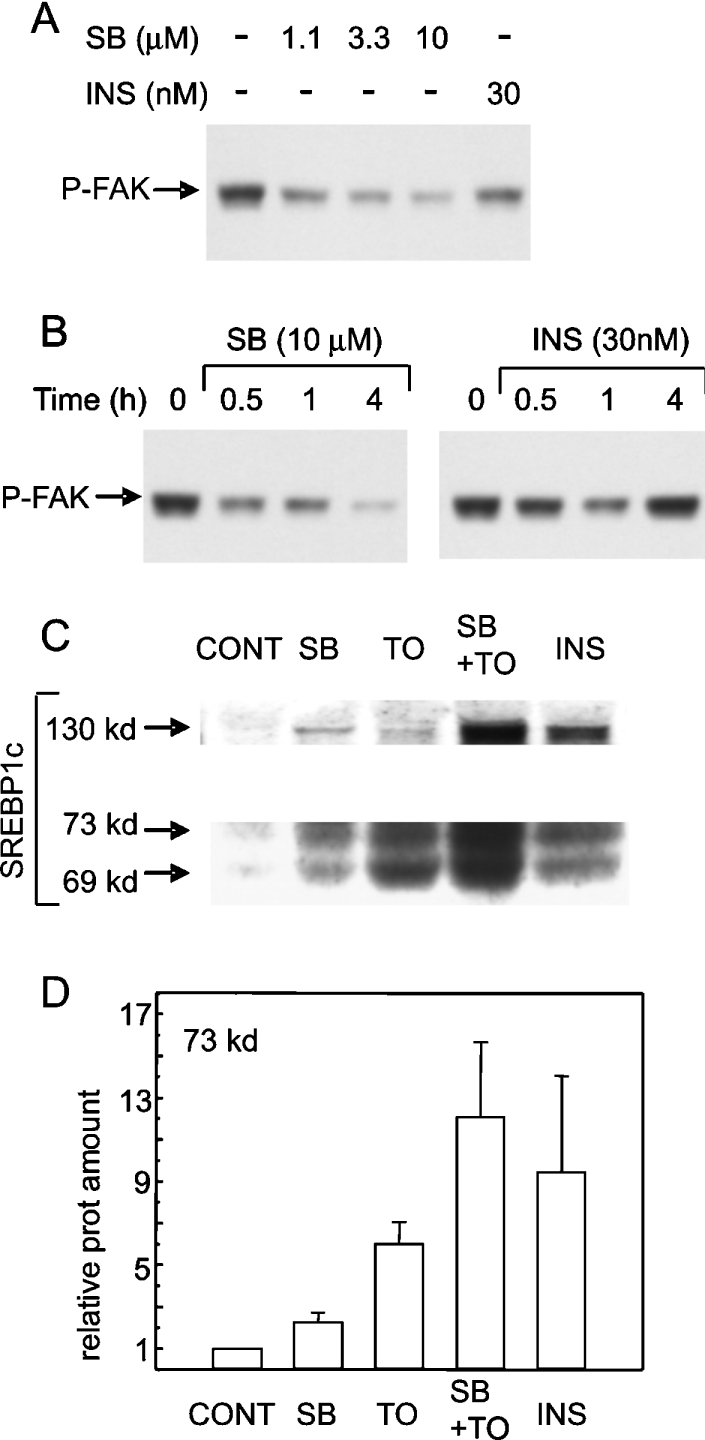
Primary hepatocytes in culture for 23 h were stimulated by the designated effectors. Dose–response at 1 h (A) and time course (B) of effects of SB216763 and insulin on the state of phosphorylation of FAK at Ser722 are shown. Images represent immunoblots using phosphospecific antibodies recognizing Ser722 of FAK only in the phosphorylated state. Levels of phosphorylated FAK were taken as an indication of cellular GSK3 activity. (C) The effects of 10 μM SB216763, 10 μM T0901317 or 30 nM insulin on levels of the 130 kDa SREBP-1c precursor (top panel) and 69 and 73 kDa processed forms (bottom panel). Hepatocytes were lysed for the extraction of total cell protein 6 h after addition of the specified effectors. (D) Quantification of the relative amounts of the 73 kDa processed form by scanning immunoblots. Results are means±S.E.M. for five experiments.
Protein extracts from hepatocytes after 6 h of treatment with 10 μM SB216763 alone, or SB216763 together with the LXR agonist T0901317, were used to analyse SREBP-1c protein levels. The combined treatment of the hepatocytes with SB216763 and T0901317 was performed to test the hypothesis that there would be an additive effect of stabilization of SREBP-1c by SB216763 and induction of its synthesis by T0901317. As shown in Figure 4(C), the full-length as well as the processed forms of SREBP-1c migrating as a doublet were modestly elevated in hepatocytes incubated with SB216763 alone. Hepatocytes treated with T0901317 displayed a stronger increase, comparable in amplitude to the effect seen in previous experiments. More interestingly, the effects of SB216763 and T0901317 were found to be additive, consistent with distinct mechanisms of action of the two drugs. Quantitative data from densitometer scanning of ECL films revealed that the amount of the 73 kDa cleaved form of SREBP-1c was increased approx. 2.5-fold by SB216763, 6-fold by T0901317 and 12-fold by SB216763 plus T0901317 (Figure 4D). The increase in amount of the 69 kDa form was quantitatively similar (results not shown). The effect of the combined treatment with SB216763 and T0901317 was comparable with that produced by insulin in the same hepatocyte cultures.
As a suspected target for regulation by SREBP-1c, FASN mRNA expression was assayed by RT followed by qPCR in hepatocytes subjected to 8 h of treatment with SB216763 alone, T0901317 alone, or both drugs together. After treatment with SB216763 alone, hepatocytes displayed a significant 2.5-fold elevation of FASN mRNA (Figure 5A). Culture of the hepatocytes with T0901317 produced a 3.5-fold increase in FASN mRNA, in agreement with experiments described earlier. The effects of SB216763 and T0901317 were additive, resulting in a 6-fold rise of FASN mRNA. The magnitude of this additive effect on FASN mRNA was comparable with the effect of insulin used as a reference inducer. In sharp contrast with the effects on FASN mRNA, there was no significant increase in GCK mRNA in the hepatocytes treated with SB216763 or T0901317 alone or in combination. Insulin was the only effective inducer of GCK, causing an 80-fold increase in GCK mRNA (Figure 5B). The results in Figures 4 and 5 support the notion that pharmacological inhibition of GSK-3 in primary hepatocytes is accompanied by a moderate and relatively slow increase in the hepatocyte content of SREBP-1c. Correlating with the increase in mature SREBP-1c in hepatocytes, the level of expression of the FASN gene was induced, whereas the GCK gene was unaffected.
Figure 5. Additive effects of SB216763 and T0901317 on FASN mRNA expression without any change in GCK mRNA levels.
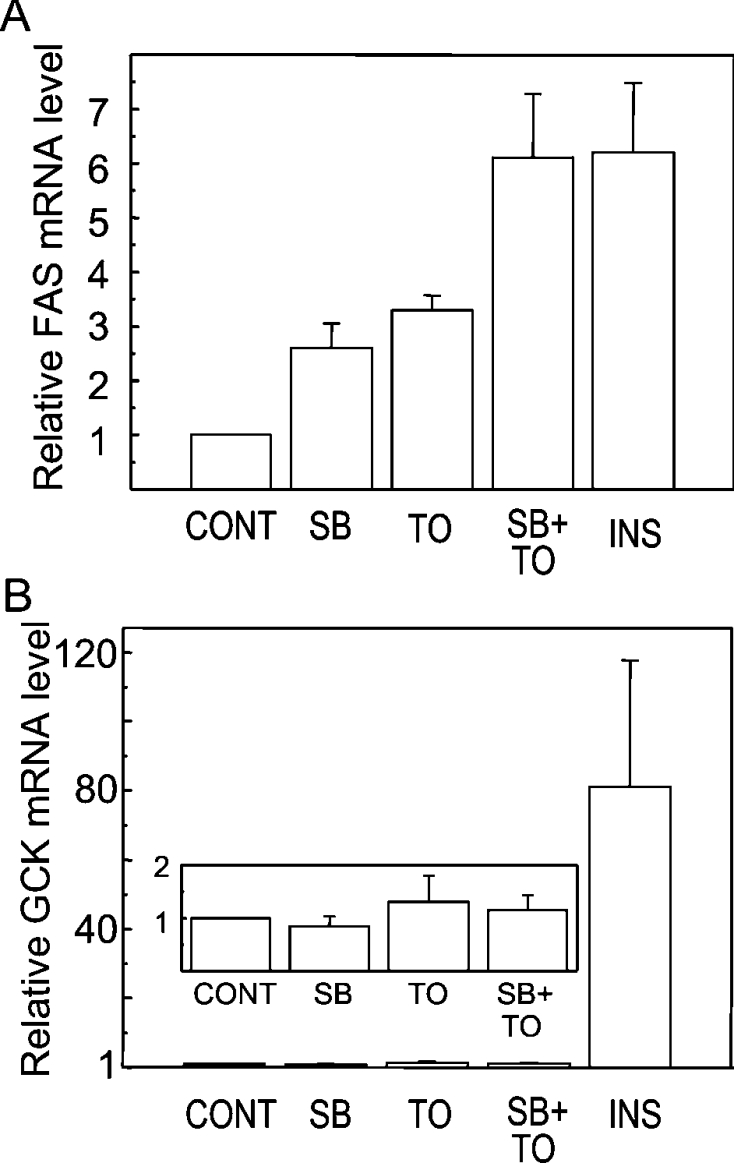
Hepatocytes were cultured for 23 h before the addition of 10 μM SB216763, 10 μM T0901317 or 30 nM insulin. Vehicle (DMSO) was added to control cells. The cells were lysed for isolation of RNA after 8 h of treatment. FASN (A) or GCK (B) mRNA levels were analysed using RT-qPCR. Results are means±S.E.M. for six separate experiments. The inset in panel (B) shows the lack of effect of SB216763 and T0901317 on GCK mRNA on a magnified scale.
The preceding experiments were aimed at investigating the effects of SB216763 over a time interval of 8 h, which is sufficient to allow for detectable increases in the cell content of processed SREBP-1c. A distinct issue was whether acute inhibition of GSK-3 could regulate the transcriptional activity of preformed SREBP-1c, or other transactivators, through immediate post-translational modifications, without the need for de novo protein accumulation. To study this possibility, FASN and GCK mRNA levels were measured at 1 and 4 h after the addition of SB216763 to cultured hepatocytes. No significant rise in either mRNA took place during this time interval in the hepatocytes challenged with SB216763 (Figure 6). Cells stimulated in parallel with insulin displayed robust elevations of FASN and GCK mRNAs as early as the 1 h time point. Since insulin caused a more modest inhibition of GSK-3 than SB216763 (Figure 4), it is clear that GSK-3 inhibition per se is not a critical signalling event that could account for the rapid elevations of GCK or FASN expression in response to insulin in hepatocytes.
Figure 6. Acute inhibition of GSK3 is not sufficient to induce FASN and GCK mRNA expression.
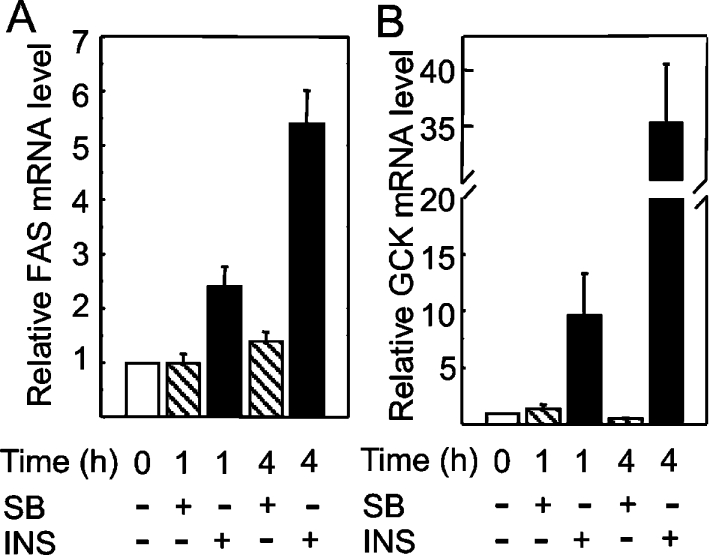
Hepatocytes were grown in culture for 23 h and then challenged with 10 μM SB216763 or 30 nM insulin. Cells were harvested and total RNA extracted to analyse FASN (A) and GCK (B) mRNA expression by RT-qPCR immediately before or 1 or 4 h after the addition of effectors. Results are means±S.E.M. for at least four preparations from distinct hepatocyte culture experiments.
DISCUSSION
In the present paper, all lines of evidence converged to demonstrate that SREBP-1c was not the critical mediator in insulin regulation of the GCK gene, while at same time highlighting the role of SREBP-1c as a master regulator of FASN gene expression. The second important finding was the ability of the LXR agonist T0901317 to induce the de novo appearance of processed forms of SREBP-1c in cultured primary hepatocytes in the absence of added insulin in the culture medium, in contradiction with the notion of a specific requirement for insulin in the processing of the precursor to the mature forms of SREBP-1c in liver cells. The third conclusion was to rule out inhibition of GSK-3 as a key signalling-event mediating the action of insulin as an inducer of the GCK or FASN gene expression.
The transcriptional regulation of SREBP-1c has attracted much interest, both because its inducibility by insulin and because SREBP-1c emerged as a master transactivator of genes for key enzymes of lipogenesis. In earlier studies, multiple cis-acting elements in the 5′-flank of the SREBP-1c promoter were ascribed a role in conferring insulin inducibility to the gene [32]. Using transient transfection of SREBP-1c promoter/luciferase constructs into primary hepatocytes, Chen et al. [33] showed that the most crucial elements were LXRE1 (LXR binding element 1) and LXRE2. These elements are conserved in both sequence and position in the rat and mouse genes at approx. 200 bp upstream of the major start site of transcription. In addition, an SRE around 60 bp upstream of the start was shown to be required, together with the LXREs, to confer maximal insulin inducibility to the SREBP-1c promoter [33]. The kinetic data on SREBP-1c mRNA in the present study are fully consistent with the proposed transcriptional mechanisms. The rapid rise of SREBP-1c mRNA after the addition of T0901317 to hepatocytes supports the key role of activated LXR as an immediate inducer of SREBP-1c. The slower effect of insulin is compatible with a lag before sufficient accumulation of a putative endogenous LXR ligand generated in response to insulin. Finally, and most strikingly, the sustained and highly synergistic response to the combined treatment with T0901317 and insulin might be explained by cooperation at the promoter level between the effect of activated LXR and the positive autoregulation of transcription by rising levels of mature SREBP-1c itself.
The transcriptional regulation of the FASN gene bears both similarities and differences with SREBP-1c. Several distinct SREs and a binding site for LXR were mapped in the 5′-flanking region of the rat FASN promoter [6,34]. In experiments with transgenic mice harbouring FASN promoter fused to the CAT (chloramphenicol acetyltransferase) reporter gene, Sul et al. [7] showed that induction of CAT activity in the liver during the fasting-refeeding transition, a situation accompanied by acute elevation of plasma insulin, was dependent on an intact SRE at −150 relative to the transcription start site. In different studies using transient transfection of HepG2 hepatoma cells with FASN promoter reporter constructs and expression vectors for LXR, a functional LXRE between nucleotides −669 and −655 relative to the transcription start site of the FASN gene was identified [34]. In intact mice, a treatment of several days with LXR agonists was accompanied by an increase in hepatic FASN mRNA levels [35]. However, these animal experiments did not distinguish between a transcriptional effect occurring mostly via an action of activated LXR directly on the LXRE of the FASN gene, or via an indirect effect mediated by increased nuclear levels of SREBP-1c. Here, we showed that two authentic LXR target genes SREBP-1c and CYP7A1 were rapidly induced in hepatocytes following the addition of the LXR agonist T0901317. In the same cells, the FASN mRNA response was markedly weaker and slower, arguing that direct LXRE mediated effects on the FASN gene in rat hepatocytes are minimal. Conversely, all the data supported a master regulatory role for SREBP-1c in FASN expression. Notably, SREBP-1c was shown, using ChIP assays, to be recruited to the FASN promoter region around the −150 SRE. Furthermore, additive effects of insulin and T0901317 on levels of FASN mRNA over the time course of these experiments appeared to be a reflection of additive effects on the levels of processed SREBP-1c proteins.
Multiple findings in this study provided a compelling argument against a role of SREBP-1c as mediator of the acute induction of GCK expression by insulin. First, the LXR agonist T0901317, which promoted clear-cut increases in processed SREBP-1c protein and FASN mRNA, did not affect GCK mRNA expression levels at all time points. Secondly, the synergism between insulin and T0901317 with respect to the induction of SREBP-1c or FASN mRNA was absent for GCK mRNA expression. Thirdly, the ChIP assay did not produce any signal for binding of SREBP-1c to the liver GCK promoter region harbouring putative tandem SREs. This was true in two distinct experimental conditions in which SREBP-1c bound to the FASN promoter region, namely 16 h after addition of T0901317 (Figure 1) or 4 h after addition of insulin alone or together with T0901317 (Figure 3). These data therefore do not support a suggestion by Kim et al. [18] that SREBP-1c is instrumental in insulin induction of GCK. Two important limitations in the experiments of Kim et al. [18] should be noted. First, binding of SREBP-1c to the putative SREs in the GCK promoter was shown by electrophoretic mobility shift assay for bacterially produced SREBP-1c, not for hepatic nuclear protein isolated in physiologically relevant situations. Moreover, the apparent recruitment of SREBP-1c to the GCK promoter using the ChIP assay was noted in rats refed for 22 h. It is hard to interpret this result in mechanistic terms, because the 22 h time point is well past the ascending phase of GCK mRNA induction, which is known to peak between 6 and 10 h after food intake and decline toward basal levels at later times [36].
The finding that GCK mRNA was not induced in cultured hepatocytes challenged with T0901317, in the face of a strong response of the CYP7A1 mRNA in the same cells, suggests that GCK is not a direct target gene for LXR. Earlier studies in intact mice treated for several days with an LXR agonist displayed a modest increase in GCK mRNA in their livers [35]. In view of the results in the present paper, the effect seen in the whole animal was most probably indirect, perhaps via an LXR-mediated facilitation of pancreatic insulin secretion [37].
In a recent paper, Hegarty et al. [23] described evidence for an acute effect of insulin at some step in the processing pathway converting the SREBP-1c precursor into the active transactivator protein. These authors showed that primary hepatocytes cultured with T0901317 accumulated the full-length SREBP-1c precursor with little processed SREBP-1c in the nuclei, and that subsequent addition of insulin effected a rapid increase in the amount of processed nuclear SREBP-1c at the expense of the precursor. Such a two-step protocol appeared to offer a promising experimental system to test for rapid recruitment of SREBP-1c to putative target promoters. Contrary to this expectation, our experiments did not reveal preferential accumulation of the SREBP-1c precursor in hepatocytes treated with T0901317, indicative of a rate-limiting step in SREBP-1c processing that might be subsequently relieved by insulin. First, treatment of hepatocytes with T0901317 alone was sufficient to induce the appearance of processed forms of SREBP-1c as early as 1 h after drug addition. Secondly, over the time course of the experiments, T0901317 was equally as effective as insulin in inducing processed forms of SREBP-1c, without any evidence for a relative increase of full-length form relative to processed forms in T0901317 compared with cells induced with insulin. Thirdly, processed forms of SREBP-1c were not substantially increased by an insulin pulse following 16 h of treatment with T0901317. Finally, consistent with the latter point, culture of hepatocytes with T0901317 alone was sufficient to induce specific binding of SREBP-1c to the FASN promoter, with no significant increase produced by the insulin pulse. The reason for the discrepancy between the present results and those of Hegarty et al. [23] is unknown. In our culture system, primary hepatocytes were isolated from 2-day fasted rats, whereas freely fed animals were apparently used in the Hegarty et al. study. Conceivably, the constitutive rate of SREBP-1c processing might be higher in cells from fasted compared with fed animals.
Several types of post-translational modifications, including phosphorylation [38], acetylation [39] and ubiquitination [40], were identified as potential regulatory mechanisms for the control of SREBP1a or SREBP-1c transcriptional activity and/or stability against degradation. A provocative finding was the discovery that SREBP1a and SREBP-1c could serve as substrates for phosphorylation by GSK-3β, and that site-specific phosphorylation by GSK-3 resulted in ubiquitination and proteasomal degradation of both SREBP1a and SREBP-1c [29]. Insulin is known to down-regulate GSK-3 activity via PKB dependent phosphorylation of the GSK-3α or GSK-3β isoforms at Ser21 or Ser9 respectively [30]. Therefore, insulin might elevate the amount of SREBP-1c in stimulated cells not only by transcriptional induction, but also as a result of protein stabilization. In the present paper, we have shown that hepatocytes displayed a modest elevation of SREBP-1c precursor and processed forms after several hours of treatment with the GSK-3 inhibitor SB216763. Interestingly, the effect of SB216763 was additive to that of T0901317, which would be consistent with protein stabilization due to inhibition of GSK-3 by the former drug and transcriptional induction by the latter drug. Also of note, the increase in levels of processed forms of SREBP-1c in SB216763-treated hepatocytes was on the average one-fourth of the effect seen with insulin, although the inhibition of GSK-3 was more pronounced with SB216763 compared with insulin. Therefore, it is clear that only a small part, if any, of the insulin effect could be transduced by a pathway dependent on inhibition of GSK3.
A role of GSK-3 inhibition in mediating some of the effects of insulin in the regulation of gene expression for metabolic enzymes, unrelated to the newly discovered stabilization of SRE-BP1, was suggested by the results of earlier studies using hepatoma cell culture. Three genes known to be repressed by insulin, namely glucose-6-phosphatase, phosphoenolpyruvate carboxykinase and insulin-like growth factor binding protein 1, were shown to be down-regulated in an insulin-like manner after the addition of GSK-3 inhibitors to hepatoma cells [41,42]. However, more recent studies using knock-in mice with homozygous S21A and S9A mutations in the GSK-3α or GSK-3β genes respectively, revealed that the insulin repression of the same three target genes was intact in the livers of these animals, in spite of the fact that GSK-3 was completely resistant to insulin inactivation in the mutant animals [43]. These results unambiguously showed that inhibition of GSK-3 was not a requisite for the physiological action of insulin on repressible target genes. Interestingly, the mutant mice with GSK-3 alleles refractory to insulin inhibition showed a strong induction of hepatic SREBP1 and FASN gene expression during the fasting-refeeding transition [43]. In the present paper, we have shown that pharmacological inhibition of GSK-3 activity with SB216763 did not mimic the rapid induction of GCK and FASN gene expression observed in insulin-treated hepatocytes. These results provide a conclusive argument against the possibility that the acute dephosphorylation of a GSK-3 protein substrate might play an essential role in insulin signal transduction for the transcriptional stimulation of the inducible genes.
Acknowledgments
We thank Asllan Gjinovci (Department of Cell Physiology and Metabolism, University of Geneva School of Medicine, Geneva, Switzerland) for his expert help with liver perfusion, and Dr Richard Fisch (Department of Medicine, University of Geneva School of Medicine, Geneva, Switzerland) for advice on mRNA assays by RT and qPCR. This work was supported by grants 3200-063423 and 310000-1197 from the Swiss National Science Foundation. S. M. was on leave of absence from INRA (Unite de Nutrition Humaine, Centre de Clermont-Ferrand-Theix, Institut National de la Recherche Agronomique, Saint-Genès Champanelle, France) in the period during which this work was performed.
References
- 1.Girard J., Ferre P., Foufelle F. Mechanisms by which carbohydrates regulate expression of genes for glycolytic and lipogenic enzymes. Annu. Rev. Nutr. 1997;17:325–352. doi: 10.1146/annurev.nutr.17.1.325. [DOI] [PubMed] [Google Scholar]
- 2.Towle H. C., Kaytor E. N., Shih H. M. Regulation of the expression of lipogenic enzyme genes by carbohydrate. Annu. Rev. Nutr. 1997;17:405–433. doi: 10.1146/annurev.nutr.17.1.405. [DOI] [PubMed] [Google Scholar]
- 3.Horton J. D., Goldstein J. L., Brown M. S. SREBPs: activators of the complete program of cholesterol and fatty acid synthesis in the liver. J. Clin. Invest. 2002;109:1125–1131. doi: 10.1172/JCI15593. [DOI] [PMC free article] [PubMed] [Google Scholar]
- 4.Kim J. B., Spotts G. D., Halvorsen Y. D., Shih H. M., Ellenberger T., Towle H. C., Spiegelman B. M. Dual DNA binding specificity of ADD1/SREBP1 controlled by a single amino acid in the basic helix-loop-helix domain. Mol. Cell. Biol. 1995;15:2582–2588. doi: 10.1128/mcb.15.5.2582. [DOI] [PMC free article] [PubMed] [Google Scholar]
- 5.Magana M. M., Lin S. S., Dooley K. A., Osborne T. F. Sterol regulation of acetyl coenzyme A carboxylase promoter requires two interdependent binding sites for sterol regulatory element binding proteins. J. Lipid Res. 1997;38:1630–1638. [PubMed] [Google Scholar]
- 6.Magana M. M., Osborne T. F. Two tandem binding sites for sterol regulatory element binding proteins are required for sterol regulation of fatty-acid synthase promoter. J. Biol. Chem. 1996;271:32689–32694. doi: 10.1074/jbc.271.51.32689. [DOI] [PubMed] [Google Scholar]
- 7.Latasa M. J., Griffin M. J., Moon Y. S., Kang C., Sul H. S. Occupancy and function of the −150 sterol regulatory element and −65 E-box in nutritional regulation of the fatty acid synthase gene in living animals. Mol. Cell. Biol. 2003;23:5896–5907. doi: 10.1128/MCB.23.16.5896-5907.2003. [DOI] [PMC free article] [PubMed] [Google Scholar]
- 8.Kim J. B., Sarraf P., Wright M., Yao K. M., Mueller E., Solanes G., Lowell B. B., Spiegelman B. M. Nutritional and insulin regulation of fatty acid synthetase and leptin gene expression through ADD1/SREBP1. J. Clin. Invest. 1998;101:1–9. doi: 10.1172/JCI1411. [DOI] [PMC free article] [PubMed] [Google Scholar]
- 9.Foretz M., Pacot C., Dugail I., Lemarchand P., Guichard C., Le Liepvre X., Berthelier-Lubrano C., Spiegelman B., Kim J. B., Ferre P., Foufelle F. ADD1/SREBP-1c is required in the activation of hepatic lipogenic gene expression by glucose. Mol. Cell. Biol. 1999;19:3760–3768. doi: 10.1128/mcb.19.5.3760. [DOI] [PMC free article] [PubMed] [Google Scholar]
- 10.Fleischmann M., Iynedjian P. B. Regulation of sterol regulatory-element binding protein 1 gene expression in liver: role of insulin and protein kinase B/cAkt. Biochem. J. 2000;349:13–17. doi: 10.1042/0264-6021:3490013. [DOI] [PMC free article] [PubMed] [Google Scholar]
- 11.Shimomura I., Shimano H., Korn B. S., Bashmakov Y., Horton J. D. Nuclear sterol regulatory element-binding proteins activate genes responsible for the entire program of unsaturated fatty acid biosynthesis in transgenic mouse liver. J. Biol. Chem. 1998;273:35299–35306. doi: 10.1074/jbc.273.52.35299. [DOI] [PubMed] [Google Scholar]
- 12.Foretz M., Guichard C., Ferre P., Foufelle F. Sterol regulatory element binding protein-1c is a major mediator of insulin action on the hepatic expression of glucokinase and lipogenesis-related genes. Proc. Natl. Acad. Sci. U.S.A. 1999;96:12737–12742. doi: 10.1073/pnas.96.22.12737. [DOI] [PMC free article] [PubMed] [Google Scholar]
- 13.Shimano H., Yahagi N., Amemiya-Kudo M., Hasty A. H., Osuga J., Tamura Y., Shionoiri F., Iizuka Y., Ohashi K., Harada K., et al. Sterol regulatory element-binding protein-1 as a key transcription factor for nutritional induction of lipogenic enzyme genes. J. Biol. Chem. 1999;274:35832–35839. doi: 10.1074/jbc.274.50.35832. [DOI] [PubMed] [Google Scholar]
- 14.Agius L., Peak M., Newgard C. B., Gomez-Foix A. M., Guinovart J. J. Evidence for a role of glucose-induced translocation of glucokinase in the control of hepatic glycogen synthesis. J. Biol. Chem. 1996;271:30479–30486. doi: 10.1074/jbc.271.48.30479. [DOI] [PubMed] [Google Scholar]
- 15.Iynedjian P. B., Gjinovci A., Renold A. E. Stimulation by insulin of glucokinase gene transcription in liver of diabetic rats. J. Biol. Chem. 1988;263:740–744. [PubMed] [Google Scholar]
- 16.Iynedjian P. B., Jotterand D., Nouspikel T., Asfari M., Pilot P. R. Transcriptional induction of glucokinase gene by insulin in cultured liver cells and its repression by the glucagon-cAMP system. J. Biol. Chem. 1989;264:21824–21829. [PubMed] [Google Scholar]
- 17.Stoeckman A. K., Towle H. C. The role of SREBP-1c in nutritional regulation of lipogenic enzyme gene expression. J. Biol. Chem. 2002;277:27029–27035. doi: 10.1074/jbc.M202638200. [DOI] [PubMed] [Google Scholar]
- 18.Kim S. Y., Kim H. I., Kim T. H., Im S. S., Park S. K., Lee I. K., Kim K. S., Ahn Y. H. SREBP-1c mediates the insulin-dependent hepatic glucokinase expression. J. Biol. Chem. 2004;279:30823–30829. doi: 10.1074/jbc.M313223200. [DOI] [PubMed] [Google Scholar]
- 19.Iynedjian P. Molecular biology of glucokinase regulation. In: Matschinsky F. M., Magnuson M. A., editors. Glucokinase and Glycemic Disease: From Basics to Novel Therapeutics. Basel: Karger; 2004. pp. 155–168. [Google Scholar]
- 20.Gregori C., Guillet-Deniau I., Girard J., Decaux J. F., Pichard A. L. Insulin regulation of glucokinase gene expression: evidence against a role for sterol regulatory element binding protein 1 in primary hepatocytes. FEBS Lett. 2006;580:410–414. doi: 10.1016/j.febslet.2005.12.032. [DOI] [PubMed] [Google Scholar]
- 21.Iynedjian P. B., Roth R. A., Fleischmann M., Gjinovci A. Activation of protein kinase B/cAkt in hepatocytes is sufficient for the induction of expression of the gene encoding glucokinase. Biochem. J. 2000;351:621–627. [PMC free article] [PubMed] [Google Scholar]
- 22.Ribaux P. G., Iynedjian P. B. Analysis of the role of protein kinase B (cAKT) in insulin-dependent induction of glucokinase and sterol regulatory element-binding protein 1 (SREBP1) mRNAs in hepatocytes. Biochem. J. 2003;376:697–705. doi: 10.1042/BJ20031287. [DOI] [PMC free article] [PubMed] [Google Scholar]
- 23.Hegarty B. D., Bobard A., Hainault I., Ferre P., Bossard P., Foufelle F. Distinct roles of insulin and liver X receptor in the induction and cleavage of sterol regulatory element-binding protein-1c. Proc. Natl. Acad. Sci. U.S.A. 2005;102:791–796. doi: 10.1073/pnas.0405067102. [DOI] [PMC free article] [PubMed] [Google Scholar]
- 24.Shimomura I., Bashmakov Y., Ikemoto S., Horton J. D., Brown M. S., Goldstein J. L. Insulin selectively increases SREBP-1c mRNA in the livers of rats with streptozotocin-induced diabetes. Proc. Natl. Acad. Sci. U.S.A. 1999;96:13656–13661. doi: 10.1073/pnas.96.24.13656. [DOI] [PMC free article] [PubMed] [Google Scholar]
- 25.Repa J. J., Liang G., Ou J., Bashmakov Y., Lobaccaro J. M., Shimomura I., Shan B., Brown M. S., Goldstein J. L., Mangelsdorf D. J. Regulation of mouse sterol regulatory element-binding protein-1c gene (SREBP-1c) by oxysterol receptors, LXRalpha and LXRbeta. Genes Dev. 2000;14:2819–2830. doi: 10.1101/gad.844900. [DOI] [PMC free article] [PubMed] [Google Scholar]
- 26.Kalaany N. Y., Mangelsdorf D. J. LXRS and FXR: the yin and yang of cholesterol and fat metabolism. Annu. Rev. Physiol. 2006;68:159–191. doi: 10.1146/annurev.physiol.68.033104.152158. [DOI] [PubMed] [Google Scholar]
- 27.Twisk J., Hoekman M. F., Lehmann E. M., Meijer P., Mager W. H., Princen H. M. Insulin suppresses bile acid synthesis in cultured rat hepatocytes by down-regulation of cholesterol 7 alpha-hydroxylase and sterol 27-hydroxylase gene transcription. Hepatology. 1995;21:501–510. [PubMed] [Google Scholar]
- 28.Kim K. H., Song M. J., Yoo E. J., Choe S. S., Park S. D., Kim J. B. Regulatory role of glycogen synthase kinase 3 for transcriptional activity of ADD1/SREBP-1c. J. Biol. Chem. 2004;279:51999–52006. doi: 10.1074/jbc.M405522200. [DOI] [PubMed] [Google Scholar]
- 29.Sundqvist A., Bengoechea-Alonso M. T., Ye X., Lukiyanchuk V., Jin J., Harper J. W., Ericsson J. Control of lipid metabolism by phosphorylation-dependent degradation of the SREBP family of transcription factors by SCF(Fbw7) Cell Metab. 2005;1:379–391. doi: 10.1016/j.cmet.2005.04.010. [DOI] [PubMed] [Google Scholar]
- 30.Frame S., Cohen P. GSK3 takes centre stage more than 20 years after its discovery. Biochem. J. 2001;359:1–16. doi: 10.1042/0264-6021:3590001. [DOI] [PMC free article] [PubMed] [Google Scholar]
- 31.Bianchi M., De Lucchini S., Marin O., Turner D. L., Hanks S. K., Villa-Moruzzi E. Regulation of FAK Ser-722 phosphorylation and kinase activity by GSK3 and PP1 during cell spreading and migration. Biochem. J. 2005;391:359–370. doi: 10.1042/BJ20050282. [DOI] [PMC free article] [PubMed] [Google Scholar]
- 32.Cagen L. M., Deng X., Wilcox H. G., Park E. A., Raghow R., Elam M. B. Insulin activates the rat sterol-regulatory-element-binding protein 1c (SREBP-1c) promoter through the combinatorial actions of SREBP, LXR, Sp-1 and NF-Y cis-acting elements. Biochem. J. 2005;385:207–216. doi: 10.1042/BJ20040162. [DOI] [PMC free article] [PubMed] [Google Scholar]
- 33.Chen G., Liang G., Ou J., Goldstein J. L., Brown M. S. Central role for liver X receptor in insulin-mediated activation of Srebp-1c transcription and stimulation of fatty acid synthesis in liver. Proc. Natl. Acad. Sci. U.S.A. 2004;101:11245–11250. doi: 10.1073/pnas.0404297101. [DOI] [PMC free article] [PubMed] [Google Scholar]
- 34.Joseph S. B., Laffitte B. A., Patel P. H., Watson M. A., Matsukuma K. E., Walczak R., Collins J. L., Osborne T. F., Tontonoz P. Direct and indirect mechanisms for regulation of fatty acid synthase gene expression by liver X receptors. J. Biol. Chem. 2002;277:11019–11025. doi: 10.1074/jbc.M111041200. [DOI] [PubMed] [Google Scholar]
- 35.Laffitte B. A., Chao L. C., Li J., Walczak R., Hummasti S., Joseph S. B., Castrillo A., Wilpitz D. C., Mangelsdorf D. J., Collins J. L., et al. Activation of liver X receptor improves glucose tolerance through coordinate regulation of glucose metabolism in liver and adipose tissue. Proc. Natl. Acad. Sci. U.S.A. 2003;100:5419–5424. doi: 10.1073/pnas.0830671100. [DOI] [PMC free article] [PubMed] [Google Scholar]
- 36.Iynedjian P. B., Ucla C., Mach B. Molecular cloning of glucokinase cDNA: developmental and dietary regulation of glucokinase mRNA in rat liver. J. Biol. Chem. 1987;262:6032–6038. [PubMed] [Google Scholar]
- 37.Efanov A. M., Sewing S., Bokvist K., Gromada J. Liver X receptor activation stimulates insulin secretion via modulation of glucose and lipid metabolism in pancreatic beta-cells. Diabetes. 2004;53(Suppl. 3):S75–S78. doi: 10.2337/diabetes.53.suppl_3.s75. [DOI] [PubMed] [Google Scholar]
- 38.Roth G., Kotzka J., Kremer L., Lehr S., Lohaus C., Meyer H. E., Krone W., Muller-Wieland D. MAP kinases Erk1/2 phosphorylate sterol regulatory element-binding protein (SREBP)-1a at serine 117 in vitro. J. Biol. Chem. 2000;275:33302–33307. doi: 10.1074/jbc.M005425200. [DOI] [PubMed] [Google Scholar]
- 39.Giandomenico V., Simonsson M., Gronroos E., Ericsson J. Coactivator-dependent acetylation stabilizes members of the SREBP family of transcription factors. Mol. Cell. Biol. 2003;23:2587–2599. doi: 10.1128/MCB.23.7.2587-2599.2003. [DOI] [PMC free article] [PubMed] [Google Scholar]
- 40.Sundqvist A., Ericsson J. Transcription-dependent degradation controls the stability of the SREBP family of transcription factors. Proc. Natl. Acad. Sci. U.S.A. 2003;100:13833–13838. doi: 10.1073/pnas.2335135100. [DOI] [PMC free article] [PubMed] [Google Scholar]
- 41.Lochhead P. A., Coghlan M., Rice S. Q., Sutherland C. Inhibition of GSK-3 selectively reduces glucose-6-phosphatase and phosphatase and phosphoenolypyruvate carboxykinase gene expression. Diabetes. 2001;50:937–946. doi: 10.2337/diabetes.50.5.937. [DOI] [PubMed] [Google Scholar]
- 42.Finlay D., Patel S., Dickson L. M., Shapiro N., Marquez R., Rhodes C. J., Sutherland C. Glycogen synthase kinase-3 regulates IGFBP-1 gene transcription through the thymine-rich insulin response element. BMC Mol. Biol. 2004;5:15. doi: 10.1186/1471-2199-5-15. [DOI] [PMC free article] [PubMed] [Google Scholar]
- 43.Lipina C., Huang X., Finlay D., McManus E. J., Alessi D. R., Sutherland C. Analysis of hepatic gene transcription in mice expressing insulin-insensitive GSK3. Biochem. J. 2005;392:633–639. doi: 10.1042/BJ20051046. [DOI] [PMC free article] [PubMed] [Google Scholar]