

Abstract
The recent advent of tools enabling statistical inferences to be drawn from comparisons of microbial communities has enabled the focus of microbial ecology to move from characterizing biodiversity to describing the distribution of that biodiversity. Although statistical tools have been developed to compare community structures across a phylogenetic tree, we lack tools to compare the memberships and structures of two communities at a particular operational taxonomic unit (OTU) definition. Furthermore, current tests of community structure do not indicate the similarity of the communities but only report the probability of a statistical hypothesis. Here we present a computer program, SONS, which implements nonparametric estimators for the fraction and richness of OTUs shared between two communities.
Statistical tools that describe and compare microbial communities using PCR-based libraries containing 16S rRNA genes as well as protein-coding gene fragments have become essential to the quantitative analysis of microbial communities (Table 1). Existing tools include DOTUR, which assigns sequences to operational taxonomic units (OTUs) based on the genetic distance between sequences and also estimates the richness and diversity of a community (12, 20). Tools for comparing community structures, which describe the abundance of each member, include LIBSHUFF (22, 24), TreeClimber (18, 21), UniFrac (14), and analysis of molecular variance (AMOVA) (10, 18). Although these tools have introduced statistical rigor to microbial ecology research, they give no indication of the similarity between the communities being compared and their analysis is performed across a phylogenetic tree instead of at a specific phylogenetic level.
TABLE 1.
Tools used in microbial ecology to describe and compare microbial communities
| Tool | Application | Input | Reference |
|---|---|---|---|
| DOTUR/FastGroup | Assigns sequences to OTUs based on genetic distance between sequences and constructs rarefaction curves and collector's curves for richness and diversity estimators | Distance matrix | 20, 23 |
| SONS | Calculates collector's curves for estimates of the fraction and richness of OTUs shared between communities | OTU designation | This study |
| LIBSHUFF/∫-LIBSHUFF | Uses the Cramer-von Mises statistic to test whether the structures of two communities are the same, different, or subsets of one another | Distance matrix | 22, 24 |
| TreeClimber | Implements a parsimony-based test to determine whether the community structures of two or more communities are significantly different | Phylogenetic tree | 16, 18, 21 |
| UniFrac | Compares the phylogenetic distances between pairs of communities to describe the similarity of their structures | Phylogenetic tree | 14 |
| AMOVA | Uses an analysis of variance-type formulation to determine whether the genetic diversities of two or more community structures are significantly different | Distance matrix | 1, 10, 18 |
A lingering statistical challenge is comparing the memberships and structures of two or more communities at a specific OTU designation. It is critical to differentiate between community membership (i.e., the list of OTUs in a community) and structure (i.e., the combination of membership and the abundance of each OTU). A common goal in microbial ecology is quantifying the degree of overlap between the memberships and structures of two communities. For example, the fraction of OTUs that are shared between healthy and unproductive soils may indicate whether soil health is a function of community membership, structure, or both. Likewise, differences between the memberships of human-associated communities for related and unrelated patients may identify candidate microbial populations that account for healthy or disease states. If the memberships of two communities differ, then so will their structures. Also, if the richness of a community differs from that of another community, so do their memberships and structures. Yet if two communities have the same membership, then they will not necessarily have the same structure, and if the communities have the same richness, then they will not necessarily have the same membership. Finally, determining the phylogenetic resolution where two communities' memberships and structures are either identical or disjoint may be relevant to these discussions as well.
Here we present a new computer program, SONS (stands for shared OTUs and similarity), which compares the memberships and structures in communities by accounting for the abundance distributions of OTUs that are either endemic to one community or shared by two communities (5, 4, 6, 8, 26, 27). Using examples from medical microbial ecology, we compare the results of phylogeny-wide statistical hypothesis tests to similarity indices calculated at specific OTU definitions. SONS builds upon an analysis using DOTUR (20), which enables SONS to measure the fraction of OTUs shared by two communities as a function of genetic distance. SONS is a versatile and powerful tool that will complement the suite of tools used by microbial ecologists.
MATERIALS AND METHODS
Estimating the richness of shared OTUs between two communities.
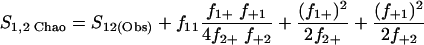
Nonparametric richness estimators of the number of shared OTUs between two communities (designated A and B) have been developed that are analogous to the Chao1 (3) and ACE (7) single-community richness estimators. The S1,2 Chao (8) and S1,2 ACE (6) estimators are calculated as follows:
 |
(1) |
 |
(2) |
where
 |
(2a) |
 |
(2b) |
 |
(2c) |
 |
(2d) |
 |
(2e) |
 |
(2f) |
 |
(2g) |
 |
(2h) |
 |
(2i) |
 |
(2j) |
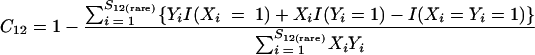
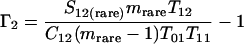
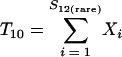
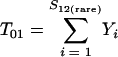
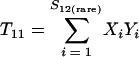
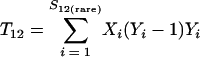
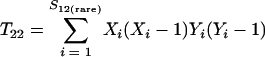
and where f11 is the number of OTUs shared with 1 observed individual in communities A and B; f1+ and f2+ are, respectively, the numbers of OTUs shared with 1 and 2 individuals observed in A; f+1 and f+2 are, respectively, the numbers of OTUs shared with 1 and 2 individuals observed in B; f(rare)1+ is the number of OTUs shared with 1 individual found in A and 10 or fewer individuals in B; f(rare)+1 is the number of OTUs shared with 1 individual found in B and 10 or fewer individuals in A; nrare is the number of sequences from A that contain 10 or fewer sequences; mrare is the number of sequences from B that contain 10 or fewer sequences; S12(rare) is the number of shared OTUs in instances where both of the communities are represented by 10 or fewer sequences; S12(abund) is the number of shared OTUs where at least one of the communities is represented by more than 10 sequences; and S12(Obs) is the number of shared OTUs in A and B.
These estimates can be corroborated by estimating the richness of each community individually and the richness of the two communities pooled together. The difference between the pooled richness estimate and the sum of the individual richness estimates should be similar to the results of equations 1 and 2.
Estimating the fraction of OTUs shared between two communities.
Incidence-based measures of community similarity, such as the classic Jaccard (Jclas) and Sørenson (Lclas) similarity indices, calculate the ratio of shared OTUs to the total number of OTUs in individual communities:
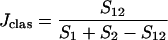 |
(3) |
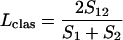 |
(4) |
where S1 and S2 are the numbers of OTUs observed or estimated in A and B, respectively.
Because it is currently impractical to sample most microbial communities exhaustively, equations 3 and 4 may be an underestimate of the true values. In this study, we propose substituting the value from either equation 1 or equation 2 for S12 and the single-community richness estimates as determined by DOTUR for S1 and S2. Throughout this study we report the Chao1 richness estimates for S1 and S2 (3) and the values of equation 1 for S12.
Estimating the fraction of sequences that belong to shared OTUs.
Just as the Chao1 richness estimator is a function of the number of OTUs observed once or twice in a sample (3), the estimator of the fraction of sequences in shared OTUs is a function of the number of shared OTUs that are observed at least once or twice in the community being analyzed (5, 4):
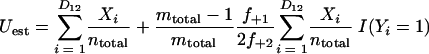 |
(5) |
 |
(6) |
where Uest and Vest are the fractions of sequences from A and B, respectively, that belong to a shared OTU; Xi, and Yi are the abundances of the ith shared OTU in A and B, respectively; ntotal and mtotal are the total numbers of sequences sampled in A and B, respectively; and I(•) indicates that if the argument, •, is true, then I(•) is 1; otherwise, it is 0.
Using these estimators, the abundance-based Jaccard (Jabund) and Sørenson (Labund) similarity indices may be calculated (5, 4):
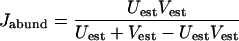 |
(7) |
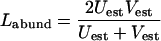 |
(8) |
The 95% confidence intervals (CI) for equations 5 to 8 can be determined by a bootstrapping procedure. Equations 7 and 8 have been described as a measure of community overlap, which is defined as the probability that a randomly selected OTU is found in both communities, given that it is in at least one of the communities (25, 27).
Estimating community structure similarity.
The overlap measures described by equations 7 and 8 do not account for the similarity of the relative abundances among the OTUs shared between two communities. Therefore, although they measure community overlap, they do not measure the similarity of two community structures. Yue and Clayton (26) proposed a nonparametric maximum likelihood estimator of similarity, θ, to compare community structures:
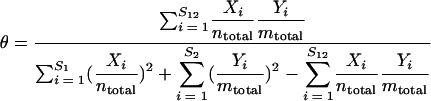 |
(9) |
The 95% confidence intervals for equation 9 can be determined using the explicit variance formula for θ that was derived by Yue and Clayton (26).
Sensitivity to sampling.
To determine whether the values generated by equations 1 to 9 were sensitive to sampling, we randomized the sequence order and analyzed each collector's curve. Except where noted, the collectors' curves had stabilized reasonably well by the final sampling point.
SONS: shared OTUs and similarity.
SONS is a freely available computer code written in C++ that uses the “list” output file from DOTUR as an input as well as a file containing a paired list of each sequence identifier and a designation from the library from which the sequence was generated. The DOTUR-derived list file can be replaced with an analogous file if sequences were assigned to OTUs by an alternative method, as long as the file formatting is retained. The order of sequence identifiers is used to construct collectors' curves of the estimates from equations 1 to 9 for each pairwise comparison and distance level used to define OTUs. The ordering of sequences can be randomized in the software. Where possible, SONS calculates the 95% confidence interval for the final estimate. A manual, example data sets, a source code for compilation in Linux or Mac OSX, and the Windows executable file are available at the SONS website (http://www.plantpath.wisc.edu/fac/joh/sons.html).
Data sets.
All data sets used in this study are available at the SONS website. The 16S rRNA sequences used in this study were obtained from the original authors (9, 19) or from GenBank (13). Sequence alignments were obtained either from the original author (9) or by using the greengenes website (http://greengenes.lbl.gov) (13, 19). Because not all of the 16S rRNA gene sequences from the mouse cecum study overlapped or were the same length, we considered only those sequences and nucleotides that overlapped between nucleotides 100 and 600 (Escherichia coli numbering). All alignments were imported to ARB (15), and distance matrices were generated using the Juke-Cantor correction for multiple substitutions. DOTUR (20) was used to assign sequences to OTUs for every possible distance level (http://www.plantpath.wisc.edu/fac/joh/dotur.html). For ease of reporting results, OTUs will be designated OTUx.xx, where the subscript represents the maximum distance as a fraction of nucleotide substitutions between any two sequences within that OTU. Although these distance cutoffs are arbitrary and controversial, it is often helpful to think of OTUs that are defined by distances of less than 0.03 as corresponding to a strain-level delineation, of 0.03 corresponding to a species, of 0.05 corresponding to a genus, of 0.15 corresponding to a class, and of 0.20 to 0.30 corresponding to a phylum (20). Unless otherwise stated, all richness estimates were considered reliable when the estimate did not show sensitivity to additional sampling, and we report Chao1 richness values, although the Chao1 (3), ACE (7), and Jackknife (2) estimates were generally similar.
Community structures were compared using ∫-LIBSHUFF (22) and TreeClimber (21). ∫-LIBSHUFF (http://www.plantpath.wisc.edu/fac/joh/s-libshuff.html) uses a distance matrix as the input to determine whether one library represents a random sampling of another. A small P value for both comparisons indicates that the two libraries had significantly different structures. If the P value corresponding to the comparison of one library to another is small and the reverse comparison yields a high P value, then the community structure of the second library is considered to be a subset of the first (22, 24). TreeClimber (http://www.plantpath.wisc.edu/fac/joh/treeclimber.html) implements the parsimony test originally applied in studying the population biology of sexual organisms and has since been applied to asexual organisms to determine whether two or more communities harbor different structures (21). Phylogenetic trees for use in TreeClimber were generated by the neighbor-joining algorithm in ARB.
RESULTS
To demonstrate the use of SONS, we selected three published 16S rRNA sequence collections in which the microbial community had a relatively low richness and from which the original authors sequenced a sufficient number of clones to obtain a reliable estimate of the community's richness. We chose studies that made comparisons of microbial communities within and between individual host organisms using samples from the human distal esophagus (19), human gastrointestinal tract (9), and mouse cecum (13).
Human distal esophagus.
Pei et al. (19) obtained 714 overlapping 16S rRNA gene sequences in samples from each of three patients with healthy esophagi (patient B, patient C, and patient D). Their analysis focused on describing the phylogenetic compositions of the three communities and the aggregate pooled richness of the bacterial types. Our phylogeny-based analysis of the three community structures found the observed differences to be statistically significant (for ∫-LIBSHUFF, all P values were <0.0072; for TreeClimber, P was <0.0001).
Considering the small P values that we calculated using ∫-LIBSHUFF and TreeClimber, we used SONS to further characterize the differences between the three communities. Estimating the OTU0.03 richness of each patient's community and the richness shared between patients (Fig. 1) showed (i) that the membership of patient B's community was a subset of that of patient D and (ii) that patient C's community shared 70% of its membership with those of both patient B and patient D. Considering the relatively large confidence intervals for the richness estimates for the communities of patients B and D, it is possible that they had the same richness. We then calculated the Jabund between the three communities. The Jabund value between communities B and D was 0.94 (standard error [SE] = 0.10), which was not significantly different from 1.0; this result is supported by the overlapping richness estimates shown in Fig. 1. The Jabund values between communities B and C (0.75, SE = 0.13) and D and C (0.62, SE = 0.14) were large but were significantly different than 1.0. These estimates suggested that although low-abundance members might not have been shared between communities, the most abundant members were shared.
FIG. 1.

Venn diagram comparing the OTU0.03 memberships found in the distal esophagi of three patients (patient B[n = 205], patient C [n = 264], and patient D [n = 245]). Below each patient's name is the Chao1 richness estimate and the 95% confidence interval for that community. We estimated the richness of the overlapping regions based on the pairwise S1,2 Chao richness estimates shared by the three communities and by pooling two communities and estimating the fraction shared with the third community. These estimates are provided on the right side of the figure. The Chao1 richness estimate of the three libraries pooled together was 125 (CI = 98 to 191), and the sum of the individual sectors in the diagram was 117.
To compare the structures of the communities from the three patients at specific OTU definitions, we calculated the community similarity index, θ. When we used the OTU0.03 definition, the θ values for the comparisons between patients B and C, B and D, and C and D were 0.26 (SE = 0.04), 0.61 (SE = 0.08), and 0.10 (SE = 0.07), respectively. When we used the OTU0.20 definition, the same comparisons yielded θ values of 0.88 (SE = 0.04), 0.65 (SE = 0.07), and 0.68 (SE = 0.07), respectively. Although the community structures were not identical, it is interesting that the OTU0.03 community structure between patients B and D was well conserved, considering that patient B's membership was a subset of patient D's. It is also interesting that the OTU0.20 structures of the three communities were not more similar, considering that the OTU0.20 memberships completely overlapped.
Human gastrointestinal tract.
Eckburg et al. (9) pursued an extensive 16S rRNA gene sequencing project where they analyzed a total of 11,831 bacterial 16S rRNA sequences from six gastrointestinal tract tissue samples and one stool sample from each of three healthy patients. They found little intrapatient variation in community structures across tissue sites but found statistically significant differences in the community structures between patients and between the sequences derived from the tissue and stool samples from a common patient. We reanalyzed the data to estimate the similarities between patients and between the tissue and stool samples for individual patients.
We pooled the tissue and stool sample sequences for each patient (designated patient 70, patient 71, and patient 72) to determine whether statistically significant differences in community structures (for ∫-LIBSHUFF, all P values were <0.001; for TreeClimber, P was <0.001) could be attributed to differences in membership or to the abundance of individual members. By comparing the individual and shared richness estimates of the three patients, we identified a core membership of approximately 57 OTU0.03s that were found in all three communities (Fig. 2). Analysis of the fraction of sequences in each patient's community that belonged to a shared OTU0.03 suggested that the most abundant 16S rRNA gene sequences from patient 70 were most similar to the OTU0.03s shared between patients 71 (0.91, SE = 0.05) and 72 (0.98, SE = 0.03); however, the Jabund between patients 71 and 72 was only 0.34 (SE = 0.08). A dendrogram of the pairwise θ values for the OTU0.03 community structure showed that the community structures were most similar among samples from individual patients (Fig. 3). This complements the results of Eckburg et al. (9), who used ∫-LIBSHUFF, the parsimony test, and AMOVA to show that community structures among sites within a patient were more similar to each other than they were to structures in other patients.
FIG. 2.

Venn diagram comparing the pooled OTU0.03 memberships found in the gastrointestinal tracts and stool samples of three patients (patient 70 [n = 4,392], patient 71 [n = 3,605], and patient 72 [n = 3,834]). The Chao1 richness estimate of the three libraries pooled together was 469 (CI = 425 to 544), and the sum of the individual sectors in the diagram was 433.
FIG. 3.

Unweighted pair group method with arithmetic mean dendrogram comparing the pairwise θ values between the seven gastrointestinal tract tissue and stool specimens sampled from three patients. The length of the reference bar represents a distance of 0.10 (distance = 1 − θ). “>” indicates that the calculated richness value represents a minimum because the estimate did not stabilize with respect to sampling effort.
One question that has arisen (17) about the Eckburg et al. (9) study is whether the fact that the patients' stool samples were taken 1 month after the tissue samples had an effect on the observed differences in community structures. This is an important question because the inherent difficulty in obtaining tissue samples and the convenience of obtaining stool samples are tempered by the need for samples that are representative of the gastrointestinal tract microbial community. It is also possible that niches that are filled in the digesta are different from those on the gastrointestinal tract epithelium, which could result in differences in community memberships or structures. The results shown in Fig. 3 indicate that the community structures for the individual tissues from each patient were consistently more similar to each other than to the structures in the stool sample of the same patient. The mean θ values between the six tissue samples were 0.95, 0.94, and 0.82 for patients 70, 71, and 72, respectively. When the respective stool communities were included, the mean θ values were 0.82, 0.69, and 0.65, respectively. When we pooled the sequences from the six tissue samples and compared those pools to the respective stool samples for each patient, the Jabund values for patients 70 (0.93, SE = 0.04) and 71 (0.87, SE = 0.09) were not significantly different from 1.0; however, the Jabund value for patient 72 (0.72, SE = 0.09) was significantly different from 1.00. When we used the nonparametric richness estimators to determine the richness of the tissue and stool samples as well as the shared fraction between them, we calculated Jclas coefficients of 0.60, 0.45, and 0.58 for patients 70, 71, and 72, respectively. Overall, this analysis suggests that although there were considerable differences in the community structures of the three pairs of pooled tissue and stool samples, the most abundant OTU0.03s were generally well conserved between tissue and stool samples, even a month after sampling of the tissue.
Mouse cecum.
Ley et al. (13) investigated the effects of family relationship and a mouse allele responsible for obesity on microbial community structure. We reanalyzed this data set using DOTUR and SONS to estimate the fraction of the pooled community shared between male and female mice, the fraction shared between mice of different genotypes, and the relationship among the 19 mice by using nonparametric similarity indices.
To determine whether the male offspring harbored a community significantly different than that of the female offspring, we pooled the 16S rRNA sequences obtained from samples from the nine male (1,995 sequences) and seven female (1,394 sequences) mice. A comparison of the males' and females' community structures using TreeClimber showed that the observed differences in community structure were statistically significant (P < 0.001), and analysis with ∫-LIBSHUFF found the female community structure to be a subset of the male community structure (P = 0.9140 [male versus female] and P < 0.001 [female versus male]). Our comparison of the male and female community OTU0.03 memberships found that the richness estimates of the male (412, CI = 353 to 512) and female (428, CI = 358 to 547) pools were not significantly different and that 236 OTU0.03s were shared between them. The fraction of 16S rRNA gene sequences from samples from the male mice that belonged to shared OTU0.03s was 0.92 (standard error = 0.05), and the fraction of 16S rRNA gene sequences from samples from the female mice that belonged to shared OTU0.03s was 0.95 (standard error = 0.03), indicating that the most abundant OTU0.03s in each community were shared. Considering that approximately 56% of the OTU0.03s were shared between the two communities, the θ values for OTU0.03 (0.59; SE = 0.03) and OTU0.20 (0.84; SE = 0.02) community structure comparisons were relatively large.
In the original analysis, the mouse genotype was described with respect to a leptin gene, which did not induce obesity when it was homozygous dominant (+/+) or heterozygous (ob/+) but did induce obesity when it was homozygous recessive (ob/ob). We pooled the 16S rRNA sequences according to the genotypes of the offspring from which they were sampled to investigate the effect of host genotype on the bacterial community. TreeClimber analysis showed that there were significant differences among the community structures of three genotypes (P < 0.001). Our ∫-LIBSHUFF analysis showed that the pooled +/+ group's community structure was a subset of the pooled ob/+ and ob/ob groups' community structures but that the ob/+ and ob/ob groups' community structures were significantly different from each other (P = 0.95 for +/+ results versus ob/ob results; P = 0.95 for +/+ results versus ob/ob results; and all other P values were <0.001). The comparison of individual and shared richness estimates indicated that there were approximately 151 OTU0.03s in common between the three communities (Fig. 4). The calculation of Jest values between the three genotypes indicated that the ob/+ group shared a large fraction of its sequences with the +/+ (0.85; SE = 0.04) and ob/ob (0.91; SE = 0.04) groups; the Jest value between the ob/ob and +/+ groups' communities was 0.77 (SE = 0.06). The θ value for the comparison between the +/+ and ob/+ mice was 0.66 (SE = 0.04), and it was 0.37 (SE = 0.02) for the other two comparisons. In contrast to the ∫-LIBSHUFF analyses, the SONS-based analyses suggested that when comparing OTU0.03 memberships and structures, the ob/+ and ob/ob groups were more similar to each other than they were to the +/+ group.
FIG. 4.

Venn diagram comparing the OTU0.03 memberships found among pooled +/+ (n = 876), ob/+ (n = 1,186), and ob/ob (n = 1,327) mice. The Chao1 richness estimate of the three libraries pooled together was 623 (CI = 535 to 761), and the sum of the individual sectors in the diagram was 554.
Ley et al. (13) used UniFrac (14) to construct a dendrogram relating the community structures of the samples from the 19 mice based on the cumulative branch lengths of a composite tree containing the sequences of each pair of mouse communities. It is unclear at what OTU definition the UniFrac operates, and since branch lengths were not calculated for the dendrogram that describes the relatedness of the 19 community structures, it was not possible to estimate the relative similarities of the communities using UniFrac. We used SONS to estimate the pairwise Jabund and θ values between the communities of the 19 mice, and then we generated a dendrogram to describe the relationship of the communities. The overall result described by Ley et al. (13) indicating that communities obtained from related animals were more similar to each other than to communities from unrelated mice was also illustrated by our analyses. One difference that we observed was that the community structures of the related mothers (mother 1 and mother 3) did not cluster together to the exclusion of those of their offspring but clustered separately and with their offspring (Fig. 5). The conclusions drawn from this analysis must be made with caution because most of the estimates of richness and similarity coefficients were unstable with respect to sampling effort, yet this analysis is an example of the versatility of SONS and the possibility of correlating community membership and structure with host genotype or other variables.
FIG. 5.

Unweighted pair group method with arithmetic mean dendrogram comparing nonparametric estimates of the abundance-based Jaccard similarity coefficients for the OTU0.03s identified among 19 mouse cecum samples. A dendrogram constructed using the estimated Sørenson similarity index had the same topology. Although the exact branching orders were not identical, in the θ dendrogram, the OTU0.03 community structures of the offspring generally clustered with the mother; the community structures of mice M2A-3 and M2B-1 clustered with mother 3. The community name corresponds to the mother (e.g., M1-1 is the offspring of mother 1). The length of the reference bar represents a distance of 0.10 (distance = 1 − Jabund). “>” indicates that the calculated richness value represents a minimum because the estimate did not stabilize with respect to sampling effort.
DISCUSSION
SONS determines the abundance distribution of OTUs that are either endemic to or shared between samples. Using this information, it then estimates the overlaps between communities' memberships and structures. In our analyses, we defined OTUs by a distance-based criterion using 16S rRNA gene sequences. The advantage of a distance-based approach is that different levels of taxonomic resolution can be selected to perform the analysis.
Although the phylogeny-based statistical analyses all showed significant differences in community structure, our analysis was able to describe the relative similarities of the memberships and structures of these communities for a specific OTU definition. One interesting result was evidence for core microbial communities that were shared among the microbial communities found in human gastrointestinal tracts and esophagi and in mouse ceca. At least 20% of the OTU0.03s were shared between individuals, sites, and genotypes, indicating that these shared populations may be responsible for essential functions. It also suggests that there are endemic OTU0.03s that serve as accessory populations, which are necessary to complement the different hosts' genetics and environments. SONS brings a powerful method of analysis to the growing toolbox of statistical methods for analyzing microbial communities by adding the ability to determine the taxonomic level at which community membership and structure are distinguishable.
SONS may also inform the debate surrounding whether bacteria have a biogeography (i.e., all species are not everywhere). Differences in richness between communities certainly suggest that bacteria have a biogeography, but we have also shown that even communities with similar levels of richness can have very different memberships. Although all methods have limits of detection, SONS should prove to be a useful tool in applications for studying bacterial biogeography (11), providing the flexibility to choose any OTU definition for comparison.
Other statistical methods, including ∫-LIBSHUFF, TreeClimber, UniFrac, and analysis of molecular variance, take different approaches to comparing the structures of communities. The versatility of all of these methods is limited because the user cannot set the level of taxonomic resolution that is used in the analysis and there is no indication of two communities' similarity. Alternatively, the OTU-based approaches employed in DOTUR and SONS define an OTU by a distance matrix and then determine whether there is sufficient coverage to obtain a reliable estimate of a parameter for that OTU definition by analyzing collector and rarefaction curves. Although the collector's curve of an estimate may stabilize or wander about a mean value, additional sampling improves the accuracy and precision of that estimate. Without an exhaustive sampling of two communities, it is impossible to determine those OTUs that are endemic to a community. For example, although we can say that accessory OTUs differentiate the +/+ and ob/ob groups, we cannot describe those OTUs further. Ultimately, all of these methods assume that the relative similarity of 16S rRNA gene sequences used to define an OTU is biologically informative. For a given OTU definition, two communities may not have the same membership; however, that OTU definition may not be the most biologically meaningful taxonomic resolution, since members of the same OTU may have different phenotypes.
In evaluating SONS, we selected three studies from the commensal microbial community literature because of their depth of sampling and the relatively low richness in these communities compared to that in soil. The results from SONS illustrated that most communities from similar environments share a common core community that is supplemented by an accessory community that may be determined by the host's genotype, the parent, and/or a number of other factors. Framing hypotheses that build on this statistical framework may lead to a more mature understanding of how a host shapes the formation and maintenance of its commensal communities.
Acknowledgments
This work was supported by a USDA postdoctoral fellowship in Soil Biology (2003-35107-13856) to P.D.S. and by the NSF Microbial Observatories program (MCB-0132085), the Howard Hughes Medical Institute, and the University of Wisconsin—Madison College of Agricultural and Life Sciences.
We appreciate the assistance of Zhiheng Pei, Paul Eckburg, and Ruth Ley, who provided us with the 16S rRNA gene sequences and details of the experiments from their respective studies.
REFERENCES
- 1.Anderson, M. J. 2001. A new method for non-parametric multivariate analysis of variance. Austral Ecol. 26:32-46. [Google Scholar]
- 2.Burnham, K. P., and W. S. Overton. 1979. Robust estimation of population size when capture probabilities vary among animals. Ecology 60:927-936. [Google Scholar]
- 3.Chao, A. 1984. Non-parametric estimation of the number of classes in a population. Scand. J. Stat. 11:265-270. [Google Scholar]
- 4.Chao, A., R. L. Chazdon, R. K. Colwell, and T.-J. Shen. 2006. Abundance-based similarity indices and their estimation when there are unseen species in samples. Biometrics 62:361-371. [DOI] [PubMed] [Google Scholar]
- 5.Chao, A., R. L. Chazdon, R. K. Colwell, and T. J. Shen. 2005. A new statistical approach for assessing similarity of species composition with incidence and abundance data. Ecol. Lett. 8:148-159. [Google Scholar]
- 6.Chao, A., W.-H. Hwang, Y.-C. Chen, and C.-Y. Kuo. 2000. Estimating the number of shared species in two communities. Stat. Sinica 10:227-246. [Google Scholar]
- 7.Chao, A., and S. M. Lee. 1992. Estimating the number of classes via sample coverage. J. Am. Stat. Assoc. 87:210-217. [Google Scholar]
- 8.Chao, A., T. J. Shen, and W. H. Hwang. 2006. The applications of Laplace's boundary-mode approximations to estimate species richness and shared species richness. Aust. N. Z. J. Stat. 48:117-128. [Google Scholar]
- 9.Eckburg, P. B., E. M. Bik, C. N. Bernstein, E. Purdom, L. Dethlefsen, M. Sargent, S. R. Gill, K. E. Nelson, and D. A. Relman. 2005. Diversity of the human intestinal microbial flora. Science 308:1635-1638. [DOI] [PMC free article] [PubMed] [Google Scholar]
- 10.Excoffier, L., P. E. Smouse, and J. M. Quattro. 1992. Analysis of molecular variance inferred from metric distances among DNA haplotypes: application to human mitochondrial DNA restriction data. Genetics 131:479-491. [DOI] [PMC free article] [PubMed] [Google Scholar]
- 11.Horner-Devine, M. C., M. Lage, J. B. Hughes, and B. J. Bohannan. 2004. A taxa-area relationship for bacteria. Nature 432:750-753. [DOI] [PubMed] [Google Scholar]
- 12.Hughes, J. B., J. J. Hellmann, T. H. Ricketts, and B. J. M. Bohannan. 2001. Counting the uncountable: statistical approaches to estimating microbial diversity. Appl. Environ. Microbiol. 67:4399-4406. [DOI] [PMC free article] [PubMed] [Google Scholar]
- 13.Ley, R. E., F. Backhed, P. Turnbaugh, C. A. Lozupone, R. D. Knight, and J. I. Gordon. 2005. Obesity alters gut microbial ecology. Proc. Natl. Acad. Sci. USA 102:11070-11075. [DOI] [PMC free article] [PubMed] [Google Scholar]
- 14.Lozupone, C., and R. Knight. 2005. UniFrac: a new phylogenetic method for comparing microbial communities. Appl. Environ. Microbiol. 71:8228-8235. [DOI] [PMC free article] [PubMed] [Google Scholar]
- 15.Ludwig, W., O. Strunk, R. Westram, L. Richter, H. Meier, Yadhukumar, A. Buchner, T. Lai, S. Steppi, G. Jobb, et al. 2004. ARB: a software environment for sequence data. Nucleic Acids Res. 32:1363-1371. [DOI] [PMC free article] [PubMed] [Google Scholar]
- 16.Maddison, W. P., and M. Slatkin. 1991. Null models for the number of evolutionary steps in a character on a phylogenetic tree. Evolution 45:1184-1197. [DOI] [PubMed] [Google Scholar]
- 17.Mai, V., O. C. Stine, and J. G. M. J. Morris. 2005. Timing in collection of stool samples. Science 310:1118. [DOI] [PubMed] [Google Scholar]
- 18.Martin, A. P. 2002. Phylogenetic approaches for describing and comparing the diversity of microbial communities. Appl. Environ. Microbiol. 68:3673-3682. [DOI] [PMC free article] [PubMed] [Google Scholar]
- 19.Pei, Z., E. J. Bini, L. Yang, M. Zhou, F. Francois, and M. J. Blaser. 2004. Bacterial biota in the human distal esophagus. Proc. Natl. Acad. Sci. USA 101:4250-4255. [DOI] [PMC free article] [PubMed] [Google Scholar]
- 20.Schloss, P. D., and J. Handelsman. 2005. Introducing DOTUR, a computer program for defining operational taxonomic units and estimating species richness. Appl. Environ. Microbiol. 71:1501-1506. [DOI] [PMC free article] [PubMed] [Google Scholar]
- 21.Schloss, P. D., and J. Handelsman. 2006. Introducing TreeClimber, a test to compare microbial community structures. Appl. Environ. Microbiol. 72:2379-2384. [DOI] [PMC free article] [PubMed] [Google Scholar]
- 22.Schloss, P. D., B. R. Larget, and J. Handelsman. 2004. Integration of microbial ecology and statistics: a test to compare gene libraries. Appl. Environ. Microbiol. 70:5485-5492. [DOI] [PMC free article] [PubMed] [Google Scholar]
- 23.Seguritan, V., and F. Rohwer. 2001. FastGroup: a program to dereplicate libraries of 16S rDNA sequences. BMC Bioinformatics 2:9. [DOI] [PMC free article] [PubMed] [Google Scholar]
- 24.Singleton, D. R., M. A. Furlong, S. L. Rathbun, and W. B. Whitman. 2001. Quantitative comparisons of 16S rRNA gene sequence libraries from environmental samples. Appl. Environ. Microbiol. 67:4374-4376. [DOI] [PMC free article] [PubMed] [Google Scholar]
- 25.Smith, W., A. R. Solow, and P. E. Preston. 1996. An estimator of species overlap using a modified beta-binomial model. Biometrics 52:1472-1477. [Google Scholar]
- 26.Yue, J. C., and M. K. Clayton. 2005. A similarity measure based on species proportions. Commun. Stat. Theor. Methods 34:2123-2131. [Google Scholar]
- 27.Yue, J. C., M. K. Clayton, and F. C. Lin. 2001. A nonparametric estimator of species overlap. Biometrics 57:743-749. [DOI] [PubMed] [Google Scholar]