Abstract
The interactions between freezing kinetics and subsequent storage temperatures and their effects on the biological activity of lactic acid bacteria have not been examined in studies to date. This paper investigates the effects of three freezing protocols and two storage temperatures on the viability and acidification activity of Lactobacillus delbrueckii subsp. bulgaricus CFL1 in the presence of glycerol. Samples were examined at −196°C and −20°C by freeze fracture and freeze substitution electron microscopy. Differential scanning calorimetry was used to measure proportions of ice and glass transition temperatures for each freezing condition tested. Following storage at low temperatures (−196°C and −80°C), the viability and acidification activity of L. delbrueckii subsp. bulgaricus decreased after freezing and were strongly dependent on freezing kinetics. High cooling rates obtained by direct immersion in liquid nitrogen resulted in the minimum loss of acidification activity and viability. The amount of ice formed in the freeze-concentrated matrix was determined by the freezing protocol, but no intracellular ice was observed in cells suspended in glycerol at any cooling rate. For samples stored at −20°C, the maximum loss of viability and acidification activity was observed with rapidly cooled cells. By scanning electron microscopy, these cells were not observed to contain intracellular ice, and they were observed to be plasmolyzed. It is suggested that the cell damage which occurs in rapidly cooled cells during storage at high subzero temperatures is caused by an osmotic imbalance during warming, not the formation of intracellular ice.
Concentrates of lactic acid bacteria (LAB) are widely used as starters for manufacturing cheese, fermented milk, meat, vegetables, and bread products (19). Freezing and storage at low temperatures (<−40°C) are commonly applied to preserve the viability of concentrates while maintaining their technological properties upon thawing (acidification activity, production of aroma compounds, and contribution to product texture). However, bacterial resistance to freezing and to frozen storage depends on the strain, culture conditions before freezing, harvesting, formulation (type and concentration of cryoprotectant), freezing conditions, and final storage temperature (9).
Freezing is a critical step in the production of LAB concentrates, as it affects both the viability and acidification activity upon thawing (10, 32). However, the mechanisms of freezing damage to bacteria are not well understood. Two damage mechanisms dependent on the cooling rate have usually been proposed. At low freezing rates, cellular damage is principally caused by osmotic stress to cells (so-called “solution effects”) (24). The formation of extracellular ice induces high solute concentrations in the extracellular medium, exposing the cells to an increase in ionic concentration, changes in pH, etc., for extended periods of time. At very high cooling rates, it has been assumed that damage is due to the formation of intracellular ice (13, 25). However, no direct evidence of intracellular ice formation in cryopreserved bacteria has been presented. An alternative mechanism has been proposed in which cell damage occurring after rapid cooling rates is caused by an osmotic imbalance encountered during thawing, not by the formation of intracellular ice (28).
The interactions between freezing conditions and subsequent storage temperature and their effects on the biological activity of LAB have not been differentiated in most studies reported to date. Moreover, the complexity of most cryoprotective solutions currently employed, inconsistencies in freezing and storage temperatures, and a lack of information on freezing rates and various storage times in the frozen state before testing all mean that the results are often difficult to interpret (2, 20). Consequently, examining interactions between the effects of freezing kinetics and storage temperature on the activity of bacteria in a well-defined medium is essential for improving the understanding of the mechanisms of freezing damage to LAB concentrates and delivering rational tools for better formulation and process optimization.
This investigation is aimed at quantifying the individual effects of freezing kinetics and storage temperature in the presence of glycerol as a cryoprotectant on the viability and acidification activity of Lactobacillus delbrueckii subsp. bulgaricus CFL1. Three freezing protocols involving low and high cooling rates and two storage temperatures were studied. To increase our understanding of the physical behaviors of the different phases of bacterial suspensions—ice crystals, the suspending medium, and the bacterial cells—samples were examined at −196°C and −20°C by freeze fracture and freeze substitution electron microscopy. Differential scanning calorimetry (DSC) was used to measure proportions of ice and glass transition temperatures for each freezing condition tested and to help explain the activity results after annealing at −20°C.
MATERIALS AND METHODS
Bacterial strain and media.
Lactobacillus delbrueckii subsp. bulgaricus CFL1 (INRA, Thiverval-Grignon, France) was chosen due to its sensitivity to freezing (10). Inoculation was carried out at about 108 CFU ml−1. The inoculum was stored at −75°C and was thawed for 5 min at 30°C before inoculation.
For starter production, the culture medium was composed of 56.6 g liter−1 whey powder (BBA; Brenntag, Bonneuil sur Marne, France) and was heated at 110°C for 10 min. The supernatant obtained after centrifugation (17,000 × g, 20 min, 4°C) and filtration (0.45 μm) was supplemented with 20 g liter−1 lactose (Prolabo, Paris, France), 5 g liter−1 yeast extract (Labosi, Oulchy-Le-Chateau, France), and 1 ml liter−1 antifoam agent (Rhodorsil 426R; Prolabo). The medium was sterilized in a fermentor at 110°C for 20 min.
For acidification activity measurements, the medium was composed of skimmed milk powder (100 g liter−1; Elle & Vire, Condé sur Vire, France) pasteurized for 1 h at 95°C in 250-ml Erlenmeyer flasks.
L. delbrueckii subsp. bulgaricus CFL1 production.
Batch cultures were carried out in a 2-liter fermentor at 42°C, with a stirring rate of 200 rpm. The pH was controlled at 5.5 by adding an 8.2 M NH4OH solution. Absorbance measurements at 480 nm were used to follow bacterial growth.
In order to recover cells in similar physiological states, cultures were stopped at the beginning of the stationary phase. The cell suspension was then cooled down to 15°C at 1°C min−1 in the fermentor. Cells were harvested and concentrated 20 times by centrifugation (17,000 × g, 30 min, 4°C). After an intermediate storage period for 30 min at 4°C, concentrated cells were resuspended at 4°C in the same weight of sterile protective medium.
Freezing medium.
Glycerol was added to the supernatant obtained after centrifugation of the fermented medium, since it has been reported to be a good cryoprotectant of LAB (9, 17, 33). The final concentration of glycerol in the supernatant was 10% (wt/wt). The composition of the supernatant was determined by high-performance liquid chromatography to be 2.3% lactose, 0.2% glucose, 1.1% galactose, and 1.1% sodium lactate. The osmolality of the freezing medium was 1,600 mosM.
Freezing protocols.
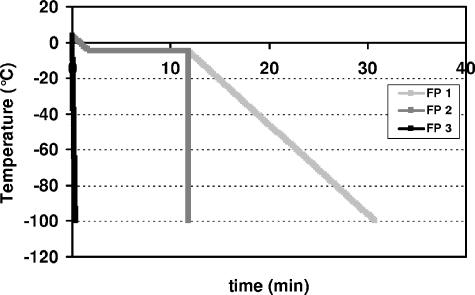
Samples were frozen in 0.5-ml straws (IMV Technologies, L'Aigle, France) sealed with polyvinyl alcohol powder. The freezing cabinet was preset to 4°C. Freezing was carried out by the following three methods (Fig. 1).
FIG. 1.
Freezing protocols (FP 1, FP 2, and FP 3).
(i) Freezing protocol 1 (FP 1).
Using an Asymptote EF100 controlled-rate freezer (Asymptote Ltd., Cambridge, United Kingdom), straws were held horizontally on a sample plate. Straws were cooled from 4°C to −5°C at a rate of 5°C min−1 and maintained at −5°C for 10 min, at which time they were nucleated manually by touching the wall of each straw with forceps that were previously cooled in liquid nitrogen. The nucleation temperature was 2°C lower than the melting point of the samples (−3.0°C). Straws were then cooled at a programmed linear rate of cooling of 5°C min−1 to −100°C and transferred to liquid nitrogen.
(ii) FP 2.
FP 2 was the same as FP 1 except that after manual ice nucleation, samples were frozen by direct immersion in liquid nitrogen (cooling rate of 2,500°C min−1).
(iii) FP 3.
For FP 3, the straws were immersed directly in liquid nitrogen without any controlled nucleation (quenching).
The temperature inside straws containing freezing medium was monitored with thermocouples (type K; 0.2-mm diameter) held in two dummy straws. These measured the cooling rate and ensured that the temperature within the sample closely followed the programmed temperature.
Storage temperature.
Following freezing and immersion in liquid nitrogen, samples were stored at −20°C or −80°C. After 1 month of storage, the samples were thawed for 2 min in a 30°C water bath, and acidification activity was measured.
Acidification activity.
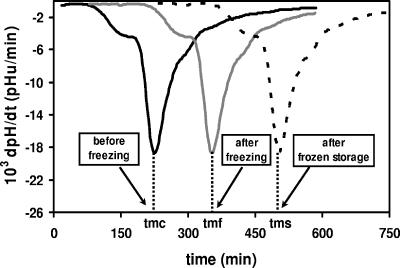
The Cinac system (5) was used to measure the acidification activities of the concentrated suspensions of lactic acid bacteria before and after freezing. Acidification was performed in triplet, using reconstituted dry skimmed milk at 42°C. For each sample, the time necessary to reach the maximum acidification rate in milk (tm, in minutes) was used to characterize the acidification activity of the bacterial suspension: the higher the tm, the longer the latency phase and the lower the acidification activity. Moreover, the value of tm was correlated with the natural logarithm of the bacterial concentration (X [in CFU ml−1]) (10). Consequently, the tm gives an accurate and meaningful measurement of the biological activity of LAB, including the physiological state and viability. The acidification activity was measured before freezing (tmc, in minutes), after freezing (tmf, in minutes), and after one month of frozen storage (tms, in minutes) (Fig. 2). As a result, dtmf (tmf − tmc) and dtms (tm − tmf) characterized the loss of acidification activity during freezing and in the frozen stage, respectively. An increase in the dtm corresponds to an increased loss of acidification activity during the experimental treatment.
FIG. 2.
Acidification activities of L. delbrueckii subsp. bulgaricus CFL1 in the presence of glycerol, as determined by the Cinac system, before (tmc) and after slow freezing (FP 1) (tmf) and after 1 month of frozen storage (tms) at −20°C.
Viability.
Bacterial cell concentrations (CFU ml−1) were determined by using the agar plate count method before and after freezing and after 1 month of storage at either −20°C or −80°C. MRS (Biokar Diagnostics, France) was the specific medium used for L. delbrueckii subsp. bulgaricus CFL1. Petri dishes were incubated under anaerobic conditions (GENbox96124; bioMérieux, Marcy l'Etoile, France) at 42°C for 48 h before cell counting.
Statistical analysis.
A two-factor analysis of variance (ANOVA) with two-factor interactions (Statgraphics Plus 3) was performed to determine the effects of the freezing protocol and the storage temperature. The Neuman-Keuls multiple comparison procedure was used to discriminate among the means for significant differences at the 5% confidence level.
Freeze fracture electron microscopy and freeze substitution.
After samples were frozen according to the three freezing protocols, using 10% glycerol as a cryoprotectant and with cells suspended in distilled water, conventional freeze fracture electron microscopy and freeze substitution of the frozen straws were carried out (27). Image analysis of ice crystal size was carried out with Optimas 6.1 (Imasys, Suresnes, France).
DSC.
The samples containing bacteria had a complex composition, making analysis of thermograms uncertain. To understand the composition of the freeze-concentrated matrix that cells are exposed to during freezing, the freezing medium (supernatant plus glycerol) was examined by DSC without bacteria present.
DSC measurements were carried out by using a power compensation differential scanning calorimeter (Pyris 1; Perkin-Elmer LLC, Norwalk, CT) equipped with a liquid nitrogen cooling accessory (CryoFill; Perkin-Elmer). Temperature calibration was done using cyclohexane (crystal-crystal transition at −87.1°C), mercury, and gallium (melting points of −38.6°C and −29.8°C, respectively). About 5 mg of each sample was placed in 50-μl Perkin-Elmer DSC sealed aluminum pans. An empty pan was used as a reference. Three cooling and heating profiles were used throughout the studies in order to simulate the real freezing protocols (FP 1, FP 2, and FP 3) (Fig. 1). Linear cooling and heating rates of 5°C min−1 and 300°C min−1 were used to study slow (FP 1) and rapid (FP 2 and FP 3) cooling kinetics, respectively. For the DSC profiles corresponding to the freezing conditions in FP 1 and FP 2, cholesterol was used as a nucleating agent (12). About 1 mg of cholesterol was added to the sample, and a 10-min holding step at −5°C was introduced before further cooling in order to induce nucleation at the same point in the freezing profile that manual nucleation was carried out previously. Samples were cooled to −175°C and scanned to 25°C at 10°C min−1. Ice crystallization was characterized by the latent heat of ice crystallization (ΔHc, in J g−1) from the area of the exothermic peak and the extrapolated peak onset temperature of ice crystallization (Tc, in °C). The latent heat of ice crystallization and the total dry matter were used to calculate the glycerol concentration in the freeze-concentrated matrix. The characteristic glass transition temperatures (Tg1′ and Tg2′) of liquid samples were determined as the midpoint temperatures of the heat-flow steps associated with glass transition with respect to ASTM Standard Method E 1356-91. Results were obtained from at least two replicates. Tg2′ was identified as the softening temperature at which the system exhibits an observable deformation (viscous flow in real time) under its own weight (31).
After each cooling profile, an annealing step at −20°C was applied for 30 to 60 min in order to simulate the impact of storage on ice crystallization and the glycerol concentration.
RESULTS
Freezing to liquid nitrogen temperatures. (i) Viability and acidification activity.
The viability and acidification activity of L. delbrueckii subsp. bulgaricus (2 × 10⁹ CFU ml−1; tmc, 210 min) decreased after freezing (CFU ml−1, ≤3.3 × 10⁸; tmf, ≥310 min) and were strongly dependent (P > 0.001 by ANOVA) on freezing kinetics. The minimum loss of viability and acidification activity was obtained following direct immersion in liquid nitrogen (FP 3) (Table 1). When samples were nucleated, the viability decreased from 2 × 10⁸ to 1 × 10⁸ CFU ml−1, and the tmf increased from 329 min to 355 min, for cooling rates of 2,500°C min−1 (FP 2) and 5°C min−1 (FP 1), respectively.
TABLE 1.
Viability and acidification activities after freezing and after 1 month of storage at −20°C and −80°C following three freezing protocols
| Freezing protocol | Mean (SD) after:
|
|||||
|---|---|---|---|---|---|---|
| Freezing
|
Storage at −20°C
|
Storage at −80°C
|
||||
| Viability (CFU ml−1 [108]) | tmf (min) | Viability (CFU ml−1 [106]) | tms (min) | Viability (CFU ml−1 [108]) | tms (min) | |
| 1 | 1.1 (0.1) | 355 (4) | 6.6 (0.5) | 480 (8) | 1.1 (0.1) | 367 (8) |
| 2 | 2.2 (0.2) | 329 (3) | 7.3 (0.8) | 476 (8) | 1.8 (0.2) | 350 (8) |
| 3 | 3.3 (0.4) | 310 (5) | 2.5 (0.6) | 522 (6) | 3.4 (0.2) | 304 (6) |
(ii) Freeze fracture electron microscopy.
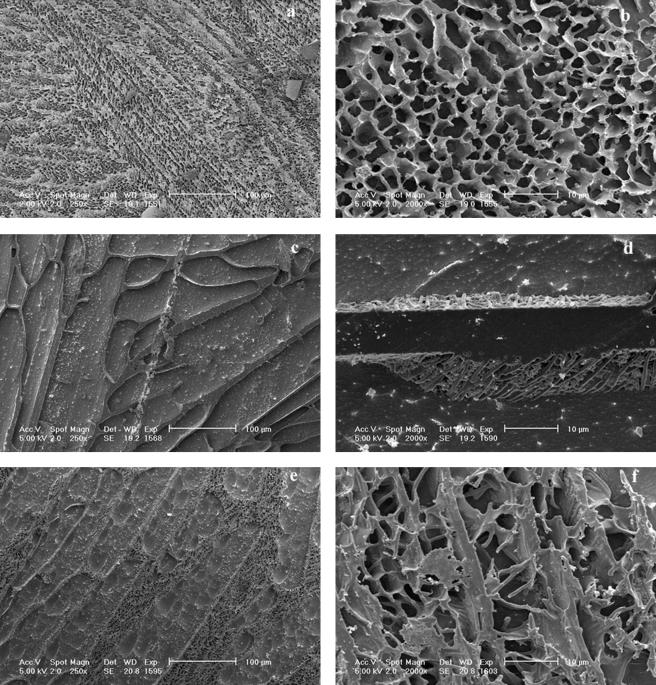
Cross-fracture of straws followed by deep etching to remove ice revealed the structure of the freeze-concentrated matrix containing supernatant, glycerol, and cells (Fig. 3). The distribution of ice crystals and the freeze-concentrated matrix was determined by the freezing method applied. In quenched samples (FP 3), the ice crystals (Fig. 3a and b) were 2.5 ± 1 μm in diameter (n = 600). The structure of the manually nucleated samples was dependent on the cooling rate after nucleation. For a cooling rate of 5°C min−1 (FP 1), large ice crystals (80 ± 30 μm) formed (Fig. 3c). The domains of freeze-concentrated material were homogenous in structure, and the interface between the freeze-concentrated material and etched ice was smooth. Samples immersed in liquid nitrogen after nucleation (FP 2) exhibited an intermediate behavior between the two previously described (Fig. 3e), and large ice crystals (about 70 μm) were observed. The freeze-concentrated matrix occupied a much larger cross-sectional area and contained numerous ice crystals, which were evident as etched pits.
FIG. 3.
Cryo-SEM of L. delbrueckii subsp. bulgaricus CFL1 suspended in glycerol and cooled by different processing conditions, i.e., FP 3 (a and b), FP 1 (c and d), and FP 2 (e and f).
The bacterial cell distribution in the frozen sample was determined by the ice crystal morphology. Following direct immersion in liquid nitrogen (FP 3), bacterial rods were entrapped in the freeze-concentrated matrix and in voids that would have contained ice crystals (Fig. 3b). When they were cooled at 5°C min−1 after ice nucleation (FP 1), all bacterial cells were densely packed into the freeze-concentrated material (Fig. 3d). When cells were immersed in liquid nitrogen after manual nucleation (FP 2), both morphologies were observed: bacterial cells migrated into the freeze-concentrated matrix, and some rods extended away from the freeze-concentrated material into ice crystal voids external to or within the freeze-concentrated matrix (Fig. 3f).
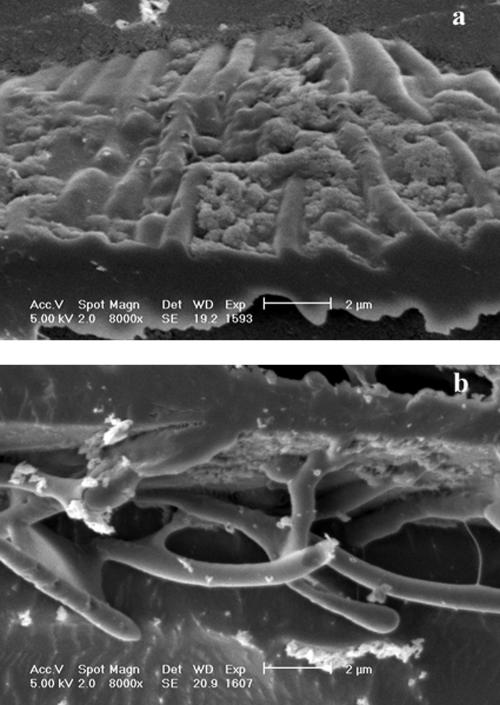
Bacterial cells were observed to accumulate at the interface between the freeze-concentrated material and ice crystals. When frozen at a rate of 5°C min−1 (FP 2), the bacteria at the interface were densely packed (Fig. 4a). At a higher rate of cooling (FP 3), the cells were more diffuse at the interface (Fig. 4b). Irregular clusters of material derived from the growth medium were also observed at the interface.
FIG. 4.
Cryo-SEM of L. delbrueckii subsp. bulgaricus CFL1 cooled with glycerol. Details of the interface between the freeze-concentrated matrix and ice for samples cooled either by FP 2 (a) or by FP 3 (b) are shown.
(iii) Freeze substitution electron microscopy.
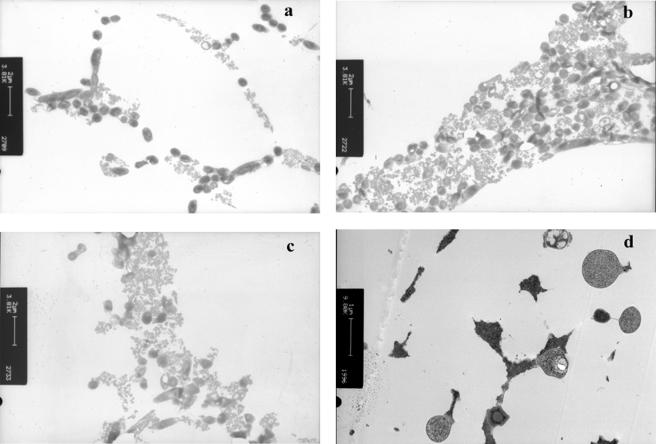
Freeze substitution and transmission electron microscopy revealed the distribution of cells within the freeze-concentrated matrix (Fig. 5). After direct immersion of cells in liquid nitrogen (FP 3), the distribution of bacteria was diffuse (Fig. 5a). In samples which were nucleated and then cooled at a low rate (FP 1), bacterial cells were densely packed in the freeze-concentrated matrix (Fig. 5b). Ice nucleation followed by rapid cooling (FP 2) resulted in a mixture of cells which were densely packed together and cells which were more diffuse (Fig. 5c). At all rates of cooling examined, some cells were observed to have vacuoles or “holes”; however, ice voids were not observed within the cells for any of the freezing methods examined. Freeze substitution of samples suspended in distilled water and directly immersed in liquid nitrogen (FP 3) revealed extensive intracellular ice (Fig. 5d).
FIG. 5.
Freeze substitution electron microscopy of L. delbrueckii subsp. bulgaricus CFL1 either suspended in glycerol and cooled by different processing conditions following freezing at different rates to −196°C (FP 3 [a], FP 1 [b], and FP 2 [c]) or suspended in distilled water and directly immersed in liquid nitrogen (d).
(iv) Effect of freezing protocol on the amount of ice formed.
DSC thermograms of the freezing medium following the different freezing protocols showed an exothermic peak during cooling which corresponded to ice crystallization. The amount of ice formed during cooling of small (5 mg) samples was determined from the area of the exothermic peak in the cooling scan of a DSC thermogram (ΔHc, in J g−1). In samples which were nucleated and then cooled at a low rate (5°C min−1; FP 1), the amount of ice formed during cooling was close to the value predicted from the equilibrium-phase diagram of NaCl-glycerol (81% of the total water content) (29). Samples which were nucleated and then cooled at a rate of 300°C min−1 formed less ice. Samples cooled at this rate without nucleation had only 35% of the total water content converted to ice. The corresponding glycerol concentration in the freeze-concentrated matrix was also calculated (Table 2). Samples which were nucleated and then cooled at a rate of 5°C min−1 had a glycerol concentration of 54%, while at 300°C min−1 the glycerol concentration in the freeze-concentrated solution was about 20%. Samples which were frozen rapidly without nucleation had an estimated glycerol concentration of 15%. During heating of the samples, two consecutive endothermic events corresponding to glass transition were observed, at Tg1′ and Tg2′. The nucleation step and an increase in the cooling rates tested did not modify the Tg1′ value (about −97°C), whereas Tg2′ values decreased from −51°C (FP 1) to −66°C (FP 3) (Table 2). The amount of ice determined from the endothermic peak in the warming scan of the DSC thermogram was found to be about 81% of the total water content, independent of the freezing protocol used.
TABLE 2.
Glass transition temperatures, heat of crystallization, amount of ice formed, and glycerol concentration for each freezing protocol applied
| Freezing protocol | Tg1′a (°C) | Tg2′a (°C) | Tg2′ after annealing at −20°Ca (°C) | ΔHca (J g−1) | Amt of iceb (%) | Glycerol concnb (%) |
|---|---|---|---|---|---|---|
| 1 | −97 | −51 | −48 | 232 | 81 | 54 |
| 2 | −97 | −56 | −50 | 150 | 53 | 21 |
| 3 | −96 | −66 | −56 | 100 | 35 | 15 |
Measured by DSC.
Calculated from ΔHc and the total water content.
Frozen storage at −20°C and −80°C. (i) Viability and acidification activity.
The viability and acidification activity after 1 month of frozen storage (tms) were dependent (P < 0.01 by ANOVA) on the freezing protocol and the storage temperature (Table 1). The cell concentration and the acidification activity decreased after 1 month of storage at −20°C (CFU ml−1, ≤7.3 × 10⁶; tms, ≥476 min). However, at −80°C, viability and acidification activity after frozen storage were preserved, irrespective of the freezing protocol applied.
The detrimental effect of storage at −20°C was reduced when samples were nucleated. Resistance to frozen storage was slightly higher for a cooling rate of 5°C min−1 after nucleation (lowest loss of acidification activity at −20°C [dtms = tms − tmf], 125 ± 10 min) than that after immersion in liquid nitrogen (FP 2; dtms = 147 ± 10 min) (Table 1). The lowest resistance to frozen storage at −20°C was obtained by freezing samples by direct immersion in liquid nitrogen (FP 3). About 50% of the loss of acidification activity took place during the first day of storage at −20°C after direct immersion in liquid nitrogen. However, both the viability and acidification activity of samples immersed in liquid nitrogen remained high when they were stored at −80°C.
(ii) Electron microscopy following storage at −20°C.
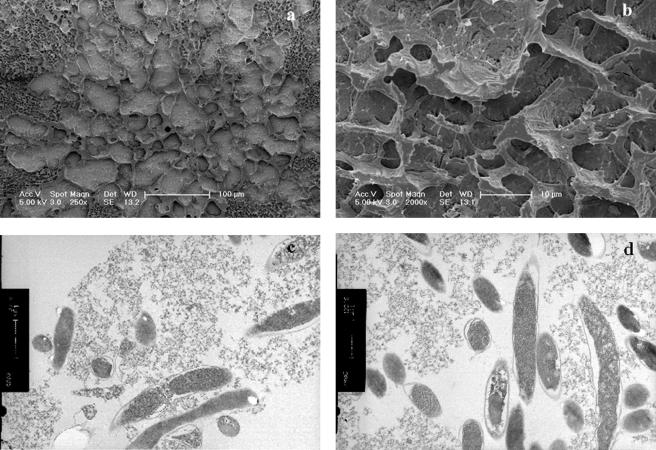
Samples which had been quenched (FP 3) were warmed to −20°C for 24 h and then immersed in liquid nitrogen until examined by freeze fracture and freeze substitution electron microscopy (Fig. 6). Freeze fracture electron microscopy revealed that compared with the initial quenched structure (Fig. 3a), extensive recrystallization had occurred (Fig. 6a), although this was not uniform. Some portions of the sample (Fig. 6b) had a structure similar to that observed after ice nucleation and slow cooling (Fig. 3c), while adjacent areas had a much finer ice structure. Freeze substitution (Fig. 6c and d) showed that cells were aggregated compared to the quenched sample (Fig. 5a) and that the cells appeared to be plasmolyzed. Intracellular ice was not evident.
FIG. 6.
Cryo-SEM (a and b) and freeze substitution electron microscopy (c and d) of L. delbrueckii subsp. bulgaricus CFL1 suspended in glycerol, cooled by FP 1, held at −20°C for 24 h, and then reimmersed in liquid nitrogen.
(iii) DSC following annealing at −20°C.
Samples following each freezing protocol in the DSC equipment were warmed to −20°C, held for 30 to 60 min, and then rescanned to 25°C. The annealing step did not modify the Tg1′ value, while Tg2′ values increased by 3°C (FP 1) to 10°C (FP 3) (Table 2).
DISCUSSION
Freezing effects.
The freezing protocol is one of the main factors determining the viability of bacteria during the freeze-thaw process (1, 8). The results of this study clearly show that the high cooling rate (2,500°C min−1) obtained by direct immersion in liquid nitrogen results in high survival rates of L. delbrueckii subsp. bulgaricus CFL1, in agreement with earlier reports on different LAB species (3, 11, 35).
It is generally assumed that at high rates of cooling, intracellular ice will form in bacteria. However, surprisingly little direct evidence of intracellular ice formation in bacteria has been presented. Rapatz and Luyet (30) observed crystalline ice inside bacteria (Escherichia coli) which were rapidly frozen in distilled water, but intracellular ice was not apparent when a 15% sucrose solution was used as a cryoprotectant. Intracellular ice was also observed when cell suspensions of Lactobacillus casei and Leuconostoc mesenteroides in a phosphate buffer were immersed in liquid nitrogen (1). However, other bacteria (Staphylococcus aureus, E. coli, and Serratia marcescens) subjected to the same protocol were found to have little or no intracellular ice (1). In the current study, intracellular ice was not observed in cells suspended in glycerol, even at high rates of cooling. We have confirmed that the freeze substitution method used in this study can detect intracellular ice in rapidly cooled L. delbrueckii subsp. bulgaricus cells suspended in distilled water (Fig. 5d). Therefore, with the protective medium used, it is not expected that intracellular ice will be formed, even at high rates of cooling.
It has been demonstrated that the viscosity of the residual unfrozen solution to which cells are exposed during freezing in the presence of glycerol increases rapidly. In the binary system of glycerol-water, the measured viscosity exceeded 1,000 cPa at −40°C, while the viscosity of a ternary system, glycerol-water-NaCl, exceeded 100,000 cPa at −55°C. Because of high viscosity, the diffusion process becomes limited, and the amount of ice formed becomes dependent on the rate of cooling (28). In the current study, the measured osmolality of the solution (10% [wt/wt] glycerol plus growth medium) in which the cells were suspended was 1,600 mosM, which is very similar (1,549 mosM) to that of the ternary system of water-glycerol (10% [wt/wt])-NaCl (0.15 M). In the bacterial solution, the suspending medium contained sugars which would be expected to increase the viscosity during freezing more than an ionic species would and to shift the glass transition to higher temperatures. This is consistent with the observation that at a low rate of cooling (5°C min−1), Tg2′ for the bacterial solution was −51°C, compared with −63°C for the ternary system of water-glycerol (10% [wt/wt])-NaCl.
The amount of ice formed in the freeze-concentrated matrix was determined by the freezing protocol. At a low rate of cooling (5°C min−1), the amount of ice formed (81% [wt/wt] ice/water) was in agreement with the values estimated from the equilibrium-phase diagram for the ternary system of H2O-NaCl-glycerol (29). As the cooling rate increased, the amount of ice formed decreased, to 53% (wt/wt) at 300°C min−1 following nucleation (the highest rate of cooling possible with the DSC equipment used in this study). Without the nucleation step, the amount of ice formed was 35%. The shift of Tg2′ values to lower temperatures at increased cooling rates also confirms the higher water contents of samples cooled rapidly than of those cooled slowly. Following slow freezing, the glycerol concentration of the matrix increased, as predicted by the phase diagram. The shift in Tg2′ following annealing suggests that the process of ice formation during cooling is limited by high viscosity, even at the lowest rate of cooling examined (5°C min−1).
The effects of the cooling rate on the process of ice formation in glycerol solutions and the ultrastructure of the freeze-concentrated matrix are consistent with previous work carried out on the ternary system of H2O-NaCl-glycerol (28).
The effects of the cooling rate have often been considered to simply relate to the time that cells are exposed to a concentration gradient predicted from the equilibrium-phase diagram. However, this is not the case with high cooling rates: both the composition of the medium around the cells changes and the diffusion of water from the cell may be modified. It is not appropriate to assume that the cells experience the solute concentration predicted by the equilibrium-phase diagram during rapid cooling.
It may also be noted that in samples in which controlled ice nucleation is induced and then cells are cooled rapidly, the domains of freeze-concentrated material may be larger than the diffusion distance. It would be expected that concentration gradients would be established within the freeze-concentrated material during cooling. The highest glycerol concentration would be at the interface between the freeze-concentrated material and the ice, and the lowest concentration would be in the middle of the domain, leading to constitutional supercooling (6). It is likely that cells at different positions within the freeze-concentrated material will encounter different concentration gradients during freezing and thawing.
Frozen storage effects.
Rapid freezing and slow warming have the most damaging effects on the viability of LAB (3) and on the survival of many other cell types (15, 18, 23, 36), and this observation is frequently used as evidence of the formation of intracellular ice during rapid freezing and recrystallization upon warming (22).
We have previously demonstrated (28) by cryo-scanning electron microscopy (cryo-SEM), conductivity, and DSC measurements of glycerol solutions that after rapid cooling, ice formation occurs within the freeze-concentrated matrix at some temperature below the value of Tg2′ determined for low rates of cooling. Upon sample warming, DSC indicates that the equilibrium amount of ice melts in all samples, irrespective of the initial cooling rate, and that Tg2′ shifts to a higher value after annealing of samples at −20°C. The results for the more complex freezing medium studied here confirm these previous results with a defined model system. It can be concluded that at high rates of cooling, there is insufficient opportunity for ice crystal growth to occur during cooling, and that upon warming, migratory recrystallization occurs when molecular mobility increases, allowing the crystallization of residual water that was kinetically inhibited during cooling. Electron microscopy of rapidly frozen bacteria held at a high subzero temperature did not reveal the growth of intracellular ice; instead, cells were plasmolyzed.
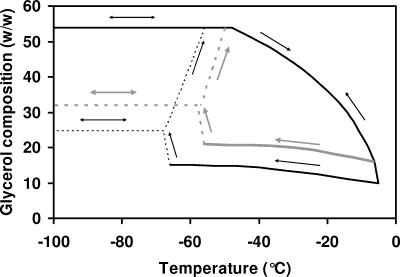
Figure 7 is a schematic of the stresses experienced by L. delbrueckii subsp. bulgaricus cells following the experimental protocols used in this study.
FIG. 7.
Schematic of the glycerol concentrations encountered by cells following FP 1, FP 2, and FP 3. The glycerol concentrations and Tg2′ values are from Table 2. Dotted lines indicate less certain glycerol concentration values reached following FP 2 and FP 3.
In FP 1, ice nucleation is initiated at temperatures close to the melting point. The cells are exposed at all temperatures to the concentration of glycerol predicted from the equilibrium-phase diagram, and at −51°C, the glycerol solution will vitrify. Upon warming, the cell environment is diluted from the maximally concentrated solution to the original concentration.
In FP 2, ice nucleation is initiated at temperatures close to the melting point. At any temperature during subsequent rapid cooling, the cells are exposed to a concentration of glycerol significantly lower than that predicted from the equilibrium-phase diagram. At some temperature below −56°C, ice nucleates within the freeze-concentrated matrix (Fig. 3d and f), and the concentration of glycerol then attains a more concentrated value and vitrifies. Upon warming above Tg2′, the cells which have been in equilibrium with 21% glycerol during cooling are initially exposed to a higher concentration of glycerol (54%).
In FP 3, ice nucleation is not initiated, and at some temperature below −66°C, it is assumed that ice nucleates within the freeze-concentrated matrix and that the concentration of glycerol will then attain a more concentrated value and vitrify. Upon warming above Tg2′, the cells which have been in equilibrium with 15% glycerol during cooling are initially exposed to a higher concentration of glycerol (54%).
The transitions occurring during the warming of rapidly cooled samples may be damaging, in particular for cells stored for any time at a temperature above Tg2′ or during slow warming. This mechanism could explain the damage seen in human spermatozoa frozen rapidly in glycerol, where intracellular ice is not observed by either cryo-SEM or freeze substitution electron microscopy (26).
Samples undergoing FP 2 and FP 3 have similar nonideal behaviors during freezing but differ in their stabilities during storage at −20°C. This could be due to their local microenvironments. For FP 2, the cells are packed together during the freezing process, with many cell-to-cell contacts (Fig. 3e and f), while for FP 3, the cells are more dispersed, with more cell-to-ice and cell-to-freeze-concentrated-matrix contacts (Fig. 3a and b). The cell density used in this work is high (109 cells ml−1 before freezing), and ultrastructural studies revealed that there are many cell-to-cell interactions in the frozen state (Fig. 3d). The survival of bacteria following freezing and thawing depends on the concentration of the cells, with increased survival observed for high initial cell concentrations (23). The surviving fraction of freeze-dried LAB (L. delbrueckii subsp. bulgaricus and Streptococcus thermophilus) also increased with increasing biomass concentrations (it was highest at 1010 cells ml−1; the concentrations studied were 104 to 1010 cells ml−1), which was ascribed to mutual shielding of the microorganisms against severe environmental conditions by reducing the interfacial area between cells and the external medium (4).
Other cryoprotectants which have high viscosities during freezing, for example, sugars and polymers such as maltodextrin (14, 21), are the most effective cryoprotectants during high rates of cooling for LAB (7, 16, 34, 35). Cryoprotectants with low viscosities, such as dimethyl sulfoxide and methanol, which do not modify the structure of the freeze-concentrated material at high rates of cooling (28), have not been reported for use with LAB and offer poor protection to other cell types, e.g., spermatozoa and red blood cells, at high rates of cooling.
An understanding of the processes affecting the viscosity of the freezing medium during cellular freezing will be expected to lead to the development of specific protocols appropriate for the cryopreservation of LAB concentrates.
Conclusions.
This work has shown that the resistance of L. delbrueckii subsp. bulgaricus CFL1 to freezing and storage in the frozen state depends both on the freezing conditions and on the storage temperature. The viability and acidification activity after freezing were found to be highest at a very high cooling rate (2,500°C/min [immersion in liquid nitrogen]), but only a low storage temperature (−80°C) preserved this state. In contrast, low cooling rates would be preferred if a high storage temperature (−20°C) was employed.
The loss of viability and acidification activity during freezing at high cooling rates and storage at −20°C cannot be ascribed to the formation of intracellular ice. We propose that cell plasmolysis occurs due to an osmotic imbalance encountered by cells during the warming of rapidly cooled samples, in particular for cells stored for any time at a temperature above the glass transition temperature Tg2′.
Acknowledgments
We thank A. J. Burgess and J. N. Skepper (Multi Imaging Centre, University of Cambridge) for electron microscopy.
REFERENCES
- 1.Albrecht, R. M., G. R. Orndorff, and A. P. MacKenzie. 1973. Survival of certain microorganisms subjected to rapid and very rapid freezing on membrane filters. Cryobiology 10:233-239. [DOI] [PubMed] [Google Scholar]
- 2.Archer, D. L. 2004. Freezing: an underutilized food safety technology? Int. J. Food Microbiol. 90:127-138. [DOI] [PubMed] [Google Scholar]
- 3.Baumann, D. P., and G. W. Reinbold. 1966. Freezing of lactic cultures. J. Dairy Sci. 49:259-263. [DOI] [PubMed] [Google Scholar]
- 4.Bozoglu, T. F., M. Ozilgen, and U. Bakir. 1987. Survival kinetics of lactic acid starter cultures during and after freeze drying. Enzyme Microb. Technol. 9:531-537. [Google Scholar]
- 5.Corrieu, G., H. E. Spinnler, D. Picque, and Y. Jomier. 1988. Automated system to follow up and control the acidification activity of lactic acid starters. French patent 2629612, 6.10.89.
- 6.Davies, G. J. 1973. Solidification and casting. Applied Science Publishers, London, United Kingdom.
- 7.De Antoni, G. L., P. Pérez, A. Abraham, and M. C. Añon. 1989. Trehalose, a cryoprotectant for Lactobacillus bulgaricus. Cryobiology 26:149-153. [Google Scholar]
- 8.Dumont, F., P.-A. Marechal, and P. Gervais. 2004. Cell size and water permeability as determining factors for cell viability after freezing at different cooling rates. Appl. Environ. Microbiol. 70:268-272. [DOI] [PMC free article] [PubMed] [Google Scholar]
- 9.Fonseca, F., C. Beal, and G. Corrieu. 2001. Operating conditions that affect the resistance of lactic acid bacteria to freezing and frozen storage. Cryobiology 43:189-198. [DOI] [PubMed] [Google Scholar]
- 10.Fonseca, F., C. Béal, and G. Corrieu. 2000. Method of quantifying the loss of acidification activity of lactic acid starters during freezing and frozen storage. J. Dairy Res. 67:83-90. [DOI] [PubMed] [Google Scholar]
- 11.Foschino, R., E. Fiori, and A. Galli. 1996. Survival and residual activity of Lactobacillus acidophilus frozen cultures under different conditions. J. Dairy Res. 63:295-303. [Google Scholar]
- 12.Head, R. B. 1961. Steroids as ice nucleators. Nature (London) 191:1058-1059. [DOI] [PubMed] [Google Scholar]
- 13.Karlsson, J. O. M., E. G. Cravalho, and M. Toner. 1993. Intracellular ice formation: causes and consequences. Cryo Lett. 14:323-335. [Google Scholar]
- 14.Kerr, W. L., and D. S. Reid. 1994. Temperature dependence of the viscosity of sugar and maltodextrin solutions in coexistence with ice. Lebensm. Wiss. Technol. 27:225-231. [Google Scholar]
- 15.Koshimoto, C., and P. Mazur. 2002. Effects of cooling and warming rate to and from −70 degrees C, and effect of further cooling from −70 to −196 degrees C on the motility of mouse spermatozoa. Biol. Reprod. 66:1477-1484. [DOI] [PubMed] [Google Scholar]
- 16.Lagoda, I. V., and L. A. Bannikova. 1983. Some factors affecting the quality and the stability of frozen bacterial concentrates of mesophilic lactic acid bacteria. Dairy Sci. Abstr. 45:760. [Google Scholar]
- 17.Lamprech, E. D., and E. M. Foster. 1963. The survival of starter organisms in concentrated suspensions. J. Appl. Bacteriol. 26:359-369. [Google Scholar]
- 18.Leibo, S. P., J. Farrant, P. Mazur, M. G. J. Hanna, and L. H. Smith. 1970. Effects of freezing on marrow stem cell suspension interactions of cooling and warming rates in the presence of PVP, sucrose, or glycerol. Cryobiology 6:315-332. [DOI] [PubMed] [Google Scholar]
- 19.Leroy, F., and L. De Vuyst. 2004. Lactic acid bacteria as functional starter cultures for the food fermentation industry. Trends Food Sci. Technol. 15:67-78. [Google Scholar]
- 20.Lund, B. M. 2000. Freezing, p. 122-145. In B. M. Lund, T. C. Baird-Parker, and G. W. Gould (ed.), The microbiological safety quality food, vol. 1. Springer-Verlag, London, England. [Google Scholar]
- 21.Maltini, E., and M. Anese. 1995. Evaluation of viscosities of amorphous phases in partially frozen systems by WLF kinetics and glass transition temperatures. Food Res. Int. 28:367-372. [Google Scholar]
- 22.Mazur, P. 1984. Freezing of living cells: mechanisms and implications. Am. J. Physiol. C 16:125-142. [DOI] [PubMed] [Google Scholar]
- 23.Mazur, P. 1968. Interaction of cooling velocity, temperature, and warming velocity of frozen and thawed yeast. Cryobiology 5:1-17. [DOI] [PubMed] [Google Scholar]
- 24.Mazur, P. 1966. Physical and chemical basis of injury in single-celled micro-organisms subjected to freezing and thawing, p. 213-315. In H. T. Meryman (ed.), Cryobiology. Academic Press, London, United Kingdom.
- 25.Mazur, P. 1977. The role of intracellular freezing in the death of cells cooled at supraoptimal rates. Cryobiology 14:251-272. [DOI] [PubMed] [Google Scholar]
- 26.Morris, G. J. 13. April 2006. Rapidly cooled human sperm: no evidence of intracellular ice formation. Hum. Reprod. [Epub ahead of print.] [DOI] [PubMed]
- 27.Morris, G. J., E. Acton, and S. Avery. 1999. A novel approach to sperm cryopreservation. Hum. Reprod. 14:1013-1021. [DOI] [PubMed] [Google Scholar]
- 28.Morris, G. J., M. Goodrich, E. Acton, and F. Fonseca. 2006. The high viscosity encountered during freezing in glycerol solutions: effects on cryopreservation. Cryobiology 52:323-334. [DOI] [PubMed] [Google Scholar]
- 29.Pegg, D. E. 1983. Simple equations for obtaining melting points and eutectic temperatures for the ternary system glycerol/sodium chloride/water. Cryo Lett. 4:259-268. [Google Scholar]
- 30.Rapatz, G., and B. Luyet. 1963. Electron microscopy study of the formation of ice in bacteria upon freezing of their suspensions, abstr. WE11. Abstr. 7th Annu. Meet. Biophys. Soc. Biophysical Society, Bethesda, Md.
- 31.Shalaev, E. Y., and F. Franks. 1995. Structural glass transition and thermophysical processes in amorphous carbohydrates and their supersaturated solutions. J. Chem. Soc. Faraday Trans. 91:1511-1517. [Google Scholar]
- 32.Smittle, R. B., S. E. Gilliland, and M. L. Speck. 1972. Death of Lactobacillus bulgaricus resulting from liquid nitrogen freezing. Appl. Microbiol. 24:551-554. [DOI] [PMC free article] [PubMed] [Google Scholar]
- 33.Stadhouders, J., L. A. Jansen, and G. Hup. 1969. Preservation of starters and mass production of starter bacteria. Neth. Milk Dairy J. 23:182-199. [Google Scholar]
- 34.To, C. S. B., and M. R. Etzel. 1997. Spray drying, freeze-drying, or freezing of three different lactic acid bacteria species. J. Food Sci. 62:576-585. [Google Scholar]
- 35.Tsvetkov, T., and I. Shishkova. 1982. Studies on the effects of low temperatures on lactic acid bacteria. Cryobiology 19:211-214. [DOI] [PubMed] [Google Scholar]
- 36.Woelders, H., and A. P. Malva. 1998. How important is the cooling rate in cryopreservation of (bull) semen, and what is its relation to thawing rate and glycerol concentration. Reprod. Domest. Anim. 33:299-305. [Google Scholar]


