Abstract
When myosin is attached to actin in a muscle cell, various structures in the filaments are formed. The two strongly bound states (A·M·ADP and A·M) and the weakly bound A·M·ATP states are reasonably well understood. The orientation of the strongly bound myosin heads is uniform (“stereospecific” attachment), and the attached heads exhibit little spatial fluctuation. In the prehydrolysis weakly bound A·M·ATP state, the orientations of the attached myosin heads assume a wide range of azimuthal and axial angles, indicating considerable flexibility in the myosin head. The structure of the other weakly bound state, A·M·ADP·Pi, however, is poorly understood. This state is thought to be the critical pre-power-stroke state, poised to make the transition to the strongly binding, force-generating states, and hence it is of particular interest for understanding the mechanism of contraction. However, because of the low affinity between myosin and actin in the A·M·ADP·Pi state, the structure of this state has eluded determination both in isolated form and in muscle cells. With the knowledge recently gained in the structures of the weakly binding M·ATP, M·ADP·Pi states and the weakly attached A·M·ATP state in muscle fibers, it is now feasible to delineate the in vivo structure of the attached state of A·M·ADP·Pi. The series of experiments presented in this article were carried out under relaxing conditions at 25°C, where ∼95% of the myosin heads in the skinned rabbit psoas muscle contain the hydrolysis products. The affinity for actin is enhanced by adding polyethylene glycol (PEG) or by lowering the ionic strength in the bathing solution. Solution kinetics and binding constants were determined in the presence and in the absence of PEG. When the binding between actin and myosin was increased, both the myosin layer lines and the actin layer lines increased in intensity, but the intensity profiles did not change. The configuration (mode) of attachment in the A·M·ADP·Pi state is thus unique among the intermediate attached states of the cross-bridge ATP hydrolysis cycle. One of the simplest explanations is that both myosin filaments and actin filaments are stabilized (e.g., undergo reduced spatial fluctuations) by the attachment. The alignment of the myosin heads in the thick filaments and the alignment of the actin monomers in the thin filaments are improved as a result. The compact atomic structure of M·ADP·Pi with strongly coupled domains may contribute to the unique attachment configuration: the “primed” myosin heads may function as “transient struts” when attached to the thin filaments.
INTRODUCTION
The basic process of muscle contraction is well understood: it is a result of cyclic interactions between myosin and actin, driven by the chemical free energy released from ATP hydrolysis. Although the general framework of the kinetic scheme of ATP hydrolysis (Scheme 1) (1–3) and crystal structures of the myosin head and the actin monomer are now available, details of the mechanism of transduction from chemical to mechanical energy occurring in muscle still remain unresolved. One of the obstacles is that most of the current understanding of muscle contraction at the molecular level is based on results obtained from isolated in vitro systems, even though many of the results have provided high resolution and critical information. Structural information obtained by x-ray diffraction from intact or permeabilized muscle fibers has provided a critical step toward bridging the gap between the information obtained from the in vitro systems and that from native muscle cells.
Figure s1.
SCHEME 1
Distribution and conformation of the myosin heads (cross-bridges) in the thick filament in muscle fibers have been probed by low-angle x-ray diffraction. Filament structures associated with seven of the eight ATP hydrolysis intermediate states (Scheme 1) in permeabilized muscle have been reported (4). It was found that the detached cross-bridges with bound hydrolysis products (i.e., in the M·ADP·Pi state) are arranged in an ordered helical array around the thick filament backbone, whereas in other states the detached cross-bridges (i.e., in the M·ATP, M·ADP, or M states) are disordered (5). As temperature is raised from <5°C to >20°C, a dramatic disorder ⇄ order transformation takes place in the thick filament concomitantly with a shift of the equilibrium of M·ATP ⇄ M·ADP·Pi toward the product state. Further studies indicated that the primary cause of helical ordering required the myosin heads to be in the switch-II closed conformational state as defined by Geeves and Holmes (6), rather than requiring hydrolysis per se (7,8).
When myosin is attached to actin, structures of the filaments formed by the two strongly attached states (A·M·ADP and A·M) in muscle are reasonably well understood: the orientation of the attached myosin heads is uniform (“stereospecific” attachment), and the attached heads exhibit little spatial fluctuation. In the prehydrolysis A·M·ATP state, the orientations of the attached myosin heads assume a wide range of azimuthal and axial angles, indicating considerable flexibility in the myosin head. The binding site of actin near the N-terminus for this state differs from the putative site for the nucleotide-free myosin binding (9).
The structure of the last remaining state (A·M·ADP·Pi) is the most elusive for determination and yet the most interesting. It is generally thought that the transition from the weakly bound to strongly bound states, with accompanying conformational changes, underlies the force generation mechanism. The complex A·M·ADP·Pi is poised to make the transition to the strongly binding force-generating states, and hence it is of particular interest for understanding the mechanism of contraction. However, because of the particularly low affinity between myosin and actin in the A·M·ADP·Pi complex, the the structure of this weakly bound state has eluded determination either in isolated form or in muscle cells. With the knowledge recently gained in the structures of the three weak binding states (M·ATP, A·M·ATP, and M·ADP·Pi) (5,9,10) in muscle fibers, it is now feasible to delineate the in vivo structure of the attached state of A·M·ADP·Pi.
To optimize the conditions for studying the A·M·ADP·Pi population, the series of experiments presented in this article were carried out at 25°C, where ∼95% of the myosin heads in the skinned rabbit psoas muscle contain the hydrolysis products. The actin affinity is enhanced by adding polyethylene glycol (PEG) or by lowering the ionic strength from 200 mM to 50 mM in the bathing solution. Corresponding binding constants in solution were measured under conditions closely matched to those used in the x-ray experiments.
Preliminary results have been presented previously (11).
METHODS
Muscle preparation and solutions
Single bundles of muscle fibers
All experiments were performed on chemically skinned bundles of fibers of rabbit psoas major. Immediately after dissection, muscle strips ∼1 mm in width were attached at the two ends with the muscle kept at resting length. The strips were incubated for 1–2 h at 5°C in skinning solution with 0.5% Triton X-100 and then were transferred to skinning solution without the detergent. Single bundles, fasciculi, ∼0.3 mm × 0.6 mm in cross section and ∼30 mm in length, were dissected from the larger strip with care. A single bundle was mounted in a specimen chamber equipped with a motor for slow, steady stretching. The sarcomere length (SL) of the bundles was adjusted to 2.4 μm. Some bundles for nonoverlap experiments were stretched over a period of 3–4 h to SL = ∼4.2 μm, and their sarcomere lengths were monitored by laser light diffraction during stretch (12).
Solutions
The following solutions were used for the experiments. 1), Skinning solution (in mM): 5 KH2PO4, 5 MgAc, 5 EGTA, 3 Na2ATP, 50 CrP, 5 NaN3, 5 DTT, protease inhibitor cocktail from Sigma (St. Louis, MO) (100 AEBSF, 4 Bestatin, 1.4 E-64, 2.2 Leupeptin, 1.5 Pepstatin A, 80 μM Aprotinin), pH 7.0. 2), Relaxing solution containing (in mM): 2 MgATP, 2 MgCl2, 2 EGTA, 5 DTT, 10 imidazole, pH 7.0, ionic strength (μ) = 27 mM. Ionic strength (μ) was adjusted by adding 10 creatine phosphate and 23, 73, 123, or 173 potassium propionate to 50, 100, 150, or 200 mM. To complete the ATP-backup system, ∼109 unit/ml creatine kinase (CPK) was added in the relaxing solution. 3), Rigor solution contained (in mM): 2.5 EGTA, 2.5 EDTA, 10 imidazole, 5 DTT, 150 potassium propionate, pH 7.0, μ = 170 mM. Before the rigor solution was applied, the bundles were rinsed several times with a “quick rinse” solution containing (in mM): 5 EGTA, 15 EDTA, 20 imidazole, pH 7.0, μ = 70 mM. 4), Relaxing solution with PEG: The desired percentage of PEG (w/v) was added to the relaxing solution. PEGs were from Sigma-Aldrich. PEG-1000 (average molecular weight = 1000) was used for these experiments; weight percentage (30%) PEG stock solutions were prepared gravimetrically and diluted volumetrically to prepare desired solutions.
During the entire course of the experiments, the solution in the chamber was continuously mixed by a push-pull syringe pump at the rate of ∼0.5 ml/s to minimize any gradient along the length of the bundles. To reduce radiation damage, the specimen chamber was moved up and down continuously for a length of 8 mm at a constant rate of 4 mm/s by a stepping motor (Aerotech, Pittsburgh, PA).
PEG treatment of fiber bundles
Addition of PEG can potentiate the formation of the actomyosin complex in solution (13,14). To characterize the structure of the actomyosin complex in the A·M·ADP·Pi state, we applied PEG in the relaxed fibers at 25°C because at this temperature the equilibrium favors the hydrolyzed states M·ADP·Pi ⇄ A·M·ADP·Pi . Therefore, with the addition of PEG, most of the increased actomyosin complexes would be in the A·M·ADP·Pi state. Low-molecular-weight PEG in the range of 300 to 4000 Da readily diffuses into the interfilament space (15). At the beginning of this series of experiments, we tried both PEG-1000 and PEG-3000 in various concentrations (0%, 2.5%, 5%, 7.5%, and 10%) to find the optimum condition. In the case of PEG-3000, particularly at higher concentrations, a split of the reflection peaks on the equator was frequently observed, signifying a heterogeneous distribution of lattice spacings and nonuniform interaction between the filaments. PEG-1000 made much sharper equatorial reflections and stable lattice spacings. Experiments also showed that the quality of the diffraction patterns started to deteriorate with the PEG concentrations at 7.5% or higher. Therefore, PEG-1000 at a concentration of 5% was chosen as the optimum condition for enhancing the formation of the A·M·ADP·Pi state used for this experiment. To ensure that the diffusion of PEG into the interfilament space is complete and uniform, the muscle bundles were kept in the PEG solution for at least 20 min before the x-ray diffraction patterns were taken.
Solution studies
Steady-state actin-activated ATPase and centrifuge binding experiments were done in 5 mM MOPS, 20 mM KAc, 2 mM MgCl2 with and without the addition of a 5% w/v solution of 1 kDa PEG according to published methods (16). Active enzyme binding in the presence of ATP was measured by centrifuging 0.5 ml of a solution containing S1, actin, and 1 mM ATP for 20 min at 120,000 × g in a Beckman Ti65 rotor to pellet the actin and any bound S1. The amount of myosin-S1 not bound to actin was determined by steady-state measurement of myosin activity in the supernatant. Actin and ATP were added to the 0.4 ml of the supernatant to obtain a final α-actin concentration of 20 μM and an ATP concentration of 1 mM, and the production of phosphate was determined by colorimetric measurement (17). Actin and the A1 fraction of myosin-S1 were prepared from fresh rabbit skeletal muscle (18). Binding and kinetic parameters for steady-state activity, binding, and rapid quench experiments were fit using nonlinear least-squares routines in the Scientist package (Micromath, Ogden, UT).
X-ray source, camera, and detector system
The experiments were performed at beamline X27C (Advanced Polymer PRT) at the National Synchrotron Light Source, Brookhaven National Laboratory, Upton, NY. The optics of X27C uses a double-multilayer (silicon/tungsten) monochromator. The wavelength was chosen at 1.3 Å three-pinhole system is used for collimating the monochromatized beam. The beam size at the specimen is ∼0.4 mm in diameter, and specimen-to-detector distance was 1500 mm. A MAR Research CCD detector (Hamburg, Germany) with a pixel size of 0.1 mm × 0.1 mm was used for collecting the x-ray data.
The fiber bundle (width ∼300 μm) was held vertical. The exposure time for each pattern was 2 min in general. The maximum accumulated exposure time for each bundle was ≤20 min. In some cases, the solution background patterns were taken at the end of a series of x-ray exposures.
The spacings of all reflections were calibrated at the beginning of this series of experiments by the 1/144.3 Å−1 meridional reflection from skinned rabbit psoas muscle in rigor at μ = 170 mM and T = 25°C (see Xu et al. (12) for details of the experimental protocols).
Data reduction and analysis
The data in the four quadrants were first rotated, folded, and averaged. A software program made slices parallel to the meridian (“vertical slices”) and to the equator (“horizontal slices”) of the diffraction patterns and summed the intensities within the slices to generate one-dimensional intensity profiles for further analysis. The widths of the slices were chosen to include the entire widths of the peaks of layer lines. Within each slice, a linear background was first subtracted using PCA program (Nucleus, Oak Ridge, TN) in the region of maxima. Intensities above the background were then integrated. To compare directly the intensities obtained under different conditions with minimum error, diffraction patterns were recorded from the same bundles for all the conditions of interest (e.g., in the solutions with and without PEG). To combine data from different bundles with different sizes for statistical analysis, all integrated intensities (I) in the tables were normalized by the integrated intensity of the first peak of the first myosin layer line (Imll1) obtained under the condition of relaxing solution at μ = 200 mM and 25°C.
Curve fitting
The observed layer lines were curve fitted by the PeakFit (Systat Software, Point Richmond, CA) application package. The first myosin layer lines were assumed to consist of contributions from unsampled filaments (i.e., myosin heads on each thick filament are not in axial register) and sampled filaments (i.e., myosin heads are in axial register). (“Sampling” results from the well-ordered lateral packing of the diffraction units (myosin heads). The sampled reflections appear on “row lines” that are parallel to the meridian. If the myosin heads were in precise axial register, the positions of the row lines would be indexed the same way as the equatorial reflections from the simple hexagonal lattice. In frog sartorius, however, the sampled reflections on the row lines revealed the existence of a superlattice; i.e., there is an axial shift between the adjacent myosin heads, forming a superlattice within the simple hexagonal lattice (19). The side of the superlattice unit cell was √3 times the side of the simple hexagonal lattice (19,20). In the study presented here, the sampling is assumed to originate from the simple hexagonal lattice and a superlattice the same as that found in the frog sartorius.) The intensities of the sampled reflections were added to the unsampled layer lines. The functions used to fit the curves were assumed to be Gaussian, which has three parameters: peak amplitude, peak width, and peak position. For the unsampled peak, the three parameters were allowed to vary freely; for each sampled reflection, the parameters consisted of only the amplitude and the width. The positions of the sampled peaks were not varied but indexed on the basis of the hexagonal lattice and the superlattice. The unsampled peak and the sampling peaks were fitted simultaneously.
RESULTS
At 25°C, diffraction patterns from skinned rabbit psoas fibers in relaxing solution (μ = 200 mM and 50 mM) exhibited clear layer lines originating from the thick filaments (myosin layer lines) and weak layer lines from the thin filaments (actin layer lines), as reported previously. When the affinity between actin and myosin was increased to form mostly A·M·ADP·Pi by adding PEG or lowering the ionic strength, both the myosin layer lines and the actin layer lines increased in intensity. The results presented below were generally obtained from skinned rabbit psoas fiber bundles under relaxing condition at 25°C and 200 mM ionic strength (the “regular condition”) or at 50 mM ionic strength (the “low-ionic-strength condition”), both in the presence and in the absence of PEG, unless stated otherwise.
Diffraction patterns obtained with and without 5% PEG in the relaxing solution
Myosin layer lines
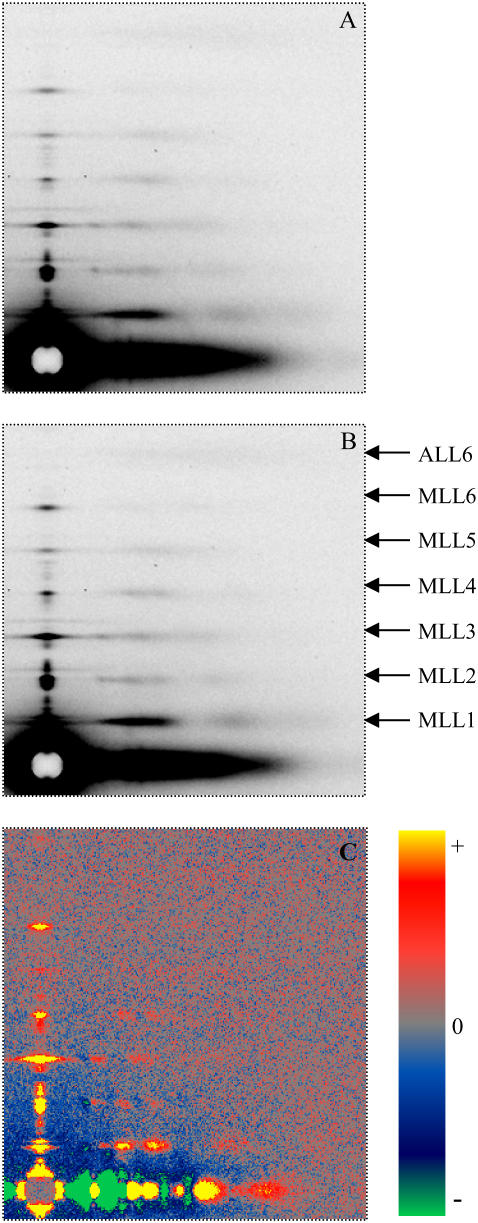
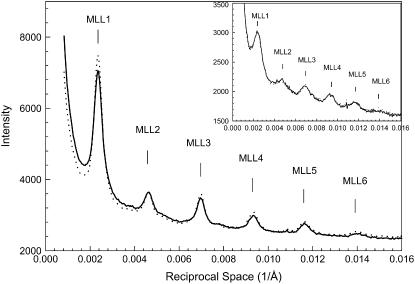
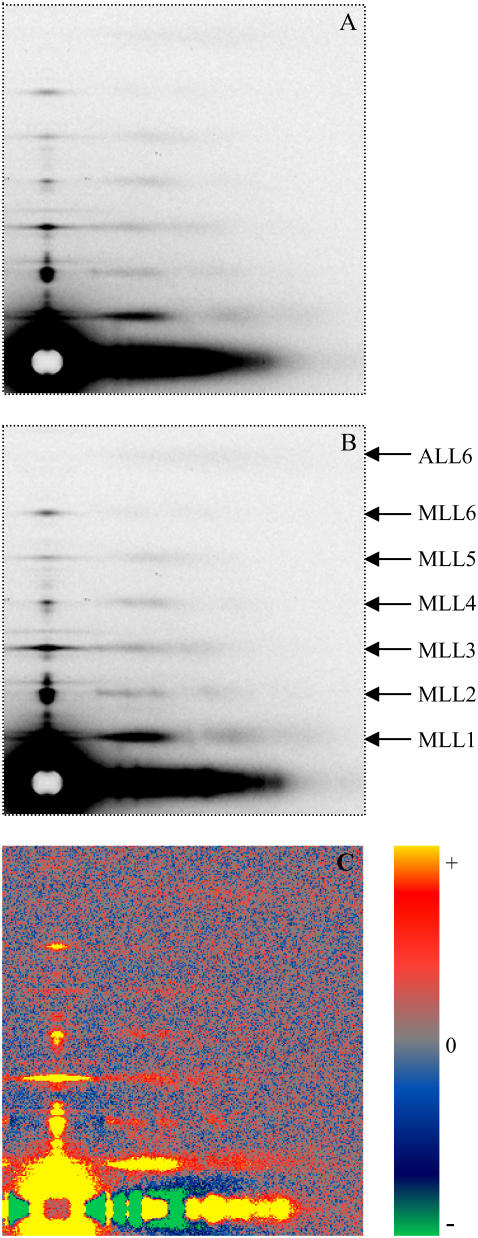
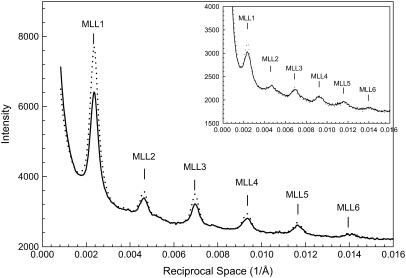
Fig. 1 exhibits typical diffraction patterns obtained under the “regular condition” without (Fig. 1 A) and with 5% PEG (Fig. 1 B). The six orders of myosin layer lines are well defined. The difference pattern (Fig. 1 C) is the result of subtracting Fig. 1 A from Fig. 1 B. It reveals significant increases in the six myosin layer lines and a weak but detectable increase in the sixth actin layer line. The difference in intensities could not be caused by a change in scattering volume because the x-ray beam covered the entire width of the muscle despite changes in the lattice dimension (see Methods). Fig. 2 shows the profiles of the intensities along a slice parallel to the meridian from the patterns in Fig. 1, A and B. The range of the slice in the horizontal direction is between 0.002168 Å−1 and 0.007115 Å−1, covering ∼95% of the integrated intensity of the first maximum of the first myosin layer line (MLL1). With the addition of 5% PEG, the position and width of the myosin layer lines remain almost the same, but the integrated intensities of the peaks of the myosin layer lines increased. In particular, the intensity of IMLL1 increased by ∼20%. At μ = 50 mM, with the addition of 5% PEG, IMLL1 decreased by 10% at full-overlap sarcomere length and by 20% at nonoverlap. The cause of the latter observation is not clear. Statistics of the pooled data are shown in Table 1.
FIGURE 1.
X-ray diffraction patterns from single bundles of permeabilized rabbit psoas muscle fibers in the relaxing solutions. T = 25°C, sarcomere length (SL) = 2.4 μm. (A) Ionic strength μ = 200 mM without PEG and (B) with 5% PEG-1000. (C) The difference pattern obtained from subtracting A from B, showing the intensity increase of the myosin layer lines. The side bar indicates the color scale for gains and losses of intensities. The difference in intensities could not be caused by a change in scattering volume because the x-ray beam covered the entire width of the muscle despite changes in the lattice dimension (see Methods). The original patterns were obtained using the synchrotron radiation beamline X-27c at National Synchrotron Light Source, Brookhaven National Laboratory. The patterns A and B were averaged from three sets of data, each from a single bundle. The exposure time for each pattern was 2 min.
FIGURE 2.
Details of integrated intensities along a slice parallel to the meridian, which covers ∼95% of the first maximum of the first myosin layer line from the patterns shown in Fig. 1. The insets show the same profiles obtained from bundles at nonoverlap, SL = 4.2 μm. Solid line, μ = 200 mM without PEG; dotted line, μ = 200 mM with 5% PEG-1000.
TABLE 1.
Integrated intensities (I) and spacings (D) of first myosin layer line (MLL1) from muscle fibers under various conditions (T = 25°C)
|
|
SL = 2.4 μm
|
SL = 4.2 μm
|
||
|---|---|---|---|---|
| Conditions | IMLL1 mean ± SE (n) | DMLL1 mean ± SE (n) | IMLL1 mean ± SE (n) | DMLL1 mean ± SE (n) |
| Relaxed 200 | 1.00 (27) | 422.93 ± 0.45 (27) | 0.38 ± 0.04 (7) | 420.07 ± 1.46 (7) |
| Relaxed 200 + 5% PEG | 1.23 ± 0.03 (11) | 421.69 ± 0.35 (11) | 0.37 ± 0.04 (4) | 416.70 ± 1.89 (4) |
| Relaxed 50 | 1.54 ± 0.03 (14) | 423.75 ± 0.70 (14) | 0.49 ± 0.06 (7) | 421.90 ± 1.14 (7) |
| Relaxed 50 + 5% PEG | 1.44 ± 0.02 (3) | 423.28 ± 0.57 (3) | 0.38 ± 0.01 (2) | 420.21 ± 1.49 (2) |
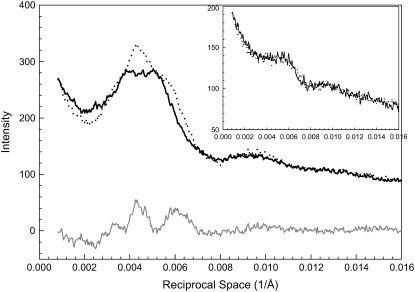
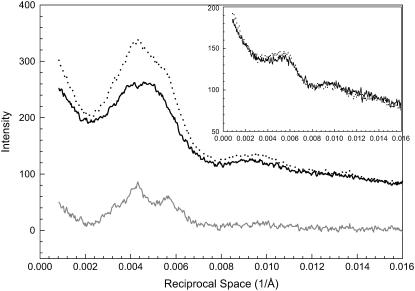
The profiles of the first myosin layer line and the difference profile (see Fig. 1 C) along a slice parallel to the equator are shown in Fig. 3. The slice centered at 0.002326 Å−1 (=1/430 Å) and extended between 0.002270 Å−1 and 0.002405 Å−1. The profiles, including the difference profile, revealed that there are peaks with small amplitudes superimposed on the layer lines. These minor peaks on the layer lines appear to be caused by lattice sampling because these peaks can be fitted by indexing the positions on a simple hexagonal lattice and a superlattice. Details of the sampling are discussed in a separate section.
FIGURE 3.
Details of intensity profiles along the first myosin layer lines from the patterns in Fig. 1. The inset shows the same type of profiles obtained from bundles at nonoverlap with SL = 4.2 μm. Solid line, μ = 200 mM without PEG; dotted line, μ = 200 mM with 5% PEG-1000; gray line, the difference profile based on Fig. 1 C. Sampling effects can be seen on the peaks (see section on Sampling and Fig. 12).
With the addition of 5% PEG, the lattice sampling of profiles of MLL1 remains except that the peak positions are shifted as a result of the decreased lattice spacing. Once the sampled peaks were stripped by curve fitting, the intensity of the unsampled MLL1 increased significantly.
Equatorial reflections
Higher orders from the hexagonal lattice up to [3,0] are visible in both patterns in Fig. 1, A and B. Lattice spacing d10 under the regular condition is 404 Å. It is decreased to 357 Å under the 5% PEG condition. The intensity ratio I11/I10 increased from 0.12 to 0.23, signifying increased attachment of cross-bridges. At μ = 50 mM, the increase in I11/I10 was not as substantial (from 0.31 to 0.36). The pooled data are listed in Table 2.
TABLE 2.
Intensity ratio (I11/I10) and lattice spacing (d10) of equatorial reflections from muscle fibers under various conditions (T = 25°C)
|
|
SL = 2.4 μm
|
SL = 4.2 μm
|
||
|---|---|---|---|---|
| Conditions | I11/I10 ± SEM (n) | d10 mean ± SE (n) | I11/I10 mean ± SE (n) | d10 mean ± SE (n) |
| Relaxed 200 | 0.12 ± 0.01 (27) | 404.04 ± 0.81 (27) | 1.23 ± 0.09 (7) | 268.71 ± 2.14 (7) |
| Relaxed 200 + 5% PEG | 0.23 ± 0.04 (11) | 356.92 ± 0.75 (11) | 1.13 ± 0.09 (4) | 260.48 ± 0.29 (4) |
| Relaxed 50 | 0.31 ± 0.01 (14) | 370.87 ± 1.33 (14) | 1.59 ± 0.11 (7) | 266.03 ± 1.94 (7) |
| Relaxed 50 + 5% PEG | 0.36 ± 0.01 (3) | 339.15 ± 1.45 (3) | 1.67 ± 0.03 (2) | 256.10 ± 0.03 (2) |
Meridional reflections
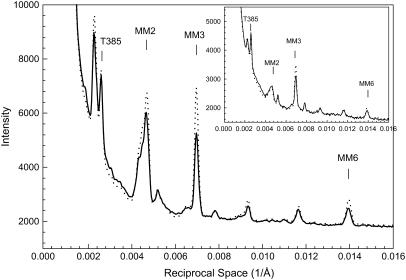
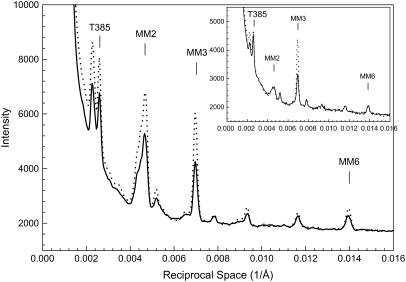
Almost all of the meridional reflections show an increase in intensity (Fig. 4). The increase in thick-filament-related meridional reflections (MM2, MM3, MM6) were particularly prominent (Table 3). An increase was also observed at μ = 50 mM (Table 3). In addition, the meridional reflection of 385 Å (from troponin in the thin filament) also had some increase, suggesting that the thin filaments have been stabilized by the attachment.
FIGURE 4.
Profiles of intensities along the meridian from the patterns in Fig.1, showing increases in intensities of the myosin-related reflections (MM2 and MM3) and the 385 Å meridional reflection from troponin in the thin filaments (T385). The inset shows the same type of profiles from bundles at SL = 4.2 μm. Solid line, μ = 200 mM without PEG; dotted line, μ = 200 mM with 5% PEG-1000. In the inset, the intensity of T385 reflection decreases with the addition of 5% PEG-1000.
TABLE 3.
Integrated intensities (I) and spacings (d) of third myosin meridional reflection (MM3) from muscle fibers under various conditions
|
|
SL = 2.4 μm
|
SL = 4.2 μm
|
||
|---|---|---|---|---|
| Conditions | IM3 mean ± SE (n) | dM3 mean ± SE (n) | IM3 mean ± SE (n) | dM3 mean ± SE (n) |
| Relaxed 200 | 0.35 ± 0.02 (27) | 143.21 ± 0.05 (27) | 0.29 ± 0.02 (7) | 143.60 ± 0.15 (7) |
| Relaxed 200 + 5% PEG | 0.61 ± 0.03 (11) | 143.23 ± 0.06 (11) | 0.44 ± 0.02 (4) | 143.48 ± 0.24 (4) |
| Relaxed 50 | 0.65 ± 0.04 (14) | 143.17 ± 0.05 (14) | 0.55 ± 0.02 (7) | 143.97 ± 0.08 (7) |
| Relaxed 50 + 5% PEG | 0.93 ± 0.08 (3) | 143.54 ± 0.10 (3) | 0.64 ± 0.02 (2) | 144.04 ± 0.01 (2) |
The sixth actin layer lines
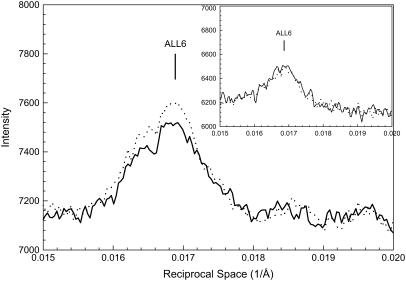
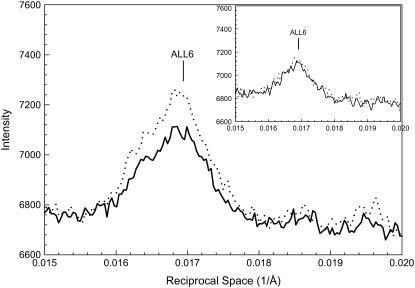
Fig. 5 shows the profiles of the intensities along a slice parallel to the meridian from the patterns in Fig. 1, A and B. The horizontal range of the slice covered the entire sixth actin layer line (ALL6) to include the total integrated intensities. This layer line is weak under regular conditions. Nevertheless, the attachment of myosin (i.e., A·M·ADP·Pi) brought about a measurable increase (∼20%) (Table 4). The increase is over the entire range of the intensity distribution, and the shape of the distribution of intensity along ALL6 is not shifted. In contrast, when M·ATP is attached to actin (i.e., A·M·ATP), little or no change in its intensity or distribution was observed (10). The attachment in the A·M·ADP·Pi state also differs from that in the strongly bound states (A·M·ADP and A·M), which brings about not only a substantial increase in intensity but also a shift in the distribution of intensity along the layer line.
FIGURE 5.
Profiles of intensity in a vertical slice of the sixth actin layer line from the patterns in Fig. 1. The inset shows the same type of profiles of the patterns obtained from bundles at the nonoverlap sarcomere length of 4.2 μm. Solid line, μ = 200 mM without PEG; dotted line, μ = 200 mM with 5% PEG-1000. The baselines were adjusted to the same background level.
TABLE 4.
Integrated intensities (I) and spacings (d) of the sixth actin layer line (ALL6) from muscle fibers under various conditions
|
|
SL = 2.4 μm
|
SL = 4.2 μm
|
||
|---|---|---|---|---|
| Conditions | IALL6 mean ± SE (n) | dALL6 mean ± SE (n) | IALL6 mean ± SE (n) | dALL6 mean ± SE (n) |
| Relaxed 200 | 0.31 ± 0.01 (27) | 59.30 ± 0.04 (27) | 0.34 ± 0.01 (7) | 59.26 ± 0.05 (7) |
| Relaxed 200 + 5% PEG | 0.38 ± 0.02 (11) | 59.36 ± 0.05 (11) | 0.30 ± 0.01 (4) | 59.15 ± 0.06 (4) |
| Relaxed 50 | 0.44 ± 0.01 (14) | 59.27 ± 0.05 (14) | 0.32 ± 0.02 (7) | 59.27 ± 0.05 (7) |
| Relaxed 50 + 5% PEG | 0.39 ± 0.01 (3) | 59.40 ± 0.05 (3) | 0.32 ± 0.02 (2) | 59.35 ± 0.08 (2) |
Diffraction patterns obtained at nonoverlap
To ascertain that the changes observed with the addition of PEG are caused by the cross-bridge attachment, diffraction patterns were obtained when the muscle fibers were stretched to nonoverlap sarcomere lengths (SL ∼4.2 μm). As shown in the inset panels in Figs.2–5, the effect of PEG is distinct from that found in full overlap. With 5% PEG, there is negligible change on MLL1, and there is a slight decrease in ALL6. The third meridional reflection shows an increase with PEG.
Diffraction patterns obtained under the low-ionic-strength conditions
It is well established that lowering the ionic strength would increase the binding affinity between myosin and actin, as shown by biochemical, mechanical, and structural studies (2). At 25°C, the increase in binding is distributed mostly in the A·M·ADP·Pi state. Although x-ray diffraction patterns at this temperature and under various ionic strength conditions have been reported (12), detailed comparative study of the layer lines have not been made.
Fig. 6, A and B, exhibit typical diffraction patterns obtained under the ionic strength 200 mM and 50 mM at 25°C. The patterns in the figure were averaged from three paired sets of data obtained under the same conditions. The results of increased binding in the A·M·D·Pi state induced by lowering the ionic strength (compare Figs. 6 A and B) are similar to those obtained under the PEG condition (compare Fig. 1, A and B). The difference pattern (Fig. 6 C) obtained by subtracting Fig. 6 A from Fig. 6 B, however, reveals a more significant increase in myosin layer lines.
FIGURE 6.
X-ray diffraction patterns from single bundles of permeabilized rabbit psoas muscle fibers in the relaxing solutions. T = 25°C, SL = 2.4 μm. (A) Ionic strength μ = 200 mM; (B) μ = 50 mM. (C) The difference pattern obtained from B subtracted by A, showing the intensity increase of the myosin layer lines. The patterns A and B were averaged from three sets of data, each from a single bundle. The exposure time for each pattern was 2 min.
Fig. 7 shows the profiles of the intensities of MLL1 along a slice parallel to the meridian from the patterns in Fig. 6, A and B. The horizontal profiles of the MLL1s and the differences are shown in Fig. 8. With lowering of the ionic strength from 200 mM to 50 mM, the intensities of MLLs increase significantly; in particular, IMLL1 increased by ∼50%. The increase is more prominent than that found in the presence of PEG. However, when the muscle is stretched to out-of-overlap sarcomere length, there is a smaller but significant increase in the intensity (∼25% increase in total intensity). Although the origin of ordering of the filaments at nonoverlap sarcomere lengths is not clear, any ionic effect should be less at full overlap because the Debye shielding length is ∼10–15 Å. As the filaments get further apart, the ionic effect should decrease. Even if one takes into account the increases at nonoverlap, the evidence indicates that, as more binding occurs in the A·M·ADP·Pi state, the MLLs increase in intensity. MLLs at low ionic strength also exhibit lattice samplings and can be deconvoluted from the unsampled populations (see below).
FIGURE 7.
Details of integrated intensities along a slice parallel to the meridian, which covers ∼95% of the first maximum of the first myosin layer line from the patterns shown in Fig. 6. The inset shows the same profiles obtained from bundles at nonoverlap, SL = 4.2 μm. Solid line, μ = 200 mM; dotted line, μ = 50 mM.
FIGURE 8.
Details of intensity profiles along the first myosin layer lines from the patterns in Fig. 6. The inset shows the same type of profiles obtained from bundles at nonoverlap with SL = 4.2 μm. Solid line, μ = 200 mM; dotted line, μ = 50 mM; gray line, based on the difference pattern of Fig. 6 C. Sampling effects can be seen on the peaks (see section on sampling for detailed analysis).
As ionic strength is lowered from 200 mM to 50 mM (Fig. 6, A to B), the equatorial intensity ratio I11/I10 increases from 0.12 to 0.31, and the lattice spacing decreases from 404 Å to 371 Å, consistent with increased cross-bridge binding. The statistical data are shown in Table 2.
Fig. 9 shows the meridional reflections of the patterns under high and low ionic strengths. With lowering of the ionic strength, the integrated intensity of 385 Å reflection from the thin filaments increased, suggesting that the regularity of the troponin distribution on the thin filament is improved by cross-bridge binding. The myosin-related reflections on the meridian increased significantly under low ionic strength, but those reflections also increased in the nonoverlap fibers.
FIGURE 9.
Profiles of intensities along the meridian from the patterns in Fig. 6, showing increases in intensities of the myosin-related reflections MM2 and MM3 and the 385 Å meridional reflection from troponin in the thin filaments (T385). The inset shows the same type of profiles from bundles at SL = 4.2 μm. Dark line, μ = 200 mM; dotted line, μ = 50 mM. In the inset, the intensity of T385 reflection shows little change with ionic strength.
Fig. 10 shows profiles across ALL6 from the patterns in Fig. 6, A and B. On lowering of ionic strength, the integrated intensity of ALL6 increased by ∼40%, but no increase was observed in fibers stretched to nonoverlap. Therefore, the increase of IALL6 was very likely contributed by the A·M·ADP·Pi cross-bridges.
FIGURE 10.
Profiles of intensity in a vertical slice of the sixth actin layer line from the patterns in Fig. 6. The inset shows the same type of profiles of the patterns obtained from bundles at the nonoverlap SL of 4.2 μm. Solid line, μ = 200 mM; dotted line, μ = 50 mM. The baselines were adjusted to the same background level.
Effect of PEG on steady-state ATP hydrolysis and actomyosin binding in the presence of ATP
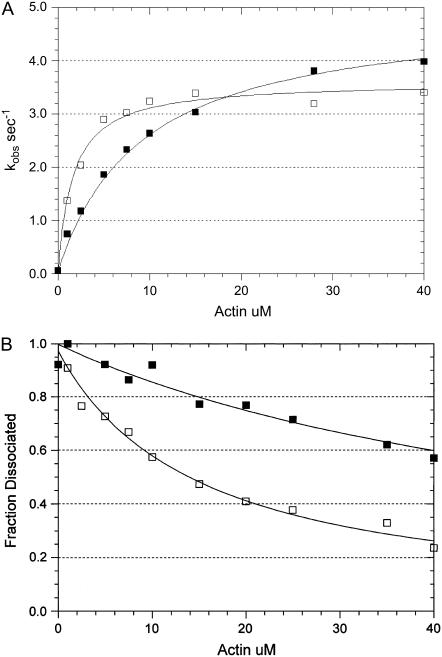
Addition of 5% w/v 1 kDa PEG decreases the maximum rate of actin-activated ATP hydrolysis from 5 s−1 to 3.5 s−1 and decreases the Kapp of actin binding from 9.2 to 1.6 μM (Fig. 11 A). A more direct measurement of binding using active centrifuge binding experiments shows that PEG decreases the dissociation constant, Kbind, from 60 to 15 μM (Fig. 11 B). It is expected that the actin concentration required to activate the rate of ATP hydrolysis to 50% of the maximum rate is less than that required to saturate actin with myosin because the steady-state rate at saturating actin is limited by the attached hydrolysis step (A·M·ATP → A·M·ADP·Pi) (21). However, the similar effects of PEG decreasing Kbind (fourfold) and Kapp (five- to sixfold) while decreasing the maximum rate of steady-state ATP hydrolysis only 30% suggest that the primary effect of PEG is on the binding of S1-ATP and S1-ADP-Pi to actin and not on product dissociation steps. We have also measured the effect of PEG on the kinetics of myosin-S1 and myosin-S1-ADP binding to actin and have found that PEG increases the second-order rate constant of binding ∼4-fold but does not appreciably affect the rates of myosin-S1 or myosin-S1-ADP dissociation from actin (data not shown).
FIGURE 11.
Effect of PEG on actin-activated ATP hydrolysis and the steady-state binding of myosin to actin in the presence of ATP. (A) The actin dependence of the rate of steady-state ATP hydrolysis. Experimental conditions: 0.1 μM rabbit skeletal myosin-S1A1, 5 mM MOPS, 2 mM MgCl2, 20 mM KAc, pH 7, 20°C, 1 mM ATP, the indicated actin concentration, and either zero (solid squares) or 5 percent (w/v) 1000 Da PEG (open squares). The data sets were fit to a hyperbolic equation: V = Vmax/(1 + Kapp/[actin]) where Vmax = 4.9 s−1 and Kapp = 9.2 μM in the absence of PEG and Vmax = 3.6 s−1 and Kapp = 1.6 μM in the presence of PEG. (B) The actin dependence of the fraction of myosin-S1A1 remaining in the supernatant after centrifugation in the presence of the indicated concentration of actin. The data sets were fit to a hyperbolic equation: f = 1 − (1/(1 + Kactin/[actin])) where f is the fraction dissociated and Kactin = 60 μM in the absence of PEG (solid squares) and Kactin = 15 μM in the presence of PEG (open squares). The experimental conditions are the same as those in A except that the concentration of myosin-S1A1 was 0.01 μM.
Sampling on the myosin layer lines: a mixture of simple and superlattices
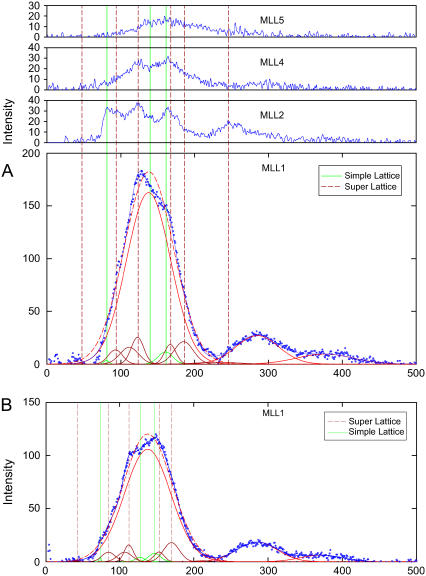
The profiles of myosin layer lines shown in Fig. 3 and Fig. 8 indicate the existence of lattice sampling. Under relaxing conditions at μ = 200 mM and 50 mM and under PEG conditions, samplings are visible on the myosin layer lines. The contributions from samplings were estimated by finding the best fit for the layer lines, with the assumption of one unsampled peak (its amplitude and position freely adjusted) superimposed with sampled peaks (their amplitudes freely adjusted). For the best fit, both simple and superlattice were required to be included. The superlattice is the same as found in the frog sartorius (19). The experimental data and fitted curves are shown in Fig. 12. In Table 5, for the region between 0.00169 Å−1 to 0.00847 Å−1 of the reciprocal space, the positions of the predicted simple lattice peaks are in triangles; the predicted superlattice peaks are in squares. When the lattice spacings were changed (e.g., with 5% PEG), the best fits required only that the positions of the indexed peaks be adjusted according to the changed lattice, whereas the amplitudes of all the peaks were fitted freely. The sampling is weak: the amplitudes of the sampling peaks are small compared to the unsampled filament peaks (∼25 vs. 150). The total contributions of sampled intensities relative are 13% for μ = 50 mM and 12% for μ = 200 mM on MLL1; 22% and 36%, respectively, on the second myosin layer line. This result suggests that the three-dimensional order (simple hexagonal lattice and superlattice) occurs in only a small portion of the filaments, and most of the filaments (∼90%) are randomly oriented around the filament axis.
FIGURE 12.
Effects of sampling. (A) Myosin layer lines obtained under relaxing condition at μ = 50 mM. Experimental data are shown in blue dots, which were fitted by one unsampled first myosin layer line (red solid line) plus sampled peaks (dark red and green solid lines). Gaussian functions were used for the fit (see Methods for details). The result of the best fit is shown as the blue solid line. The red dashed line peak is the best fit if lattice samplings are ignored. The peaks are shown at the positions indexed on a mixture of a simple lattice and a superlattice. The three green vertical lines indicate the simple lattice index positions [10], [11], and [20]. The dark dashed red vertical lines indicate the superlattice index positions [10], [20], [21], [31], [40], and [42]. In addition to sampling on the first myosin layer line, samplings on the second and fourth layer lines are clearly indicated. (B) Under relaxing conditions at μ = 200 mM. The first myosin layer line also exhibits the same sampling effect as that in A. The indexed positions of the sampled peaks were adjusted according to changes in the lattice spacing, but the amplitudes were fitted freely. The relative amplitudes of the sampled peaks to unsampled peaks remain approximately the same in A and B. The total sampled intensities on the first myosin layer line were 13% in a versus 12% in b; on the second layer line, 22% in A versus 36% in B. Note that in A and B, the unsampled peak positions of the first myosin layer lines (red solid lines) remained virtually the same, whereas the intensities changed substantially.
TABLE 5.
Samplings on the myosin layer lines originated from simple lattice and superlattice
| Simple | [10] | [11] | [20] | [21] | [30] | ||||||||
|---|---|---|---|---|---|---|---|---|---|---|---|---|---|
| Super | [10] | [11] | [20] | [21] | [30] | [22] | [31] | [40] | [32] | [41] | [50] | [33] | [42] |
| Relax 50 | |||||||||||||
| Channel | 46.69 | 80.50 | 92.87 | 122.69 | 139.06 | 160.49 | 167.02 | 185.24 | 201.82 | 212.15 | 231.43 | 240.49 | 244.89 |
| L1 | □ | ▴ | ▪ | ▪ | ▵ | ▴ | ▪ | ▪ | □ | ▵ | ▪ | ▵ | □ |
| L2 | ▪ | ▴ | ▪ | ▪ | ▴ | ▴ | ▪ | ▪ | ▪ | ▴ | □ | ▴ | ▪ |
| L3 | ▪ | ▪ | ▪ | ▪ | □ | ||||||||
| L4 | ▪ | ▴ | ▪ | ▪ | ▴ | ▴ | ▪ | ▪ | ▪ | ▴ | ▪ | ▴ | □ |
| L5 | □ | ▴ | ▪ | ▪ | ▴ | ▴ | ▪ | ▪ | ▪ | ▴ | ▪ | ▴ | □ |
| L6 | ▪ | ▪ | □ | □ | □ | ||||||||
| Relax 200 | |||||||||||||
| Channel | 42.84 | 73.84 | 85.19 | 112.53 | 127.53 | 147.18 | 153.17 | 169.87 | 185.07 | 194.54 | 212.22 | 220.52 | 224.56 |
| L1 | □ | ▴ | ▪ | ▪ | ▴ | ▴ | ▪ | ▪ | □ | ▵ | ▪ | ▵ | □ |
| L2 | □ | ▴ | ▪ | ▪ | ▴ | ▴ | ▪ | ▪ | ▪ | ▴ | ▪ | ▵ | ▪ |
| L3 | ▪ | ▪ | ▪ | □ | □ | ||||||||
| L4 | □ | ▴ | ▪ | ▪ | ▴ | ▴ | ▪ | ▪ | ▪ | ▴ | ▪ | ▵ | ▪ |
| L5 | □ | ▴ | ▪ | ▪ | ▴ | ▴ | ▪ | ▪ | ▪ | ▴ | ▪ | ▵ | ▪ |
| L6 | □ | ▪ | □ | □ | □ | ||||||||
Triangles, positions indexed according to the simple hexagonal lattice. Squares, positions indexed according to the superlattice using the selection rules  (where N is integral) (20). The solid triangles and squares mark the peaks that are identified in the experimental data; the open triangle and squares mark the unobserved peaks.
If the MLL1s are stripped off the sampled peaks, and the remaining unsampled peaks are compared between different conditions, the intensity level is increased significantly under PEG and low ionic conditions compared to the 200 mM condition, but the position of the peak of the MLL is not shifted. This indicates that the change in the radial distribution by the new attachment is small and is obscured by the predominant contribution from the detached population.
It can be argued that the inclusion of samplings in the curve-fitting procedure might distort the actual center of mass of the main peak. However, even if one does not separate out sampling, the best fits for the MLL1s under the three conditions indicated no significant shift in the peak position. Therefore, it is concluded that partial samplings affect the apparent shape of MLL1 but not the centroid of the main peak. Hence, lowering ionic strength or adding PEG increases the intensity but does not change the shape of MLL1.
DISCUSSION
Binding of myosin to actin is potentiated by PEG (15). In particular, the addition of PEG enhanced the weakly bound states in the cross-bridge cycle (15). In the study presented here, an increase in actin-myosin binding by PEG is indicated by the increase in the equatorial intensity ratio I11/I10 (Table 2) and by the four- to fivefold increase in myosin binding to actin during steady-state ATP hydrolysis shown in Fig. 11. Chinn et al. (15) suggested that although PEG increased the fraction of weakly bound cross-bridges, it shifted the equilibrium from A·M·ADP·Pi and M·ADP·Pi states to the A·M·ATP and M·ATP states. We believe that at 25°C the increase is mostly in the A·M·ADP·Pi state because the equilibrium (Scheme 1) is in favor of the hydrolyzed state (22,23). The experiments by Chinn et al. (15) were carried out at 10°C, where the equilibrium constant between hydrolyzed and unhydrolyzed states is ∼1. Moreover, the substantial increase in the myosin and actin layer line intensities (Fig. 1) cannot be explained in terms of the disordered filament structures previously determined for the A·M·ATP and M·ATP states (5,10). In the study presented here, a shift to the A·M·ATP and M·ATP states is therefore unlikely.
The findings of the PEG experiments are reinforced by the ionic strength experiments. The increase in the weakly bound cross-bridges in muscle with lowering of ionic strength has been well established by mechanical, biochemical, and x-ray diffraction studies (2,23,24). As a result of lowering the ionic strength from 200 mM to 50 mM under relaxing conditions at 25°C, the binding is estimated to increase approximately from 5% to 20% (25). Hence, both approaches increased the binding, mostly in the A·M·ADP·Pi state.
The increase in layer line intensities could not be caused by the addition of PEG per se because little change in the intensities was observed on the addition of PEG without the actomyosin interaction (Fig. 2 A, inset). It might be argued that PEG may have increased some nonspecific association between actin and myosin. However, any change in layer line intensities indicates a change in mass distribution with specific periodicity, inconsistent with the idea of nonspecific association. In addition, the decrease in the Kapp for actin activation of steady-state ATP hydrolysis, shown in Fig. 11 A, indicates that the increased M·ADP·Pi bound to actin is kinetically competent to activate product dissociation. The difference in intensities could not be caused by a change in scattering volume because x-ray beam covered the entire width of the muscle despite changes in the lattice dimension (see Methods). Furthermore, experiments using dextran T500, which compressed the hexagonal lattice to comparable spacings, did not bring about any increase in layer line intensities (data not shown). In the case of lowering ionic strength, the magnitude of increase in intensities at full-overlap sarcomere length significantly exceeded that observed at overstretched sarcomere length. Therefore, it is reasonable to conclude that the increases in the intensity of the MLLs and ALL6 were mostly brought about by an increase in the fraction of cross-bridges bound to actin in the A·M·ADP·Pi state.
The equilibrium between disordered and ordered states of the thick filament, as measured by the intensities of the MLLs (7), directly correlates with the equilibrium between myosin heads in the switch-II open and closed conformations (26). We concluded that helical order of the thick filament could be used as a signature for the switch-II closed conformation in the myosin filament. Similar results obtained from the tarantula thick filaments (8) provided further support for our conclusion. In our study, the enhanced helical order suggests that the switch-II probably remains closed in the attached A·M·ADP·Pi complex, although a direct relation between helical order and disposition of the switch-II in the attached heads has yet to be established. It should be noted that the data do not present a clear indication as to the position of the binding site on actin. Previous modeling based on the profiles of the MLLs indicated that the binding site for the weakly bound A·M·ATP state was by the N-terminus of actin (9), whereas the putative rigor binding site is further inward, closer to the center of the actin filament (27,28). In our study, because the increase in attachment is small, any shift in the intensity distribution would be obscured by the strong layer lines originated from the detached M·ADP·Pi population. Therefore, the binding site for the A·M·ADP·Pi complex is not determined.
The significantly enhanced intensities in both MLLs and ALLs by a small increase in attachment clearly indicate that the configuration (mode) of attachment in the A·M·ADP·Pi state is unique among the intermediate states of the cross-bridge ATP hydrolysis cycle (Scheme 1). If the increase were in the A·M·ATP state, the increase in either group of layer lines would be undetectable. On the other hand, if the attachment configuration were similar to those in the strong binding states, a marked increase in the ALLs would be accompanied by a significant decrease in the MLLs. Rather, our results suggest that the formation of the A·M·ADP·Pi state appears to be highly effective in improving the alignment of both types of the filaments, laterally and longitudinally. In the lateral direction, the long-range order in the hexagonal lattice is improved as revealed by the improved sharpness (narrower widths) of the reflections (12,24); longitudinally, increases in the intensities of the MLLs without discernable change in the shape of the profiles suggest that only the axial alignment of the myosin heads is improved by the attachment. The significant enhancement in the third meridional reflection (MM3) further suggests that the alignment within the sarcomere is also improved. Preliminary modeling can account for the experimental results, if one assumes that the thermal fluctuations (disorder of the first kind (29)) are reduced and the long-range order (disorder of the second kind (29)) in the distribution of the myosin heads is increased (J. Gu et al., unpublished data). Similarly, the axial alignment of the actin monomers in the thin filament also appears to be improved by the attachment.
The mechanism of the improved axial alignment by attachment is not clear. One might speculate that the characteristic binding may reflect the structural nature of the myosin head with the switch-II closed. In our previous study (7), it was observed that the enthalpy changes involved in the disorder ⇄ order transition in the thick filament and the switch-II open ⇄ closed transition of a single head were almost identical. Consequently, it was suggested that the observed changes in the motion of the myosin head that led to disorder/order in the filament might be caused by changes in the structural flexibility within the head alone. Myosin heads in the switch-II closed conformation are probably less flexible than those in the open conformation. This is consistent with the finding that the S1 crystal structure with switch-II closed is a compact, stable, and possibly a rather rigid structure (30), in contrast to the “internally decoupled” structures associated with the switch-II open form (31). A filament consisting of myosin heads with loosely coupled domains could provide a simple and straightforward explanation for the disordered distribution of the heads and their attachment to actin in a wide range of orientations. A reduced flexibility in the myosin head may reduce spatial fluctuations in the thick filament sufficiently that the ordered helical packing of the heads is revealed. The stiff myosin heads briefly attaching to actin may function as transient “struts” that effectively stabilize both filaments. A stable and stiff myosin is also consistent with the concept of a “primed” pre-power-stroke state. Therefore, a less flexible motor domain structure of M·ADP·Pi could explain the ordered array, the low affinity for actin, and a more rigid attachment to actin that stabilizes the filaments, improving the alignment. Further experiments are clearly needed to explore the mechanical properties of individual myosin molecules.
Acknowledgments
The authors thank Gary Melvin of the Office of Science and Technology, National Institute of Arthritis and Musculoskeletal and Skin Diseases, National Institutes of Health (NIH) for technical support. This research was in part supported by the Intramural Research Program of the National Institute of Arthritis and Musculoskeletal and Skin Diseases of the National Institutes of Health and by grants to H.W. from the NIH (EB00207) and the Carman Foundation.
References
- 1.Eisenberg, E., and T. L. Hill. 1978. A cross-bridge model of muscle contraction. Prog. Biophys. Mol. Biol. 33:55–82. [DOI] [PubMed] [Google Scholar]
- 2.Chalovich, J. M. 1992. Actin mediated regulation of muscle contraction. Pharmacol.Ther. 55:95–148. [DOI] [PubMed] [Google Scholar]
- 3.White, H. D., B. Belknap, and M. R. Webb. 1997. Kinetics of nucleoside triphosphate cleavage and phosphate release steps by associated rabbit skeletal actomyosin, measured using a novel fluorescent probe for phosphate. Biochemistry. 36:11828–11836. [DOI] [PubMed] [Google Scholar]
- 4.Yu, L. C., S. Xu, J. Gu, H. D. White, and G. Offer. 2003. Helical order in myosin filaments and evidence for one ligand inducing multiple myosin conformations. Adv. Exp. Med. Biol. 538:305–316. [DOI] [PubMed] [Google Scholar]
- 5.Xu, S., J. Gu, T. Rhodes, B. Belknap, G. Rosenbaum, G. Offer, H. White, and L. C. Yu. 1999. The M.ADP.P(i) state is required for helical order in the thick filaments of skeletal muscle. Biophys. J. 77:2665–2676. [DOI] [PMC free article] [PubMed] [Google Scholar]
- 6.Geeves, M. A., and K. C. Holmes. 1999. Structural mechanism of muscle contraction. Annu. Rev. Biochem. 68:687–728. [DOI] [PubMed] [Google Scholar]
- 7.Xu, S., G. Offer, J. Gu, H. D. White, and L. C. Yu. 2003. Temperature and ligand dependence of conformation and helical order in myosin filaments. Biochemistry. 42:390–401. [DOI] [PubMed] [Google Scholar]
- 8.Zoghbi, M. E., J. L. Woodhead, R. Craig, and R. Padron. 2004. Helical order in tarantula thick filaments requires the “closed” conformation of the myosin head. J. Mol. Biol. 342:1223–1236. [DOI] [PubMed] [Google Scholar]
- 9.Gu, J., S. Xu, and L. C. Yu. 2002. A model of cross-bridge attachment to actin in the A*M*ATP state based on x-ray diffraction from permeabilized rabbit psoas muscle. Biophys. J. 82:2123–2133. [DOI] [PMC free article] [PubMed] [Google Scholar]
- 10.Xu, S., J. Gu, G. Melvin, and L. C. Yu. 2002. Structural characterization of weakly attached cross-bridges in the A*M*ATP state in permeabilized rabbit psoas muscle. Biophys. J. 82:2111–2122. [DOI] [PMC free article] [PubMed] [Google Scholar]
- 11.Xu, S., J. Gu, G. Melvin, and L. C. Yu. 2001. Evidence that the conformation of the actomyosin complex with bound ADP.Pi (the A.M.ADP.Pi state) differs from that in the A.M.ATP state. Biophys. J. 80:267a. (Abstr.) [Google Scholar]
- 12.Xu, S, S. Malinchik, D Gilroy, T. Kraft, B. Brenner, and L. C. Yu. 1997. X-ray diffraction studies of cross-bridges weakly bound to actin in relaxed skinned fibers of rabbit psoas muscle. Biophys. J. 73:2292–2303. [DOI] [PMC free article] [PubMed] [Google Scholar]
- 13.White, H., B. Belknap, M. Walker, and J. Trinick. 1995. Polyethylene glycol produces large increases in the amount of myosin-S1 bound to actin during steady state ATP hydrolysis. Biophys. J. 68:17a. (Abstr.) [DOI] [PMC free article] [PubMed] [Google Scholar]
- 14.Highsmith, S., K. Duignan, R. Cooke, and J. Cohen. 1996. Osmotic pressure probe of actin-myosin hydration changes during ATP hydrolysis. Biophys. J. 70:2830–2837. [DOI] [PMC free article] [PubMed] [Google Scholar]
- 15.Chinn, M. K., K. H. Myburgh, T. Pham, K. Franks-Skiba, and R. Cooke. 2000. The effect of polyethylene glycol on the mechanics and ATPase activity of active muscle fibers. Biophys. J. 78:927–939. [DOI] [PMC free article] [PubMed] [Google Scholar]
- 16.White, H. D., and I. Rayment. 1993. Kinetic characterization of reductively methylated myosin subfragment 1. Biochemistry. 32:9859–9865. [DOI] [PubMed] [Google Scholar]
- 17.White, H. D. 1982. Special instrumentation and techniques for kinetics studies of contractile systems. Methods Enzymol. 85, Pt. B:698–708. [DOI] [PubMed] [Google Scholar]
- 18.Heeley, D. H., B. Belknap, and H. D. White. 2002. Mechanism of regulation of phosphate dissociation from actomyosin-ADP-Pi by thin filament proteins. Proc. Natl. Acad. Sci. USA. 99:16731–16736. [DOI] [PMC free article] [PubMed] [Google Scholar]
- 19.Huxley, H. E., and W. Brown. 1967. The low-angle X-ray diagram of vertebrate striated muscle and its behaviour during contraction and rigor. J. Mol. Biol. 30:383–434. [DOI] [PubMed] [Google Scholar]
- 20.Squire, J. M. 1981. The Structural Basis of Muscular Contraction. Plenum Press, New York.
- 21.White, H. D., B. Belknap, and M. R. Webb. 1997. Kinetics of nucleoside triphosphate cleavage and phosphate release steps by associated rabbit skeletal actomyosin, measured using a novel fluorescent probe for phosphate. Biochemistry. 36:11828–11836. [DOI] [PubMed] [Google Scholar]
- 22.Taylor, E. W. 1977. Transient phase of adenosine triphosphate hydrolysis by myosin, heavy meromyosin, and subfragment 1. Biochemistry. 16:732–739. [DOI] [PubMed] [Google Scholar]
- 23.White, H. D., and E. W. Taylor. 1976. Energetics and mechanism of actomyosin adenosine triphosphatase. Biochemistry. 15:5818–5826. [DOI] [PubMed] [Google Scholar]
- 24.Brenner, B., L. C. Yu, and R. J. Podolsky. 1984. X-ray diffraction evidence for cross-bridge formation in relaxed muscle fibers at various ionic strengths. Biophys. J. 46:299–306. [DOI] [PMC free article] [PubMed] [Google Scholar]
- 25.Kraft, T., J. M. Chalovich, L. C. Yu, and B. Brenner. 1995. Parallel inhibition of active force and relaxed fiber stiffness by caldesmon fragments at physiological ionic strength and temperature conditions: additional evidence that weak cross-bridge binding to actin is an essential intermediate for force generation. Biophys. J. 68:2404–2418. [DOI] [PMC free article] [PubMed] [Google Scholar]
- 26.Holmes, K. C., and M. A. Geeves. 2000. The structural basis of muscle contraction. Philos. Trans. R. Soc. Lond. B Biol. Sci. 355:419–431. [DOI] [PMC free article] [PubMed] [Google Scholar]
- 27.Rayment, I., H. M. Holden, M. Whittaker, C. B. Yohn, M. Lorenz, K. C. Holmes, and R. A. Milligan. 1993. Structure of the actin-myosin complex and its implications for muscle contraction. Science. 261:58–65. [DOI] [PubMed] [Google Scholar]
- 28.Holmes, K. C., R. R. Schroder, H. L. Sweeney, and A. Houdusse. 2004. The structure of the rigor complex and its implications for the power stroke. Phil. Trans. R. Soc. Lond. B Biol. Sci. 359:1819–1828. [DOI] [PMC free article] [PubMed] [Google Scholar]
- 29.Vainshtein, B. K. 1966. Diffraction of X-rays by Chain Molecules. Elsevier Publishing, Amsterdam.
- 30.Houdusse, A., A. G. Szent-Gyorgyi, and C. Cohen. 2000. Three conformational states of scallop myosin S1. Proc. Natl. Acad. Sci. USA. 97:11238–11243. [DOI] [PMC free article] [PubMed] [Google Scholar]
- 31.Himmel, D. M., S. Gourinath, L. Reshetnikova, Y. Shen, A. G. Szent-Gyorgyi, and C. Cohen. 2002. Crystallographic findings on the internally uncoupled and near-rigor states of myosin: further insights into the mechanics of the motor. Proc. Natl. Acad. Sci. USA. 99:12645–12650. [DOI] [PMC free article] [PubMed] [Google Scholar]


