Abstract
The obliquebanded leafroller, Choristoneura rosaceana (Harris) (Lepidoptera: Tortricidae), is a serious pest of apples and other tree crops throughout North America. A review of temperature dependent development and models show that five different lower thresholds for development are published and used as the basis of heat-driven phenology models. We present a small lab data set of C. rosaceana development at four different temperatures and combine this with literature-based data into a single meta-analysis. Our analysis shows that the data from the different studies can be lumped together and the combined analysis suggests the lower and upper thresholds for development from egg to adult are approximately 10° C and 30° C, respectively.
Keywords: phenology models, apple, pest management
Introduction
The obliquebanded leafroller, Choristoneura rosaceana (Harris) is a serious pest of apple and other tree fruits throughout North America. In Washington and some of the western fruit growing areas, C. rosaceana has become one of the main secondary pests that are hindering the implementation of mating disruption-based pest management programs for apples (Brunner, 1999). In both Washington and Oregon, C. rosaceana is also a pest of sweet cherry, Prunus avium (L.) (Beers et al., 1993; Omeg, 2001). IPM programs in both crops could be greatly improved if phenology models that predict the occurrence of key points in C. rosaceana life history were accurate and reliable.
At least five different phenology models have been published for C. rosaceana (Reissig, 1978; Gangavalli et al., 1985; Onstad et al., 1985; AliNiazee; Brunner et al., 1997; Evenden et al., 1999). In addition, there are two versions of the PETE model (Welch et al., 1978) detailed in Onstad (1985) and Gangavalli (1985). Unfortunately, each model suggests different lower and upper thresholds for development. For example, 6.0, 6.1, 7.2, 10, or 10.8° C are all suggested as the lower threshold of development. Some of this confusion may be the result of variability in the lower threshold depending on which stage is examined (egg, different larval instars, and pupal stage) (Gangavalli, 1985; Onstad et al., 1985).
The different thresholds used by the models are problematic when trying to decide which model is correct and for comparing the relative accuracy of the different models. There is good agreement that the rate of larval development is slower on older foliage (Onstad et al., 1986; Omeg, 2001), but variation in diet has been reported as being important (Onstad et al., 1986; Brunner and Doerr, unpublished) or unimportant (Omeg, 2001). Regardless, the non-feeding pupal and egg stage development times should be relatively unaffected by differences in diet, particularly when artificial diets are used, even between studies. However, even these stages are considered to have different thresholds for development depending on the study: 10.0 (Gangavalli, 1985) and 6.67° C (Onstad et al., 1985).
Validation of a model using an incorrect set of thresholds can be performed and appear to be adequate at predicting development. However, for a model to be accurate across different geographical areas and different temperature profiles that occur over different years and locations, using “true” threshold values leads to fewer errors that are associated with either accumulating too many or too few heat units. In temperate areas, the effect of errors in heat unit accumulations early in the season are likely to be minimal when predicting events later in the season. This is because the degree-day accumulation per day is so low early in the season that even 5–6 days in June or July may accumulate more heat units than the entire months of January, February and part of March (Jones, unpublished). However, later in the season the higher temperatures require better estimation of the lower threshold for reasonable accuracy.
Our goal is to provide a small laboratory study of development of C. rosaceana, and a meta-analysis of literature studies to see determine if enough variability exists to require corrections based on diet effects, experimental techniques or regional differences.
Materials and Methods
Laboratory studies
One-liter cardboard containers were lined with wax paper to serve as oviposition chambers. A few moths of both sexes were added to the oviposition chambers and the chambers were checked daily for newly laid egg masses. Egg masses were removed from the wax paper, dipped in a 5% bleach solution for mold control, and placed in individual Petri dishes (Falcon 1006, 50X9 mm, with snap-on lids) for hatching. Ten egg masses were collected for each of three temperatures, 15, 20 and 25° C. The Petri dishes were placed in constant temperature growth chambers (VWR Scientific low temperature incubator #2005, http://www.vwrsp.com) with a photoperiod of 16L:8D. The egg masses were checked daily and the number of days until hatch recorded. After hatch, five neonate larvae were placed into a petri dish with a small amount of pinto bean diet (Shorey et al., 1965) and the dish returned to the constant temperature chamber. Twenty Petri dishes were set up for each temperature tested. The larvae were checked daily and the dates at which each molt occurred were recorded. After molting to the third instar, larvae were transferred individually to 29.6 ml diet cups and reared until adult emergence.
We also reared some individuals at 10° C. For this study, we allowed the eggs to hatch at 20° C, then moved the neonates to individual diet cups to complete development at 10° C and a photoperiod of 16L:8D, as above.
Literature data
A survey of the literature was performed to examine the developmental data that was used as the basis for the five phenology models mentioned previously. We used the original data when possible (Sanderson and Jackson, 1909; Gangavalli, 1985) or digitized it from graphs in original publications (Reissig, 1978; Omeg, 2001). We collected data for the egg, larval, pupal, and egg through pupal stages separately. All temperature studies were on artificial diet, except the studies of Sanderson and Jackson (1909).
Analysis
The analysis used all the data available for the four different stages (egg, larval, pupal and egg through pupal stages). Data from our lab study and the literature sources were all pooled into a single analysis for each stage. Data were plotted as the developmental rate (i.e., time−1) versus temperature and examined visually for any departures from linearity at the extremes of the temperature ranges tested. Because the rate of development varies when temperatures become suboptimal for development, data were only fit to linear regression within the linear portion of the curve (Arnold, 1959). This adjustment was necessary for only 2 data points (one high and one low) for the egg stage analysis and two high points for the larval analysis; all data were used in the analysis of the other stages.
The slope and the intercept of the linear regressions were used to estimate the lower threshold for development and the degree-days required for development. The lower threshold for development is estimated as
 |
and the total degree-days required for development as slope−1 (Arnold, 1959).
While non-linear developmental models could have been fit to the data, the improvement in fit over the linear model is not typically sufficient to justify the added complexity (Dent, 1997), unless most of the development occurs at temperatures near the thermal maximum (Young et al., 1998). Linear degree-days were used because they are sufficiently accurate for phenology models that are used for IPM decision-making, and are relatively easy to implement in the field (Welch et al., 1978; Beers et al., 1993; Dent, 1997; Young et al., 1998).
Results
Laboratory developmental time
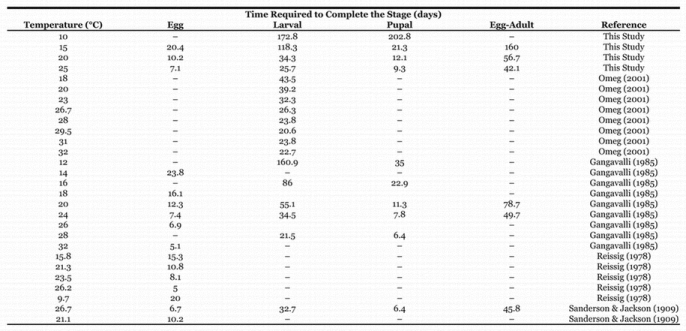
In our small laboratory study, developmental time of the egg, larval and pupal stages at 15, 20, and 25° C decreased in a fairly linear and predictable manner as temperature increased (Table 1). Survival was greatest at 20° C (70%), and dropped to 54% in both the 15 and 25° C treatments. Although some individuals completed development from first instar to adult at 10° C in our studies, mortality was extremely high (about 85.6%) and development was extremely slow (202.8 d), suggesting that 10° C is very close to the lower threshold for development for the post-embryonic stages.
Table 1.
Time required to complete a stage in days from current and literature studies
Combined analysis
The analysis of all four stages showed few differences occurred between studies in the different developmental rates (Table 1, Figs. 1–4). In all cases, a single regression to explain the developmental rate was sufficient and indicated that the lower threshold for development is approximately 9.5–10°C for all the stages (Table 2).
Figure 1.
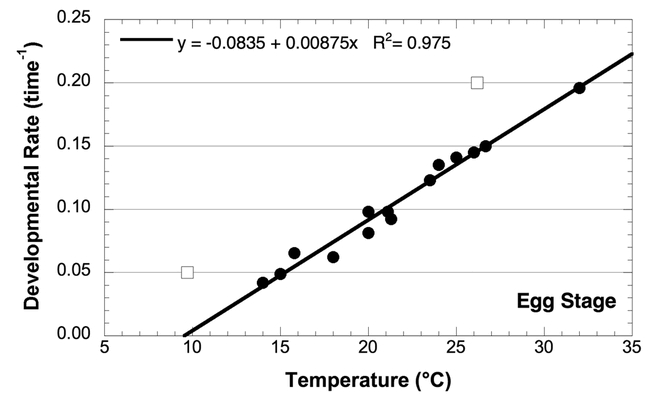
Effect of temperature on the developmental rate of Choristoneura rosaceana eggs; data from the sources listed in Table 1. Open squares are data points not used in calculation of developmental rate and thresholds.
Table 2.
Regression equations of developmental rates and thresholds generated using data from Table 1.

The analysis of egg developmental rate was particularly important, because this was the basis for the 6° C threshold used in several models (Onstad et al., 1985; Brunner et al., 1997). The data for Onstad et al. (1985) was the same data developed by Reissig (1978). If all the data in Reissig (1978) are used to fit the regression of temperature and developmental rate, the threshold indeed comes out to about 5.5° C as reported by Onstad et al. (1985). However, examination of the data set shows that the lowest and highest temperatures from Reissig (1978) (Fig. 1, open squares) are clearly outside the tight linear relationship of all the other studies. The reasons for this variation are unclear, but in both cases the developmental rate is higher than expected and would suggest that that the temperatures in those studies were in fact about 5° C high. If those two data points are omitted, the data from the other four studies all showed reasonable variation associated with the different experimental set-ups occurring between laboratories.
Larval development is likely the most variable stage because it is potentially influenced by diet (Onstad et al., 1985). However, most of the studies that report development of larvae used an artificial diet (Table 2). With diet held relatively constant, the lower threshold for development is probably accurate. However, the actual duration in degree-days in the field is likely a result of being reared on different host plants; therefore, the duration on a given host may be higher or lower. The regression for larval development was performed on all the data where the temperature was less than 30° C (because of mortality concerns, see below). In this case, the lower threshold for development was 10.1° C.
As with egg development, pupal development is relatively independent of diet effects, particularly because most of these studies used similar artificial diets. All of the data were used in the analysis and the lower threshold for development was 9.6° C (Table 2), virtually identical to that for the egg stage.
The threshold for the overall development rate (egg-adult) is intermediate between the larval threshold and the egg and pupal thresholds, but biased more towards the larval threshold. This bias is probably because the developmental time of the larval stage is greater than the combined developmental times of the egg and pupal stages. Overall, the threshold for development was 9.9° C.
Discussion
It is clear from our analysis that the lower threshold for development is about 10° C (Table 2), but the use of an upper threshold is still required. Gangavalli (1985) examined the effects of three different fluctuating temperatures (Table 3) which suggest that 32° C significantly increased developmental time compared to constant temperatures that resulted in the same degree-day accumulations per day. In addition, he felt the increased mortality that occurred at 32° C strongly supported that temperature as an upper threshold and he recommended a vertical cutoff (Baskerville et al., 1969) be used for calculation of degree-days. Omeg (2001) provided developmental rates of C. rosaceana larvae and found that 31 and 32° C reduced the developmental rates compared to 29.5° C and further found 100% mortality of larvae reared at 34 or 36° C. We concur with the conclusions of Gangavalli and AliNiazee (1985) and Omeg (2001) that 30° C is a reasonable upper threshold for modeling studies.
Table 3.
Comparison of time required to complete development at fluctuating and constant temperatures. All data from Gangavalli (1985).

The question of using linear or non-linear models of insect development has been the source of considerable discussion. While non-linear models have theoretically an advantage (Stinner et al., 1974; Logan et al., 1976; Wagner et al., 1984a; Wagner et al., 1984b; Briere et al., 1999), they also add considerable complexity and are difficult to implement for extension-type phenology models (Welch et al., 1978; Beers et al., 1993; Dent, 1997; Young et al., 1998). In addition, as pointed out by Young and Young (1998), the improvements are minor unless most of the development occurs near the thermal maxima. Finally, it is important to note that for maximum accuracy these models require a number of developmental rates near the thermal extremes. These are difficult to obtain because of the long time required for low temperature studies and the high mortality that occurs at both extremes. At the upper threshold, the narrow temperature range between development and death is often only 4–5° C, which makes more than one temperature study difficult to perform because of variability associated with temperature cabinet performance and calibration. For the above reasons, we chose to focus on the linear model.
While our studies reported herein did not provide model development or validation, the validity of the 10° C lower threshold can be at least partially confirmed by our other studies. Evenden and Judd (1999) developed a phenology model for C. rosaceana adult trap catch based on the Weibull distribution using a rather small data set. Using the same methods and distribution, but with 18 orchard-years worth of data, we found the estimated parameters were virtually identical to those reported by Evenden and Judd (1999) (Jones, unpublished). Such similarity would be unlikely given the differences in temperature profiles if the lower threshold were not acceptably close.
Figure 2.
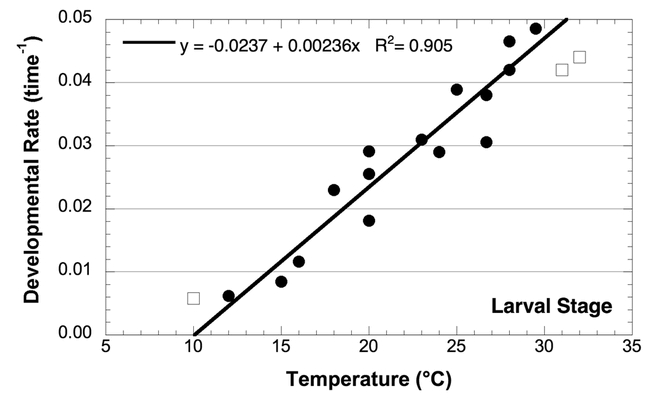
Effect of temperature on the developmental rate of Choristoneura rosaceana larvae; data from the sources listed in Table 1. Open squares are data points not used in calculation of developmental rate and thresholds.
Figure 3.
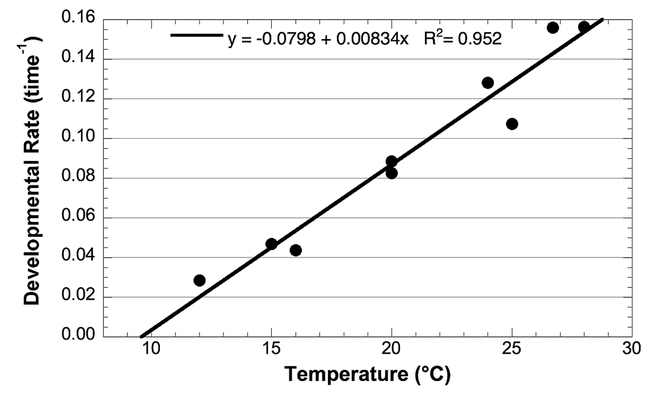
Effect of temperature on the developmental rate of Choristoneura rosaceana pupae; data from the sources listed in Table 1. Open squares are data points not used in calculation of developmental rate and thresholds.
Figure 4.
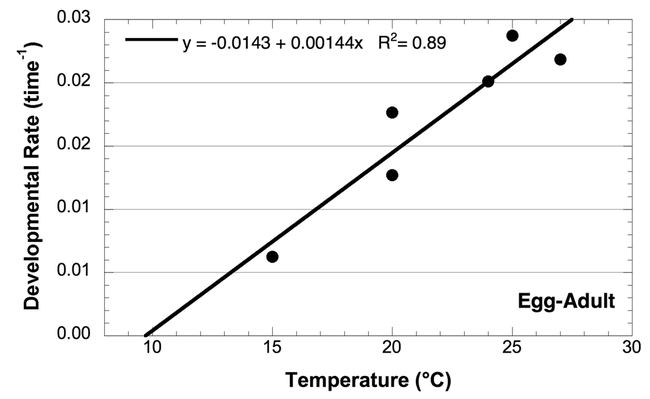
Effect of temperature on the developmental rate of Choristoneura rosaceana from egg to adult; data from the sources listed in Table 1.
Acknowledgments
Funding was supplied in part by grants from the Washington Tree Fruit Research Commission.
References
- AliNiazee MT. Seasonal history, adult flight activity, and damage of the obliquebanded leafroller, Choristoneura rosaceana (Lepidoptera: Tortricidae), in filbert orchards. Canadian Entomologist. 1986;118:353–361. [Google Scholar]
- Arnold CY. The determination and significance of the base temperature in a linear heat unit system. American Society of Horticultural Science. 1959;4:431–445. [Google Scholar]
- Baskerville GL, Emin P. Rapid estimation of heat accumulation from maximum and minimum temperatures. Ecology. 1969;50:514–516. [Google Scholar]
- Beers EH, Brunner JF, Willett MJ, and Warner GM. 1993 Orchard Pest Management: A resource book for the Pacific Northwest. Good Fruit Grower, Yakima, WA. [Google Scholar]
- Briere J, Pracros P, Le Roux A, Pierre JS. A novel rate model of temperature-dependent development for arthropods. Environmental Entomology. 1999;28:22–29. [Google Scholar]
- Brunner JF. New pests: a challenge for areawide programs. Proceedings of the Washington State Horticultural Association. 1999;95:154–158. [Google Scholar]
- Brunner JF, Lampson L. 1997 Leafroller models: predicting development and timing controls, Newsletter of pheromone-based orchard pest management. Vol. 2. Wash. State Univ., Wenatchee, WA. [Google Scholar]
- Dent DR. 1997 Quantifying insect populations: Estimates and parameters. pp. 57–110.In D. R. Dent and M. P. Walton [eds.], Methods in ecological and agricultural entomology. CAB International, New York. 387. pp. [Google Scholar]
- Evenden ML, Judd GJR. Adult eclosion, flight and oviposition of Choristoneura rosaceana (Lepidoptera: Tortricidae), in British Columbia apple orchards. Journal of Entomological Society of British Columbia. 1999;96:77–88. [Google Scholar]
- Gangavalli RR. 1985 Influence of temperature and photoperiod on the developmental biology of the obliquebanded leafroller, Choristoneura rosaceana. Ph.D. dissertation, Oregon State University, Corvalis, OR. [Google Scholar]
- Gangavalli RR, AliNiazee MT. Temperature requirements for development of the obliquebanded leafroller, Choristoneura rosaceana (Lepidoptera: Tortricidae) Environmental Entomology. 1985;14:17–19. [Google Scholar]
- Logan JA, Wollkind DJ, Hoyt SC, Tanigoshi LK. An analytic model for description of temperature dependent rate phenomena in arthropods. Environmental Entomology. 1976;5:1133–40. [Google Scholar]
- Omeg MK. 2001 Biology and management of the obliquebanded leafroller, Choristoneura rosaceana (Harris) (Lepidoptera: Tortricidae) in sweet cherry. MS dissertation, Oregon State University, Corvallis, OR. [Google Scholar]
- Onstad DW. 1985 Options for design and control in the management of a tortricid leafroller (Choristoneura rosaceana) in apple orchards. Ph.D. dissertation, Cornell University, Ithaca, NY. [Google Scholar]
- Onstad DW, Reissig WH, Shoemaker CA. Phenology and management of the obliquebanded leafroller (Lepidoptera: Tortricidae) in apple orchards. Journal of Economic Entomology. 1985;78:1455–1462. [Google Scholar]
- Onstad DW, Reissig WH, Shoemaker CA. Influence of apple cultivar, tree phenology, and leaf quality on the development and mortality of Choristoneura rosaceana. Canadian Entomologist. 1986;118:123–132. [Google Scholar]
- Reissig WH. Biology and control of the obliquebanded leafroller on apples. Journal of Economic Entomology. 1978;71:804–809. [Google Scholar]
- Sanderson ED, Jackson AD. The obliquebanded leafroller, Archips rosaceana Harris. Journal of Economic Entomology. 1909;2:391–403. [Google Scholar]
- Shorey HH, Hale RL. Mass-rearing of the larvae of nine noctuid species on a simple artificial medium. Journal of Economic Entomology. 1965;58:522–524. [Google Scholar]
- Stinner RE, Gutierrez AP, Butler GD. An algorithm for temperature-dependent growth rate simulation. Canadian Entomologist. 1974;106:519–524. [Google Scholar]
- Wagner TL, Wu H-I, Sharpe PJH, Coulson RN. Modeling distributions of insect development time: a literature review and application of the Weibull function. Annals of the Entomological Society of America. 1984a;77:475–487. [Google Scholar]
- Wagner TL, Wu H-I, Sharpe PJH, Schoolfield RM, Coulson RN. Modeling insect development rates: a literature review and application of a biophysical model. Annals of the Entomological Society of America. 1984b;77:208–225. [Google Scholar]
- Welch SM, Croft BA, Brunner JF, Michels MF. PETE: an extension phenology modeling system for management of multi-species pest complex. Environmental Entomology. 1978;7:487–494. [Google Scholar]
- Young LJ, Young JH. 1998 Statistical ecology: a population perspective. Kluwer Academic Publishers, Boston, MA. 565. pp. [Google Scholar]


