Abstract
We studied the dynamics of microbial communities attached to model aggregates (4-mm-diameter agar spheres) and the component processes of colonization, detachment, growth, and grazing mortality. Agar spheres incubated in raw seawater were rapidly colonized by bacteria, followed by flagellates and ciliates. Colonization can be described as a diffusion process, and encounter volume rates were estimated at about 0.01 and 0.1 cm3 h−1 for bacteria and flagellates, respectively. After initial colonization, the abundances of flagellates and ciliates remained approximately constant at 103 to 104 and ∼102 cells sphere−1, respectively, whereas bacterial populations increased at a declining rate to >107 cells sphere−1. Attached microorganisms initially detached at high specific rates of ∼10−2 min−1, but the bacteria gradually became irreversibly attached to the spheres. Bacterial growth (0 to 2 day−1) was density dependent and declined hyperbolically when cell density exceeded a threshold. Bacterivorous flagellates grazed on the sphere surface at an average saturated rate of 15 bacteria flagellate−1 h−1. At low bacterial densities, the flagellate surface clearance rate was ∼5 × 10⁻⁷ cm2 min−1, but it declined hyperbolically with increasing bacterial density. Using the experimentally estimated process rates and integrating the component processes in a simple model reproduces the main features of the observed microbial population dynamics. Differences between observed and predicted population dynamics suggest, however, that other factors, e.g., antagonistic interactions between bacteria, are of importance in shaping marine snow microbial communities.
Marine snow aggregates form and degrade in the water column. The degradation is to a large extent due to the activity of attached microbes (46), which typically occur on aggregates in abundances that are orders of magnitude higher than in the ambient water (4, 35, 45). These microbes form diverse and complex biofilm communities on the aggregate surface (6, 28, 50), and their species compositions are different from those of the microbial communities in the ambient water (15, 18, 20, 40). The extensive literature on biofilms tends to focus on only bacteria (17, 19, 30), but the biofilms of marine particles include microscopic bacterivores that potentially play important roles in population regulation. While the population dynamics of free-living microbes in the water column is relatively well studied (see, e.g., reference 22), processes governing the dynamics of microbial populations attached to marine snow particles are still poorly known. The population dynamics of marine snow microbes are complex and dependent on several factors, i.e., the rates of attachment, detachment, growth, and mortality of the microbial populations, which in turn depend on the motility of the organisms, the fluid dynamic environment of the aggregate, and complex intra- and interspecific interactions among the organisms (grazing, competition, and intra- and interspecific communication, e.g., through quorum sensing).
We have earlier developed and tested simple encounter models to characterize the initial colonization (minutes to hours) of model aggregates by monospecific bacterial cultures (36). The present study is an extension of our efforts, with the objectives to (i) describe the short-term (minutes to hours) and long-term (days) development of natural, mixed microbial populations on model aggregates and (ii) examine and quantify some of the key component processes governing the dynamics of the microbial populations, i.e., colonization, detachment, and growth of microbes (bacteria and protists) and grazing by protists (flagellates) on attached bacteria.
MATERIALS AND METHODS
Basic encounter and predator-prey dynamics models.
The encounter and predator-prey dynamics on aggregates can be described by a modified Lotka-Volterra model:
 |
(1) |
 |
(2) |
where B and F are bacterial and flagellate densities on the aggregate (number cm−2); βB′ and βF′ are the encounter rate kernels for bacteria and flagellates normalized to the surface area of the aggregate (centimeters minute−1) (see below); BA and FA are the ambient bacterial and flagellate concentrations (number centimeter−3); μ and δB are the specific bacterial growth and detachment rates (minute−1), respectively; δF is the specific flagellate detachment rate (minute−1); pF is the flagellate grazing coefficient (surface clearance rate) (centimeters2 minute−1); and aF = YF × pF, where YF is the growth yield (number of flagellate cell divisions per ingested bacterium). The model considers temporal changes in abundances of bacteria and flagellates (left sides of the equations) as a function of colonization (first terms on right sides of both equations), growth (second terms), detachment (third terms), and grazing mortality of bacteria (last term in equation 1). The encounter rate kernel between a spherical collector and organisms with a random-walk type of motility pattern, such as many bacteria (12) and flagellates (24), is given by (12)
 |
(3) |
where D is the equivalent diffusion coefficient of the microorganisms in question and r is the radius of the sphere. Hence, the encounter rate kernel normalized to the surface area of the sphere is
 |
(4) |
We designed experiments to measure the changes in microbial populations on model aggregates. By modifying the environmental and/or the attached microbial communities, or by staining specific bacteria, we aim to isolate the different component processes and estimate the various coefficients in the above equations.
Experiments.
The basic experimental approach was to suspend model aggregates (4-mm-diameter agar spheres [36]) on thin glass needles in seawater with natural or manipulated microbial assemblages and then monitor over time the changes in abundances of attached bacteria and protists (mainly heterotrophic flagellates). We used 20-liter incubators with 100 spheres for the incubations for long-term population dynamics (see below) and 2-liter incubators with up to 36 spheres for all other incubations. Long-term incubations with monospecific bacteria were conducted in a biosafety cabinet to minimize contamination. Other experiments were conducted under nonsterile conditions. In some experiments we added antibiotics to prevent bacterial growth (10 ml of Sigma cell culture penicillin-streptomycin solution liter−1). Duplicate to triplicate spheres were sampled at specific time points, and the attached microbes were stained with DAPI (4′,6′-diamidino-2-phenylindole) or Sybr-Gold (Molecular Probes) and quantified by epifluorescence microscopy (at magnifications of ×1,000 for bacteria and ×200 for protists). Free-living microorganisms were quantified by filtering 1-ml aliquots of incubation water onto 0.2-μm-pore-size black Nuclepore filters and counting DAPI- or Sybr-Gold-stained cells under epifluorescence. In long-term incubations, the frequency of dividing cells (FDC) was measured for both attached and free-living bacterial populations (∼100 counts per sample). Fluorescently labeled bacteria (FLB) were prepared by staining 15 ml of a dense culture (∼109 cells ml−1) of strain HP11 (Table 1) with 40 μl of Sybr-Gold solution (10 μl ml−1) for 2 h. The FLB were used to measure the flagellate grazing rate (see below).
TABLE 1.
Bacterial strains used in the experimentsa
| Strain | Identification (by GenBank alignment) (GenBank accession no.) | % Homology to GenBank sequence | Size
|
|
|---|---|---|---|---|
| Width × length (μm × μm) | Vol (μm3) | |||
| HP11 | Microscilla furvescens (M58792) | 90 | 1 × 3.5 | 2.7 |
| HP15 | Marinobacter PCOB-2 (AJ000647) | 98 | 1 × 3.5 | 2.7 |
| HP22 | Uncultured Alpha proteobacterium (AJ18163) | 94 | 0.5 × 2 | 0.4 |
| HP33 | Roseobacter sp. (Rhizobium sp. strain SDW052 [AF345550] and/or Agrobacterium tumefaciens [AF388033]) | 99 | 0.8 × 2 | 1.0 |
| T5 | Marine bacterium PP-154 (AJ296158) | 99 | 0.8 × 2 | 1.0 |
All strains were isolated from marine snow collected in the German Wadden Sea.
(i) Microbial populations.
We used either monospecific strains of bacteria isolated from marine particles (Table 1), natural bacterial assemblages, or natural microbial assemblages (including protists). The bacterial strains were grown on Marine Broth (MB2216; Difco). Natural bacterial assemblages were obtained by filtering raw seawater collected in the North Sea through glass fiber GF/F filters; this water was subsequently stored at 4°C, and the bacteria were concentrated by reverse ultrafiltration immediately before use. Natural microbial assemblages were obtained as raw seawater samples collected off the island of Helgoland in the North Sea. This water was collected the afternoon before use and stored at either 8°C (in situ temperature) or 20°C. These assemblages were used unless otherwise noted.
(ii) Incubations for long-term population dynamics.
Clean agar spheres were incubated for 2.5 to 7 days. Spheres were sampled every 3 to 8 h throughout the experiment. In some experiments samples were collected at a higher frequency (i.e., at 0, 10, 20, 40, 80, and 160 min) to characterize the initial colonization process. The incubation water was changed one to four times per day to keep ambient concentrations approximately constant. Ambient concentrations of bacteria, heterotrophic flagellates, and ciliates were measured immediately before and after each water change. Experiments were conducted with monospecific bacterial cultures (three experiments), a natural bacterial assemblage (one experiment), and natural microbial assemblages (eight experiments [four at the in situ temperature of 8°C and 4 at room temperature]).
(iii) Colonization and detachment.
In long-term experiments the accumulation of microorganisms on the agar spheres is initially dominated by colonization and detachment, whereas growth and mortality can be ignored. For bacteria, for example, equation 1 simplifies to dB/dt = βA′BA − δBB ⇒ Bt = (βA′BA/δB)[1 − exp(−δBt)], and colonization and initial detachment rates can be estimated by nonlinear regression analysis of observed changes in attached bacterial abundances. A slight modification is necessary, however, because colonization cannot be considered in steady state (see reference 36 for details). This approach is here used to describe the colonization and detachment of both bacteria and flagellates. Assuming that the motilities of both bacteria and flagellates can be described as random walks and characterized by diffusion coefficients, estimates of β′ can be translated to estimates of diffusion coefficients (equation 4).
(iv) Growth, grazing, and detachment.
Three types of experiments were conducted. To measure the detachment rate, agar spheres were first incubated with monospecific bacterial suspensions for various lengths of time (60 min to several days) and then moved to sterile seawater, and the decrease in attached bacteria was monitored for 80 to 120 min. In sterile water and in the absence of grazers, equation 1 simplifies to dB/dt = (μ − δB)B ⇒ Bt = B0exp[(μ − δB)t] ≅ B0exp(−δBt), since over a short time μ is negligible. Hence, the exponential decline rate is a measure of the specific detachment rate.
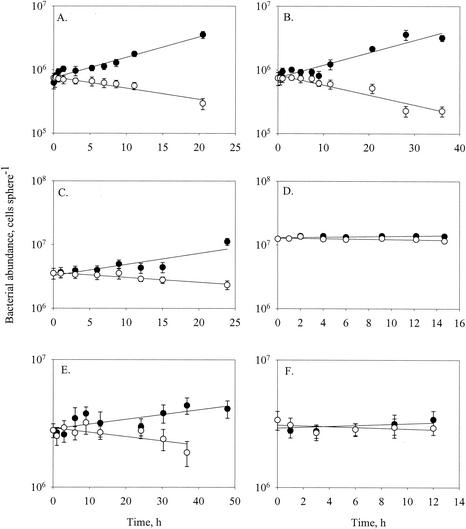
In another type of experiment, we transferred agar spheres preincubated in natural microbial assemblages for 1 to 4 days to parallel containers with either sterile seawater or sterile seawater with antibiotics. We then monitored changes in the abundance of attached microbes for 25 to 35 h, initially at a high sampling frequency (minutes to hours) and later about every 8 h. In the absence of ambient microbial populations, changes in bacterial abundance on the spheres are due to grazing mortality, detachment, and growth {equation 1 simplifies and integrates to Bt = B0exp[(μ −δ − pFF)t]}. Growth is prevented with the antibiotic treatment, and hence the decline in bacterial abundance with the antibiotic treatment provides an estimate of the combined effect of grazing mortality and detachment [exponential decline rate = (−δB − pFF)]. The bacterial growth rate was estimated from the difference between the treatments with and without antibiotics. Bacterial detachment becomes insignificant for spheres that have been colonized by bacteria for a long time, and therefore the decline is assumed to be governed mainly by grazing (−pFF). This maximum estimate of grazing mortality can be combined with the observed abundance of flagellates (F) to achieve an estimate of the flagellate grazing coefficient (pF).
Additional experiments were conducted to measure the grazing mortality of bacteria by using FLB. We first allowed agar spheres to be colonized by FLB for 3 h and then transferred the spheres to parallel containers with either sterile seawater or seawater with natural microbial assemblages and monitored the changes in microbial abundances (of flagellates and stained and unstained bacteria) for ∼25 h. In one experiment we added antibiotics to prevent bacterial growth. Flagellate grazing coefficients were estimated from the abundance of flagellates and the difference in the abundance of stained bacteria between the sterile seawater and natural seawater treatments.
RESULTS
Long-term population dynamics.
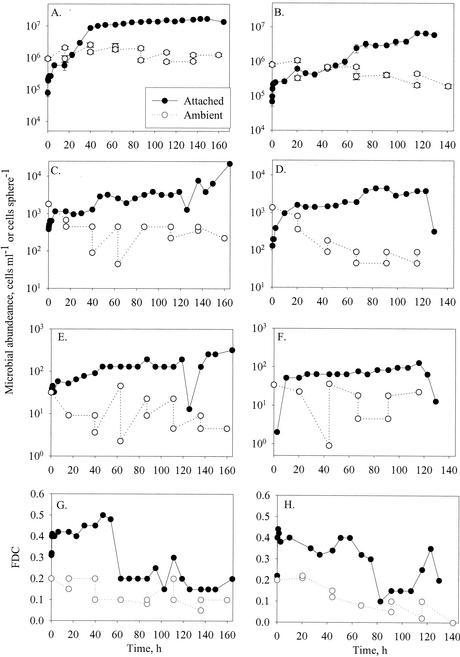
We first describe the overall long-term population dynamics of attached microorganisms, and in subsequent sections we consider the component processes. The development of attached microbial populations was similar in all long-term experiment (Fig. 1 and 2). Bacteria occurred in abundances of up to about 107 cells per sphere. In experiments with natural microbial assemblages, the spheres were colonized by large bacteria of about 1 μm in radius. Flagellates increased to about 103 to 104 cells per sphere, whereas ciliate abundances were at least an order of magnitude lower. In some cases, ciliates were too scarce to enumerate. The colonizing flagellates were small (5 to 10 μm in diameter).
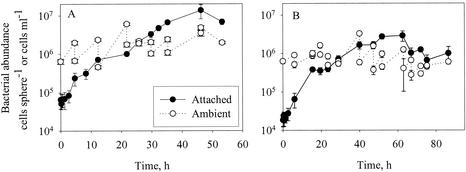
FIG. 1.
Examples of development of abundances of bacteria attached to model aggregates incubated in suspensions of a cultured bacterial strain (HP15) (A) or a natural bacterial assemblage (B) in the absence of grazers. Error bars indicate standard deviations.
FIG. 2.
Changes in abundances of bacteria (A and B), flagellates (C and D), and ciliates (E and F) attached to model aggregates and in free suspension, and FDC (G and H), at 8°C (experiment 3a) (A, C, E, and G) and 20°C (experiment 2a) (B, D, F, and H). Error bars indicate standard deviations.
The accumulation of bacteria on the spheres was broadly characterized by two or three phases: an initial rapid colonization phase during the first 1 to 2 h (evident only in experiments with an initially high sampling frequency; see below) followed by a phase of approximately exponential accumulation (Fig. 2A and B) and high FDC (Fig. 2G and H). When the density reached ∼107 cells sphere−1, the accumulation rate declined (Fig. 2A), accompanied by a decrease in the FDC of the attached bacteria (Fig. 2G and H). Thus, the changes in the net bacteria accumulation rate were partly due to changes in the bacterial growth rate.
Protist populations followed patterns that mostly resembled the bacterial population developments, i.e., an initial rapid colonization phase followed by a period of slower, near-exponential accumulation. Net accumulation rates during the subsequent growth phase were low for both flagellates (0.18 ± 0.30 day−1) and ciliates (0.10 ± 0.20 day−1). In some cases the abundance of attached protists declined towards the end of an experiment.
Colonization and detachment rates.
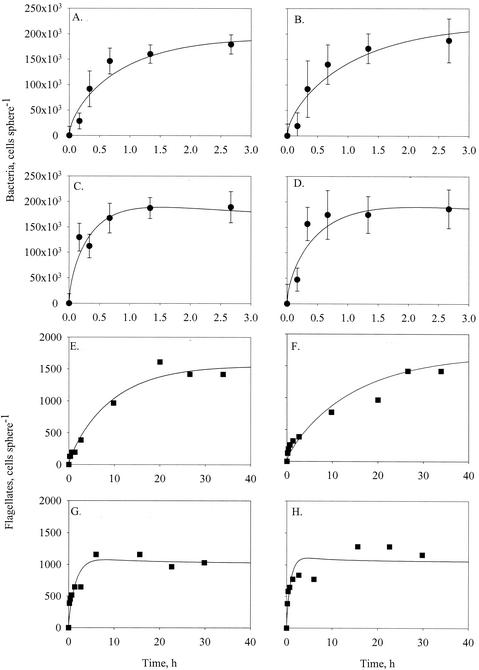
Colonization by monospecific bacterial strains is considered in detail elsewhere (36), and we here focus only on colonization by natural microbial assemblages. Initial colonization was monitored with sufficiently high time resolutions in four experiments, but only the bacterial and flagellate data were of sufficient quality to allow further analysis. The initial colonization patterns were similar for bacteria and flagellates (Fig. 3). Initial accumulation was rapid but then leveled off due to detachment of cells. A temporary quasi-steady state between colonization and detachment was achieved within 1 to 2 h for bacteria and within 8 to 15 h for flagellates. Bacterial diffusion coefficients estimated from colonization rates were similar in all treatments, i.e., 1 × 10⁻³ to 2 × 10⁻³ cm2 min−1; diffusion coefficients for flagellates were of the same order at 8°C but about 5 times higher at 20°C (Table 2). The fractional detachment rates of bacteria varied between 1 × 10⁻² and 3 × 10⁻² min−1; they were of similar magnitude for flagellates at 20°C but about an order of magnitude lower for flagellates at the lower temperature (Table 2).
FIG. 3.
Initial colonization by bacteria (A to D) and flagellates (E to H) of model aggregates suspended in untreated seawater at 8°C (A [experiment 2a], B [experiment 2b], E [experiment 2a], and F [experiment 2b]) and 20°C (C [experiment 3a], D [experiment 3b], G [experiment 3a], and H [experiment 3b]). Lines are model fits to the data. The model considers colonization and detachment of microbes and allows for time-varying (non-steady-state) diffusive transport of microbes towards the aggregate (for details, see reference 36). Model parameters are given in Table 2. Error bars indicate standard deviations.
TABLE 2.
Estimates of bacterial and flagellate diffusion coefficients (D) and specific detachment rates (δ) in four colonization experiments with untreated seawater as the incubation mediuma
| Expt | Temp (°C) | DB (10−3 cm2 min−1) | DF (10−3 cm2 min−1) | δB (10−2 min−1) | δF (10−2 min−1) |
|---|---|---|---|---|---|
| 2a | 8 | 0.84 ± 0.18 | 1.32 ± 0.18 | 1.08 ± 0.42 | 0.14 ± 0.024 |
| 2b | 8 | 0.72 ± 0.18 | 0.90 ± 0.42 | 0.90 ± 0.42 | 0.096 ± 0.036 |
| 3a | 20 | 1.74 ± 0.36 | 3.90 ± 1.08 | 2.76 ± 0.66 | 0.84 ± 0.24 |
| 3b | 20 | 1.08 ± 0.30 | 7.92 ± 3.24 | 1.92 ± 0.72 | 0.50 ± 0.66 |
For the bacteria, the detachment rates only apply to the initial colonization process. All results are means and standard deviations.
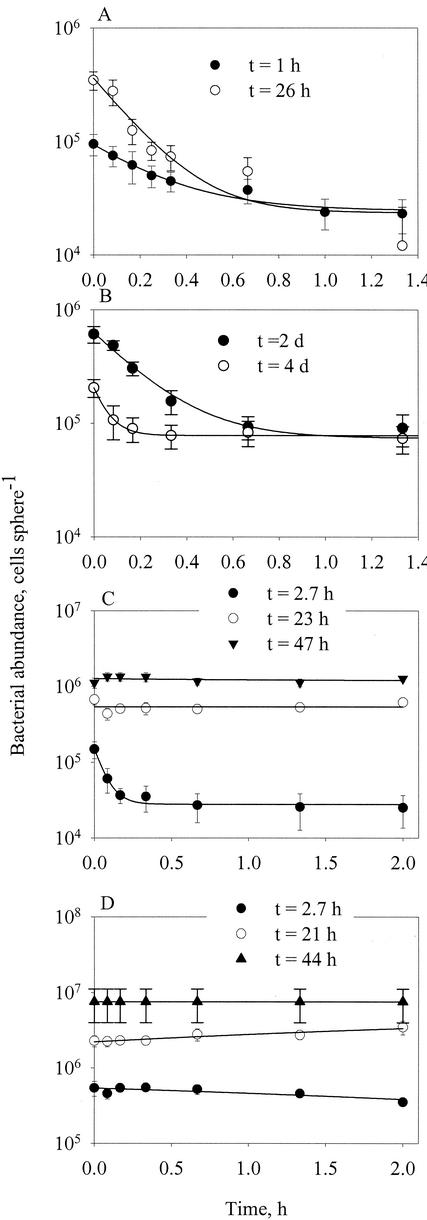
The flagellates did not physically attach to the spheres, and their detachment rates were therefore assumed to be constant throughout the experiments. In contrast, the bacteria may gradually become embedded in mucus, and the fraction of attached cells that detach may decline with time. This can be demonstrated with bacterial cultures: while some strains (HP11 and T5) appeared to detach at almost constant rates (Fig. 4A and B), other strains (e.g., HP22, HP33, and all natural assemblages) remained permanently attached after less than 1 day, and only recently colonized cells detached (Fig. 4C and D). Hence, we modified the equation fitted to the observations to Bt = Bi + Br,0exp(−δBt), where Bi and Br,0 are irreversibly and reversibly attached cells, respectively.
FIG. 4.
Detachment of bacteria from precolonized model aggregates following transfer of the aggregates to sterile seawater at time zero. The aggregates had been precolonized by various bacterial strains for different lengths of time as shown. The lines describe fits to Bt = Bi + Br,0exp(−δBt), where Bi and Br,0 are irreversibly and reversibly attached cells, respectively, Bt is the number of attached cells at time t, and δB is the bacterial detachment rate. Error bars indicate standard deviations. (A to D) Data for strains HP11, T5, HP22, and HP33, respectively.
Bacterial growth rate.
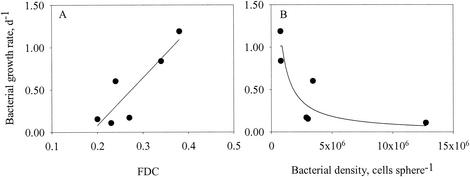
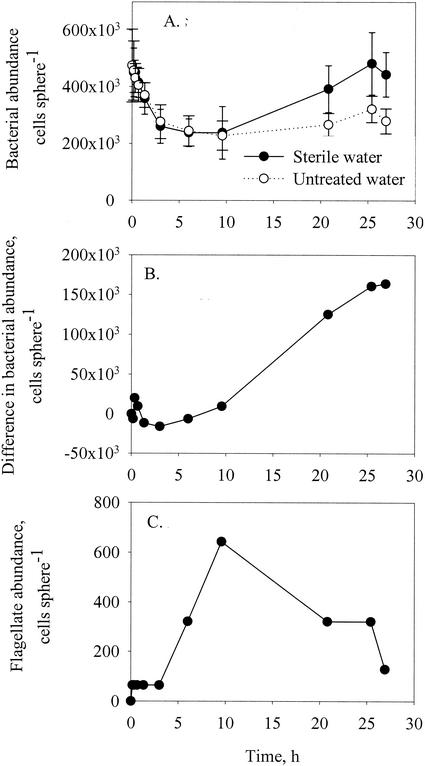
Bacterial growth rates were estimated as the difference between bacterial development on precolonized spheres incubated in sterile seawater with and without antibiotics. In all six experiments, bacteria decreased nearly exponentially on spheres incubated in antibiotic-treated water and increased nearly exponentially on spheres incubated in sterile water (Fig. 5). The differences in the slopes are estimates of bacterial specific growth rates corrected for detachment and grazing. Growth rates varied between 0.1 and 1.2 day−1 among the experiments, were linearly correlated with the FDC (Fig. 6A), and declined hyperbolically with the density of attached bacteria (Fig. 6B).
FIG. 5.
Changes in bacterial abundances on precolonized model aggregates in sterile seawater. The aggregates were transferred from long-term incubations to sterile seawater (closed symbols) or sterile seawater plus antibiotics (open symbols) at time zero. The lines are fitted exponential regressions. Error bars indicate standard deviations. (A to F) Data from experiments 4, 6, 11, 9, 15, and 18, respectively.
FIG. 6.
Growth rates of attached bacteria as a function of FDC (A) and bacterial density (B). Data are from the experiments described in Fig. 5. The fitted lines are μ = 5.63 × FDC − 1.05, where μ is the bacterial growth rate (day−1) (A) and a fit to equations 5 and 6 (B).
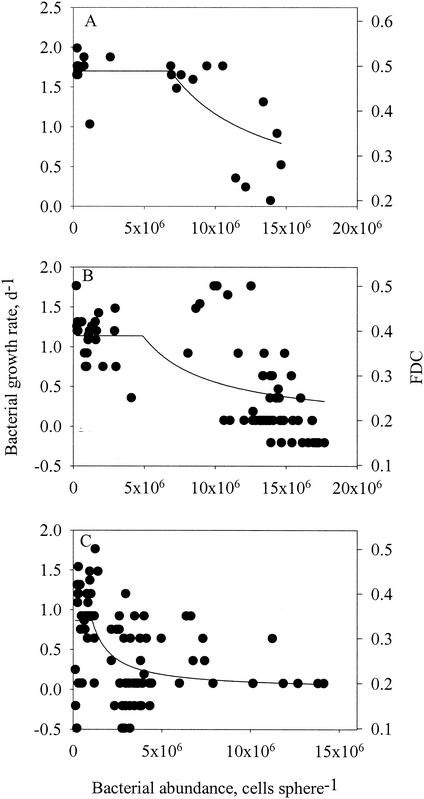
Density-dependent growth of the bacteria was also evident from the relationship between FDC and bacterial density on the spheres in the long-term experiments: at above a threshold density (B*), the FDC declined with increasing cell density (Fig. 7). Growth rates were estimated from the calibrated FDC (Fig. 6A) and fitted to the following model (see Discussion):
 |
(5) |
 |
(6) |
FIG. 7.
FDC and growth rates of attached bacteria (estimated from FDC [see Fig. 6]) as a function of bacterial density on model aggregates for bacterial cultures at 25°C (A) and natural bacterial assemblages at 20°C (B) and 8°C (C). Lines are model fits (equations 5 and 6) to the data.
Flagellate grazing on bacteria.
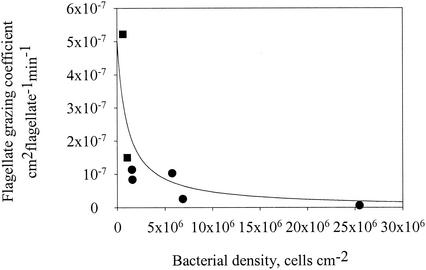
The exponential decay rate for bacteria on the precolonized and antibiotic-treated spheres in Fig. 5 provides an (upper) estimate of bacterial mortality due to grazing. Normalizing this estimated mortality rate by the observed density of flagellates (number centimeter−2) yields a flagellate grazing coefficient (centimeter2 flagellate−1 min−1). The estimated grazing coefficients varied between 10−8 and 10−7 cm2 flagellate−1 min−1 (Fig. 8). Flagellate grazing coefficients were independently estimated as the difference in attached FLB abundances between sterile and natural seawater treatments (Fig. 9A and B) divided by the number of “flagellate-minutes” (integral of the curve in Fig. 9C). The FLB approach yielded somewhat higher grazing coefficients (1.5 × 10⁻⁷ to 5 × 10⁻⁷ cm2 flagellate−1 min−1).
FIG. 8.
Flagellate grazing coefficients as a function of bacterial density on the model aggregates. Circles, grazing coefficient derived from rate of decline of bacteria attached to spheres transferred to sterile seawater with antibiotics added (data from Fig. 5); squares, grazing coefficient derived from differences between the abundance of FLB on spheres incubated in sterile seawater and that in untreated seawater (see Fig. 9). The line shows a fit of equation 7 to the data: pF = 5 × 10⁻⁷/(1 + 10−6B) cm2 flagellate−1 min−1.
FIG. 9.
(A) Changes in abundances of Sybr-Green-stained bacteria attached to model aggregates suspended in sterile seawater or untreated seawater. Agar spheres were precolonized by stained bacteria (strain HP11) for 3 h and then transferred to the incubation medium at time zero. (B) Cumulative number of grazed stained bacteria obtained as the difference in numbers of stained bacteria on spheres in sterile and untreated seawater. (C) Changes in abundance of attached flagellates on spheres in untreated seawater. Error bars indicate standard deviations.
The large variation in the estimated flagellate grazing coefficient was explained by variation in bacterial density: the grazing coefficient declined with increasing bacterial density as the flagellates became saturated (Fig. 8). As a result, the ingestion rate (grazing coefficient × bacterial density) was almost constant (15 ± 4 flagellate−1 h−1). We fitted an expression derived from Holling's disk equation to the grazing coefficient-bacterial density relation:
 |
(7) |
where a is the instantaneous rate of prey discovery (i.e., grazing coefficient at very low prey density) and b the handling time. Estimates are a = 5.0 × 10⁻⁷ cm2 min−1 and b = 1.93 min.
DISCUSSION
Marine snow aggregates harbor high densities of bacteria, whose activities modify and degrade the marine snow (4, 8, 9, 43). The buildup of bacterial biomass on marine snow also provides a food source for bacterivores (7, 14), and dissolved organic matter liberated from snow particles due to the activity of attached bacteria may become important substrates even for free-living bacteria (37). Thus, marine snow aggregates are not only vehicles for sinking fluxes but also unique microcosms in the water column, within which material and energy flows are regulated by complex biological and physical processes (9, 45). The interplay of physical, chemical, and biological factors greatly complicates in situ studies of microbial dynamics on marine snow aggregates. We used model aggregates to examine the component processes of attachment, detachment, growth, and grazing mortality in a controlled laboratory setting to achieve quantitative and mechanistic insights into the processes governing microbial dynamics on marine aggregates. Below we discuss the component processes as they apply to our model aggregates and extrapolate the results to natural marine snow aggregates.
Colonization.
The observed bacterial colonization for natural bacterial assemblages agrees well with previous observations for cultivated (36) and wild (23) bacteria, and the estimated bacterial diffusion coefficients are similar (DB ∼ 103 cm2 min−1. These estimates assume that all bacteria in suspension are motile and will attach to encountered surfaces. In reality, only a fraction of the free bacteria are motile, and hence our estimates of DB are conservative. Recent observations suggest, however, that a dominant fraction of pelagic bacteria are in fact motile (23, 27).
The flagellates that colonized our agar spheres were small, 5- to 10-μm-diameter heterotrophic flagellates that are apparently adapted to moving and feeding on surfaces (e.g., Bodonid flagellates), as has been reported by other investigators (16, 40). To our knowledge ours is the first study that considers flagellate colonization of suspended particles with a high (minutes to hours) time resolution. The estimated diffusion coefficients for flagellates are again conservative because only a subset of the naturally occurring flagellates are adapted to feeding on surfaces (14), but they are consistent with diffusivities of surface-colonizing flagellates for which motility analyses are available, e.g., Cafeteria roenbergensis (DF estimated to be 2 × 10⁻³ cm2 min−1 [24]).
While colonization rates are independent of the convoluted surface and larger attachment area of natural compared to model aggregates, sinking aggregates may be colonized up to 20 times faster than the stationary spheres considered here because advection facilitates the transport of microbes towards the aggregate (36, 38). In addition, dissolved organic substances released from natural aggregates may further enhance the colonization rate of chemosensing bacteria by a factor of 2 to 5 (37).
Detachment.
Both bacteria and flagellates might detach after initial attachment. Initial detachment rates for naturally occurring bacteria are similar to those estimated for cultivated strains (11, 36). The high detachment rates of newly attached bacteria suggest that there is a rapid exchange between attached and free-living bacteria, as also reported by other investigators (25). The flagellates detached at rates that are similar to (20°C) or lower than (8°C) the initial detachment rates for bacteria. However, unlike the bacteria, the flagellates remained freely motile on the surface and thus retained the possibility of leaving the aggregate. This again suggests an intense exchange between attached and free-living flagellates.
Growth of attached bacteria.
Earlier studies show that the growth rates of attached bacteria are similar to (2, 41) or higher than (25, 26) those of free-living bacteria. In our experiments, the consistently higher FDC of attached bacteria (0.1 to 0.5) relative to that of the free-living bacteria (0.05 to 0.2) (Fig. 2) would suggest that attached cells grew at a higher rates. There is, however, a caveat to such an interpretation: attached cells may appear to be in division for a long time because the separation of daughter cells is slowed by their limited motility, whereas free-living cells can separate immediately upon cell division. This also explains why our observed FDC for attached cells exceeds all previously reported FDCs for bacteria, whereas that for free-living cells conforms to earlier observations (13, 29). The highest growth rates of attached bacteria in our experiments computed from calibrated FDC observations were about 2 day−1 (Fig. 7), which is similar to the growth rate of free-living bacteria (average 2.3 day−1). Thus, at low densities, attached bacteria apparently had growth rates similar to those of the free-living bacteria.
Our direct measurements of bacterial growth rate are conservative, however, since a certain fraction of daughter cells may detach upon cell division and are not included in our growth estimates. Batty et al. (11) found that 75 to 97% of the progeny of attached cells emigrate, and Jacobsen and Azam (33) found a similarly high detachment of daughter cells from bacteria attached to copepod fecal pellets. Thus, our estimated growth rates must be considered net rates.
The observed density dependence of bacterial growth may be due to competition for limiting resources, such as oxygen. The diffusive supply of oxygen to a stationary sphere implies a maximum aerobic cell production rate of 1.65 × 10⁴ cells min−1 if a growth efficiency of 0.5 is assumed (25a). Therefore, the maximum abundance of bacteria growing at a maximum rate of 1.4 × 10⁻³ min−1 is 1.2 × 10⁷ cells sphere−1, which is similar to that observed (Fig. 7). These considerations are consistent with the model fitted to the growth observations (equations 5 and 6).
For a sinking aggregate, the oxygen supply is increased due to advection, e.g., by a factor of ca. 10 in a 0.4-cm aggregate that sinks at a typical velocity (38). Thus, the threshold density will be an order of magnitude higher, ca. 108 bacteria per aggregate, before the bacteria will experience oxygen limitation. Typical bacterial abundances on 0.4-cm aggregates are about 106 bacteria (35); thus, on natural aggregates the bacteria are less likely to experience oxygen limitation (42) but more likely to experience substrate limitation or growth inhibition due to antagonistic substances produced by neighboring cells (39).
Flagellate grazing on attached bacteria.
We used two methods to estimate flagellate grazing rates on attached bacteria, both of which had limitations because the estimates were derived from relatively small differences in bacterial abundances between treatments with and without grazers. One of the methods provides maximum estimates because it ignores other loss factors (detachment and grazing by ciliates) and may be biased due to the addition of antibiotics that may influence flagellate grazing rates. However, the two methods yield consistent estimates that are comparable with previous estimates of grazing rates on attached bacteria (7, 31, 47). In the only other study of flagellate grazing on marine snow bacteria, Artolozaga et al. (7) found that the unsaturated grazing rates for 5- to 10-μm-diameter flagellates (Bodo, Jakoba, and Rhynchomonas) were 1 to 10 bacteria flagellate−1 h−1 and that the grazing rates increased with bacterial density. Several investigators have estimated the grazing mortality of bacteria attached to sediments. Thus, Hammels et al. (31) found that 5- to 9-μm-diameter flagellates consume 5 to 25 bacteria flagellate−1 h−1, and Starink et al. (47) derived an empirical model that predicts that a 5-μm-diameter flagellate would ingest 24 bacteria h−1. Overall, these estimates are consistent with our estimate of a saturated grazing rate of ca. 15 bacteria flagellate−1 h−1.
Flagellate growth rate and growth yield.
The flagellate grazers had a biovolume that was 27 to 64 times that of the bacteria. Assuming a gross growth efficiency of 0.4 based on biovolume (21, 44, 49), the flagellates would divide once per 70 to 160 bacteria eaten and have a growth yield, YF, of 0.6 × 10⁻² to 1.4 × 10⁻², consistent with observed growth yields for deposit-feeding flagellates (51). Combining the estimated growth yield and the observed average saturated ingestion rate of 15 bacteria flagellate−1 h−1 yields an estimated maximum flagellate growth rate of 0.06 to 0.15 h−1, which is similar to or slightly less than the maximum growth rates for pelagic flagellates (21).
Dynamics of attached microbial communities.
Above we have considered separately each of the component processes that govern the dynamics of attached microbial populations. We now reassemble the pieces by modifying equations 1 and 2 with the insights achieved above. These insights are (i) that bacterial growth and flagellate grazing are dependent on bacterial density on the aggregates and (ii) that bacteria gradually become irreversibly attached. Changing equations 1 and 2 accordingly gives
 |
(8) |
 |
(9) |
 |
(10) |
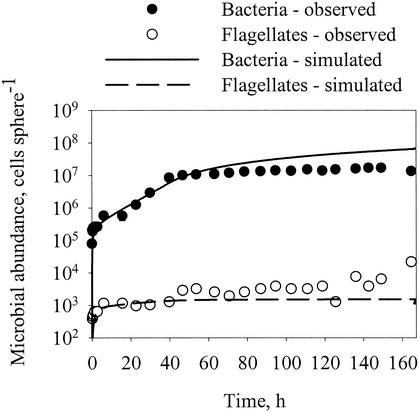
where γ is the specific rate at which reversibly attached bacteria become irreversibly attached. Using equations 8 to 10 and the above estimates of the various coefficients and relations (Table 3), we can now simulate the dynamics of the attached bacteria and flagellate populations (Fig. 10). Since we do not know the rate at which attached bacteria become irreversibly attached, we arbitrarily assume a specific rate of 1/10 of the initial detachment rate (γ = 0.1 × δB). With this assumption, the attached population is entirely dominated by irreversibly attached bacteria after 1 day, which is consistent with observations (Fig. 4). The simulation reproduces the key features of the temporal development of attached bacterial and flagellate populations. For the bacteria, both observations and simulations show an initial rapid colonization followed by a period of near-exponential increase and a final extended period of declining accumulation rate. For the flagellates, the initial rapid colonization is followed by a period of declining accumulation rate. The close correspondence between the observations and the simulation suggests that our model includes the main processes governing microbial population dynamics on the model aggregates.
TABLE 3.
Definition of parameters and input values for the models as they apply to experiment 3aa
| Symbol(s) | Definition | Units | Input value |
|---|---|---|---|
| Br, Bi | Density of reversibly (Br) or irreversibly (Bi) attached bacteria | No. cm−2 | 0 |
| B | Density of all attached bacteria (= Br + Bi) | No. cm−2 | 0 |
| F | Density of attached flagellates | No. cm−2 | 0 |
| BA | Ambient concentration of bacteria | No. cm−3 | 1.5 × 10⁶ |
| FA | Ambient concentration of flagellates | No. cm−3 | 500 |
| βB′, βF′ |  |
cm min−1 | |
| DB | Diffusion coefficient for bacteria | cm2 min−1 | 1.4 × 10⁻³ |
| DF | Diffusion coefficient for flagellates | cm2 min−1 | 5.9 × 10⁻³ |
| r | Aggregate radius | cm | 0.2 |
| μ | μ = μmax for B ≤ B*;  for B > B* for B > B* |
min−1 | |
| μmax | Maximum bacterial growth rate | min | 1.4 × 10⁻³ |
| B* | Threshold bacterial density for density-dependent growth regulation | No. cm−2 | 1.2 × 10⁷ |
| δB | Specific detachment rate of reversibly attached bacteria | min−1 | 2.3 × 10⁻² |
| δF | Specific detachment rate of flagellates | min−1 | 0.7 × 10⁻² |
| γ | Specific rate at which reversibly attached bacteria become irreversibly attached | min−1 | 0.1 × δB |
| pF |  |
cm2 min−1 | |
| aF | pF × Y | cm2 s−1 | |
| Y | Flagellate growth yield | Cell cell−1 | 10−2 |
Simulation results are shown in Fig. 10.
FIG. 10.
Observed and simulated dynamics of bacterial and flagellate population dynamics on model aggregates. The observations are from experiment 3a at 20°C (Fig. 2). Model parameters for simulation are summarized in Table 3.
The population dynamics of attached marine snow microbes differ markedly from the population dynamics of free-living pelagic bacteria and flagellates. The population dynamics of free-living microbes are characterized by coupled predator-prey oscillations, as demonstrated theoretically, experimentally, and in field observations (5, 22, 48). Such predator-prey oscillations are not observed for attached microbial populations (41; this study), and they are not predicted by our model. This lack of oscillations is mainly due to the continuous colonization of the aggregates from the ambient water. The attached microbial communities thus are not isolated entities, but there is a continuous exchange of organisms between the aggregate and the ambient water due to colonization, detachment, and possibly emigration.
Although the simulation reproduces the main features of the population dynamics of the attached microbes, the fit is not perfect (we deliberately did not try to adjust the parameters to obtain a better fit). In particular, while the observed abundance of attached bacteria seems to stabilize after a long incubation time, the simulation predicts a continuous increase. The possible reasons for such discrepancy are that the density-dependent growth regulation is stronger than assumed here or that an increasing fraction of bacterial progeny leaves the aggregate as the density of resident bacteria increases (10). Both of these possibilities are consistent with the data in Fig. 7. Another likely reason is that the probability of attachment of a newly arriving bacterium decreases when the resident population becomes more diverse. Bacteria, particularly those that attach to particles, are known to display antagonistic activities (39), and the presence of one species on the aggregate may significantly reduce the colonization rate of another species (25a). Thus, interactions among bacteria may play a significant role in population control.
Field-collected aggregates that are similar in size to our model aggregates have typical bacterial abundances about 1 order of magnitude lower than what we observed (∼106 cells aggregate−1), while protist abundances are similar (35). The predicted abundance of bacteria is, however, strongly dependent on grazing mortality. With our estimated grazing coefficients, bacterial populations on the aggregates are not controlled by grazers. Increasing the grazing pressure just slightly (for example, by doubling the saturated ingested rate) allows the flagellates to maintain the bacterial population at a steady-state level of about 106 aggregate−1. The grazing pressure on natural aggregates is likely even higher because typical marine snow bacteria are considerably smaller (0.6 to 1.2 μm in diameter [2, 3]) than the bacteria in our experiments (∼2 μm). Thus, grazing is likely to play a significant role in controlling bacterial populations on natural aggregates.
The dynamics of microbial communities on real aggregates may differ from what we have observed on model aggregates due to differences in, e.g., architecture (34), flow environment (38), substrate availability (1) and persistence (43), and aggregation dynamics (32) between model and real aggregates, but the component processes of microbial attachment, detachment, growth, and grazing are identical. Studying these processes simultaneously in natural, complex aggregates is difficult, if not impossible. However, a fruitful approach may be to integrate the mechanistic understanding achieved in this study with existing descriptions of the above-described properties for natural aggregates into coherent models. This will allow a mechanistic understanding of the processes governing the microbial dynamics on complex marine snow aggregates.
Acknowledgments
Thanks are due to Meinhard Simon for providing lab facilities at the Institute of Chemistry and Biology of the Marine Environment of the University of Oldenburg and to Christian Schütt for provision of lab facilities and logistic support at the Biologisches Anstalt Helgoland (The Alfred Wegner Institute of Polar and Marine Research). We thank Uffe H. Thygesen for help with software and model development.
We acknowledge financial support from the Danish Natural Science Council to T.K. and H.P. (grants 9801391 and 21-01-0549), from the Carlsberg Foundation to K.T. (grant 990536/20-950), from the Danish Network for Fisheries and Aquaculture Research to T.K., from the Alexander von Humboldt Foundation to H.P. (grant IV DAN/1072992 STP), and from the Institute of Chemistry and Biology of the Marine Environment of the University of Oldenburg.
REFERENCES
- 1.Alldredge, A. L. 2000. Interstitial dissolved organic carbon (DOC) concentrations within sinking marine aggregates and their potential contribution to carbon flux. Limnol. Oceanogr. 45:1245-1253. [Google Scholar]
- 2.Alldredge, A. L., J. J. Cole, and D. A. Caron. 1986. Production of heterotrophic bacteria inhabiting macroscopic aggregates (marine snow) from surface waters. Limnol. Oceanogr. 31:68-78. [Google Scholar]
- 3.Alldredge, A. L., and C. C. Gotschalk. 1990. The relative contribution of marine snow of different origins to biological processes in coastal waters. Cont. Shelf Res. 10:41-58. [Google Scholar]
- 4.Alldredge, A. L., and M. W. Silver. 1984. Characteristics, dynamics and significance of marine snow. Prog. Oceanogr. 20:41-82. [Google Scholar]
- 5.Andersen, P., and T. Fenchel. 1985. Bacterivory by microheterotrophic flagellates in seawater samples. Limnol. Oceanogr. 30:198-202. [Google Scholar]
- 6.Artolozaga, I., E. Santamaría, A. Lópex, B. Ayo, and J. Iriberri. 1997. Succession of bacterivorous protests on laboratory-made marine snow. J. Plankton Res. 19:1429-1440. [Google Scholar]
- 7.Artolozaga, I., M. Valcárel, B. Ayo, A. Latatu, and J. Iriberri. 2002. Grazing rates of bacterivorous protests inhabiting diverse marine planktonic environments. Limnol. Oceanogr. 47:142-150. [Google Scholar]
- 8.Azam, F. 1998. Microbial control of oceanic carbon flux: the plot thickens. Science 280:694-696. [Google Scholar]
- 9.Azam, F., and R. A. Long. 2001. Oceanography—sea snow microbes. Nature 414:595-596. [DOI] [PubMed] [Google Scholar]
- 10.Azam, F., and D. C. Smith. 1991. Bacterial influence on the variability in the ocean's biochemical state: a mechanistic view, p. 213-235. In S. Demers (ed.), Particle analysis in oceanography. NATO ASI Series, vol. G27. Springer-Verlag, Berlin, Germany.
- 11.Batty, A. M., III, C. C. Eastburn, S. Techkarnjanaruk, A. E. Goodman, and G.-G. Geesey. 2000. Spatial and temporal variations in chitinolytic gene expression and bacterial biomass production during chitin degradation. Appl. Environ. Microbiol. 66:3574-3585. [DOI] [PMC free article] [PubMed] [Google Scholar]
- 12.Berg, H. C. 1993. Random walks in biology. Princeton University Press, Princeton, N.J.
- 13.Campbell, L., and E. J. Carpenter. 1986. Diel patterns of cell division in marine Synechococcus spp (Cyanobacteria): use of the frequency of dividing cells technique to measure growth rate. Mar. Ecol. Prog. Ser. 32:39-148. [Google Scholar]
- 14.Caron, D. A. 1987. Grazing of attached bacteria by heterotrophic microflagellates. Microb. Ecol. 13:203-218. [DOI] [PubMed] [Google Scholar]
- 15.Caron, D. A. 1991. Heterotrophic flagellates associated with sedimenting detritus, p. 77-92. In D. J. Patterson, and J. Larsen (ed.), The biology of free-living heterotrophic flagellates, special vol. 45. Clarendon Press, Oxford, United Kingdom.
- 16.Caron, D. A., P. G. Davis, L. P. Madin, and J. M. Sieburth. 1982. Heterotrophic bacteria and bacterivorous protozoa in oceanic macroaggregates. Science 218:795-797. [DOI] [PubMed] [Google Scholar]
- 17.Chappel, M. A., and V. P. Evangelou. 2002. Surface chemistry and function of microbial biofilms. Adv. Agronom. 76:163-199. [Google Scholar]
- 18.Crump, B. C., E. V. Armbrust, and J. A. Baross. 1999. Phylogenetic analysis of particle-attached and free-living bacterial communities in the Colubia river, its estuary, and the adjacent ocean. Appl. Environ. Microbiol. 65:3192-3204. [DOI] [PMC free article] [PubMed] [Google Scholar]
- 19.Davey, M. E., and G. A. O'Toole. 2000. Microbial biofilms: from ecology to molecular genetics. Microbiol. Mol. Biol. Rev. 64:847-867. [DOI] [PMC free article] [PubMed] [Google Scholar]
- 20.DeLong, E. F., D. G. Franks, and A. L. Alldredge. 1993. Phylogenetic diversity of aggregate-attached and free-living marine bacterial assemblages. Limnol. Oceanogr. 38:924-934. [Google Scholar]
- 21.Fenchel, T. 1982. Ecology of heterotrophic microflagellates. II. Bioenergetics and growth. Mar. Ecol. Prog. Ser. 8:225-231. [Google Scholar]
- 22.Fenchel, T. 1986. The ecology of heterotrophic microflagellates. Adv. Microb. Ecol. 9:57-97. [Google Scholar]
- 23.Fenchel, T. 2001. Eppur si muove: many water column bacteria are motile. Aquat. Microb. Ecol. 24:197-201. [Google Scholar]
- 24.Fenchel, T., and N. Blackburn. 1999. Motile chemosensory behaviour of phagotrophic protists: mechanisms for and efficiency in congregation at food patches. Protist 150:325-336. [DOI] [PubMed] [Google Scholar]
- 25.Friedrich, U., M. Schallenberg., and C. Holliger. 1999. Pelagic bacteria-particle interactions and community-specific growth rates in four lakes along a trophic gradient. Microb. Ecol. 37:49-61. [DOI] [PubMed] [Google Scholar]
- 25a.Grossart, H.-P., T. Kiørboe, K. Tang, and H. Ploug. 2003. Bacterial colonization of particles: growth and interactions. Appl. Environ. Microbial. 69:3500-3509. [DOI] [PMC free article] [PubMed] [Google Scholar]
- 26.Grossart, H.-P., and H. Ploug. 2001. Microbial degradation of organic carbon and nitrogen on diatom aggregates. Limnol. Oceanogr. 46:267-277. [Google Scholar]
- 27.Grossart, H.-P., L. Rieman, and F. Azam. 2001. Bacterial motility in the sea and its ecological implications. Aquat. Microb. Ecol. 25:247-258. [Google Scholar]
- 28.Grossart, H.-P., and M. Simon. 1998. Bacterial colonization and microbial decomposition of limnetic organic aggregates (lake snow). Aquat. Microb. Ecol. 15:127-140. [Google Scholar]
- 29.Hagström, Å., U. Larsson, P. Hörstedt, and S. Normark. 1979. Frequency of dividing cells: a new approach to the determination of bacterial growth rates in aquatic environments. Appl. Environ. Microbiol. 37:805-812. [DOI] [PMC free article] [PubMed] [Google Scholar]
- 30.Hall-Stoodley, L., and P. Stoodley. 2002. Developmental regulation of microbial biofilms. Curr. Opin. Biotechnol. 13:228-233. [DOI] [PubMed] [Google Scholar]
- 31.Hammels, I., K. Muylaert, G. Casteleyn, and W. Vyverman. 2001. Uncoupling of bacterial production and flagellate grazing in aquatic sediments: a case study from an intertidal flat. Aquat. Microb. Ecol. 25:1-42. [Google Scholar]
- 32.Jackson, G. A., and A. B. Burd. 1998. Aggregation in the marine environment. Environ. Sci. Technol. 32:2805-2814. [Google Scholar]
- 33.Jacobsen, T. R., and F. Azam. 1984. Role of bacteria in copepod fecal pellet decomposition: colonization, growth rates and mineralization. Bull. Mar. Sci. 35:495-502. [Google Scholar]
- 34.Kilps, J. R., B. E. Logan, and A. L. Alldredge. 1994. Fractal dimensions of marine snow determined from image analysis of in situ photographs. Deep Sea Res. I 41:1159-1169. [Google Scholar]
- 35.Kiørboe, T. 2001. Formation and fate of marine snow: small-scale processes with large-scale implications. Sci. Mar. 65(Suppl. 2):57-71. [Google Scholar]
- 36.Kiørboe, T., H.-P. Grossart, H. Ploug, and K. Tang. 2002. Mechanisms and rates of bacterial colonization of sinking aggregates. Appl. Environ. Microbiol. 68:3996-4006. [DOI] [PMC free article] [PubMed] [Google Scholar]
- 37.Kiørboe, T., and G. A. Jackson. 2001. Marine snow, organic solute plumes, and optimal chemosensory behavior of bacteria. Limnol. Oceanogr. 46:1309-1318. [Google Scholar]
- 38.Kiørboe, T., H. Ploug, and U. H. Thygesen. 2001. Fluid motion and solute distribution around sinking aggregates. I. Small-scale fluxes and heterogeneity of nutrients in the pelagic environment. Mar. Ecol. Prog. Ser. 211:1-13. [Google Scholar]
- 39.Long, R. A., and F. Azam. 2001. Antagonistic interactions among marine pelagic bacteria. Appl. Environ. Microbiol. 76:975-4983. [DOI] [PMC free article] [PubMed] [Google Scholar]
- 40.Patterson, D. J., K. Nygaard, G. Steinberg, and C. M. Turley. 1993. Heterotrophic flagellates and other protists associated with oceanic detritus throughout the water column in the mid North Atlantic. J. Mar. Biol. Assoc. UK 73:67-95. [Google Scholar]
- 41.Ploug, H., and H. P. Grossart. 2000. Bacterial growth and grazing on diatom aggregates: respiratory carbon turnover as a function of aggregate size and sinking velocity. Limnol. Oceanogr. 45:1467-1475. [Google Scholar]
- 42.Ploug, H., M. Kühl, B. Buchholz-Cleven, and B. B. Jørgensen. 1997. Anoxic aggregates—an ephemeral phenomenon in the pelagic environment? Aquat. Microb. Ecol. 13:285-294. [Google Scholar]
- 43.Pomeroy, L. R., R. B. Hanson, P. A. McGillivary, B. F. Sherr, D. Kirchman, and D. Deibel. 1984. Microbiology and chemistry of fecal products of pelagic tunicates: rates and fates. Bull. Mar. Sci. 35:426-439. [Google Scholar]
- 44.Sherr, B. F., E. B. Sherr, and T. Berman. 1983. Grazing, growth, and ammonium excretion rates of a heterotrophic microflagellate fed with four species of bacteria. Appl. Environ. Microbiol. 45:1196-1201. [DOI] [PMC free article] [PubMed] [Google Scholar]
- 45.Simon, M., H.-P. Grossart, B. Schweitzer, and H. Ploug. 2002. Microbial ecology of organic aggregates in aquatic ecosystems. Aquat. Microb. Ecol. 28:175-211. [Google Scholar]
- 46.Smith, D. C., M. Simon, A. L. Alldredge, and F. Azam. 1992. Intensive hydrolytic activity on marine aggregates and implications for rapid particle dissolution. Nature 359:139-141. [Google Scholar]
- 47.Starink, M., M. J. Bär-Gilissen, R. P. Bak, and T. E. Cappenberg. 1996. Bacterivory by heterotrophic nanoflagellates and bacterial production in sediments of a freshwater littoral system. Limnol. Oceanogr. 41:62-69. [Google Scholar]
- 48.Tanaka, T., and A. Taniguchi. 1999. Predator-prey eddy in heterotrophic nanoflagellate-bacteria relationships in a bay on the northeastern Pacific coast of Japan. Mar. Ecol. Prog. Ser. 179:123-134. [Google Scholar]
- 49.Wikner, J., A. A. Anderson, S. Normark, and Å. Hagström. 1986. Use of genetically marked minicells as a probe in measurement of predation on bacteria in pelagic environments. Appl. Environ. Microbiol. 52:4-8. [DOI] [PMC free article] [PubMed] [Google Scholar]
- 50.Wörner, U., H. Zimmerman-Timm, and H. Kausch. 2000. Succession of protists on estuarine aggregates. Microb. Ecol. 40:209-222. [DOI] [PubMed] [Google Scholar]
- 51.Zubkov, M. V., and M. A. Sleigh. 2000. Comparison of growth efficiencies of protozoa growing on bacteria deposited on surfaces and in suspension. J. Eukaryot. Microbiol. 47:62-69. [DOI] [PubMed] [Google Scholar]


