Abstract
Phosphorylation of proteins on serine or threonine residues preceding proline (pSer/Thr-Pro) is a major regulatory mechanism in cell proliferation and transformation. Interestingly, the pSer/Thr-Pro motifs in proteins exist in two distinct cis and trans conformations, whose conversion rate is normally reduced on phosphorylation, but is catalyzed specifically by the prolyl isomerase Pin1. Pin1 can catalytically induce conformational changes in proteins after phosphorylation, thereby having profound effects on catalytic activity, dephosphorylation, protein-protein interactions, subcellular location, and/or turnover of certain phosphorylated proteins. Recently, it has been shown that Pin1 is overexpressed in human breast cancer cell lines and cancer tissues and plays a critical role in the transformation of mammary epithelial cells by activating multiple oncogenic pathways. Furthermore, Pin1 expression is an excellent independent prognostic marker in prostate cancer. However, little is known about Pin1 expression in other human normal and cancerous tissues. In the present study, we quantified Pin1 expression in 2041 human tumor samples and 609 normal tissue samples as well as normal and transformed human cell lines. We found that Pin1 was usually expressed at very low levels in most normal tissues and its expression was normally associated with cell proliferation, with high Pin1 levels being found only in a few cell types. However, Pin1 was strikingly overexpressed in many different human cancers. Most tumors (38 of 60 tumor types) have Pin1 overexpression in more than 10% of the cases, as compared with the corresponding normal controls, which included prostate, lung, ovary, cervical, brain tumors, and melanoma. Consistent with these findings, Pin1 expression in human cancer cell lines was also higher than that in the normal cell lines examined. These results indicate that Pin1 overexpression is a prevalent and specific event in human cancers. Given previous findings that Pin1 expression is an excellent prognostic marker in prostate cancer and that inhibition of Pin1 can suppress transformed phenotypes and inhibit tumor cell growth, these findings may have important implications for the pathogenesis, diagnosis, and treatment of human cancers.
Oncogenesis is a multistep and multifactorial process, both at the genetic and epi-genetic levels, that results in uncontrolled cell proliferation, transformation, and cell death. One major regulatory mechanism in cell proliferation and transformation is phosphorylation of proteins on serine or threonine residues preceding proline (pSer/Thr-Pro) by various prodirected protein kinases, such as MAP kinases, cyclin-dependent kinases, JNK, and GSK3β.1–3 Interestingly, the pSer/Thr-Pro motifs in proteins exist in two completely distinct cis and trans conformations, whose conversion is normally restrained by phosphorylation, but catalyzed specifically by the essential prolyl isomerase Pin1.3–6 By isomerizing specific pSer/Thr-Pro bonds, Pin1 has been shown to catalytically induce conformational changes in proteins after phosphorylation, thereby having profound effects on their catalytic activity, dephosphorylation, protein-protein interactions, subcellular location, and/or turnover.4,5,7–18 Thus, phosphorylation-dependent prolyl isomerization is a critical postphosphorylation regulatory mechanism in phosphorylation signaling.3
Recently, it has been reported that Pin1 is overexpressed in human breast cancer cell lines and breast cancer tissues, and its expression closely correlates with the level of cyclin D1 in tumors.15 Furthermore, Pin1 positively regulates cyclin D1 function at the transcriptional level by activating β-catenin/TCF transcription factors and c-jun/AP-1 transcriptional factors, and also through posttranslational stabilization.15–17 Moreover, Pin1 is an E2F downstream target gene, whose expression is activated by various oncogenic proteins such as Neu and/or Ras.18 In addition, the transient conformational change of BclII because of association with peptidyl prolyl isomerase might contribute to apoptotic signaling,19,20 and the transcription factor nuclear factor-κB signaling is also regulated by Pin1.21 Overexpression of Pin1 not only confers transforming properties on normal mammary epithelial cells, but also enhances transformed phenotypes of Neu/Ras-transformed mammary epithelial cells.18 In contrast, inhibition of Pin1 suppresses the Neu- and Ras-induced transformed phenotypes or induces tumor cells into mitotic arrest and apoptosis.18 Consistent with a role of Pin1 in cell growth regulation, Pin1 knockout mice displayed a range of cell proliferative abnormalities, including decreased body size, testicular atrophy, retinal degeneration, and neurological abnormality.14 Moreover, in Pin1−/− adult female mice the breast epithelial compartment failed to undergo the massive proliferative changes associated with pregnancy,17 indicating that Pin1 is critical for cell proliferation in vivo. Finally, we have recently shown that Pin1 expression is positively correlated with clinical stage in human prostate cancer.22 Of 580 prostate cancer patients analyzed, patients with a higher level of Pin1 expression have a significantly higher probability of recurrence than their counterparts with low Pin1 expression after radical prostatectomy, even when patients with Gleason score 6 or 7 are analyzed separately. Together, these results strongly suggest that overexpression of Pin1 may promote tumor cell growth and contribute to the malignancy of cancer cells.
Despite the evidence that Pin1 protein is overexpressed in human breast cancers and its significant prognostic role in prostate cancer, there have been no previous reports that have addressed Pin1 protein levels in other human cancerous tissues. In the present study we conducted a quantitative investigation on 2041 human tumor samples and 609 normal tissue samples as well as 10 human transformed cell lines and three human normal cell lines to investigate the levels of Pin1 protein in various tumor tissues and compared that with corresponding normal tissues. Consideration of whether Pin1 protein is overexpressed in cancer versus normal tissues will provide valuable insights into the significance of Pin1 in oncogenesis and eventually this may be useful for development and application of more effective and potentially curative treatment strategies in which the inhibition of Pin1protein is an integral component.
Materials and Methods
Human Cell Lines
Thirteen human cell lines (HUV-EC-C, WI 38, MCF10a, RPMI 7951, SW620, SW1271, DU145, PC-3, T98G, DBTRG-05MG, MDA-MB-435, and MCF7) were obtained from the American Type Culture Collection (Manassas, VA) and T47D was obtained from the Arizona Cancer Center (Tucson, AZ). Cells were cultured according to the instructions provided by the agency and provider.
Immunocytochemistry
Immunocytochemitry on cultured cells was performed as described previously,23 with the following modifications. Cells were cultured on cover slides and fixed with 3% formaldehyde for 5 minutes at room temperature. Cells were permeabilized with 0.4% Triton X-100, followed by immersion in 3% H2O2/methanol for 15 minutes to block endogenous peroxidase. Cells then were incubated with anti-Pin1 antibodies overnight at 4°C and then biotinylated secondary antibodies (Vector Laboratories, Burlingame, CA). Immunoreactivity was detected using a Vectastain Elite ABC kit (Vector Laboratories) according to the manufacturer’s instructions.
Immunoblotting Analysis
To detect Pin1 levels using immunoblotting analysis, cell lysates were obtained by sonication of cell pellets in 50 mmol/L Tris-HCl, pH 8.0, 150 mmol/L NaCl, 0.5% Triton X-100, 10 μg/ml phenylmethyl sulfonyl fluoride, and 20 μg/ml leupeptin, as described.15 Lysates were clarified by centrifugation 16,000 × g for 2 minutes. Tissue lysates were obtained from Ardais Co. (Lexington, MA). Proteins were resolved by 15% sodium dodecyl sulfate-polyacrylamide gel electrophoresis (BioWhittaker, Rockland, ME), then were transferred at 4°C in 1× Tris-glycine-sodium dodecyl sulfate (Biorad, Hercules, CA) containing 20% methanol onto nitrocellulose. Immunoblotting was performed with anti-Pin1or anti-actin antibodies, as described.15 Bound antibodies were detected by ECL (Amersham-Pharmacia, Piscataway, NJ). Levels of Pin1 and actin were quantified by densitometry using Imagequant software (Amersham-Pharmacia), followed by expressing Pin1 levels as Pin1:actin ratios, as described.15 Ratios given are an average from multiple gels.
Human Tissue Sources
We used two different human tissue sources, conventional tissue sections and tissue microarrays. Large conventional sections of formalin-fixed, paraffin-embedded human tumor tissue were provided by the Cooperative Human Tissue Network, which included 18 bladder cancer, 10 breast cancer, 19 colon cancer, 18 lung cancer, 30 ovary cancer, 11 lymphoma, and 3 prostate cancer samples. The tissue microarrays were provided by the Institute of Pathology, University of Basel (Basel, Switzerland), as described previously.24,25 The normal tissue arrays included 609 samples from 50 different organs, whereas the multitumor arrays included 2041 patients’ tumor samples representing 60 different tumor types. All tissue samples were formalin-fixed and paraffin-embedded. Each tissue dot in the microarrays had a diameter of 0.6 mm.
Anti-Pin1 Antibodies
Polyclonal anti-Pin1 antibodies (catalog no. PC270; Oncogene, Cambridge, MA) and a monoclonal anti-Pin1 antibody that we generated ourselves were used in this study. To ensure the specificity of Pin1 immunostaining, Pin1 polyclonal antibodies were affinity-purified and the specificity of the antibody was tested by Western blotting (data not shown). Moreover, preabsorbed polyclonal antibodies and monoclonal antibody by GST-Pin1 protein did not reveal any specific reactivity in the immunostaining on cells and tissues (data not shown).
Immunohistochemistry on Human Tissues
Immunohistochemistry was performed as described.15,22 Briefly, the sections were deparaffinized in xylene twice for 10 minutes each, and rehydrated in graded ethanols (100%, 95%, and 75%) for 5 minutes each, followed by immersion in 3% H2O2/methanol for 15 minutes to block endogenous peroxidase. For antigen retrieval, the sections were microwaved in citrate buffer (pH 6.0) (BioGenex) gently boiling for 15 minutes. The sections were then blocked in 10% normal goat serum in Tris-buffered saline, followed by incubation with polyclonal (0.4 μg/ml) or monoclonal (0.1 μg/ml) Pin1 antibodies overnight at 4°C in a humidity container. Then the sections were incubated with biotinylated goat anti-rabbit or mouse IgG (Vectastain Elite ABC kit, Vector Laboratories) diluted at 1:400 in 5% normal goat or horse serum for 30 minutes at room temperature. The standard ABC process was then followed, according to the manufacturer’s instructions. Diaminobenzidine was used as a chromogen, followed by counterstaining with hematoxylin.
Analysis and Quantification of Pin1 Immunostaining
After immunostaining, slides were evaluated by two different methods, as described previously.22 Briefly, normal and tumor tissues were evaluated manually under the microscope by a single pathologist (GS) and automatically using the Automated Cellular Imaging System (ACIS; ChromaVision Medical Systems, Inc., San Juan Capistrano, CA). For manual analysis, in normal tissues, a cell type-specific distribution of Pin1 expression was recorded. For tumor tissues the percentage of positive cells was estimated and the staining intensity was semiquantitatively recorded as 1+, 2+, or 3+.24,25 For ACIS, entire immunostained tissue sections were scanned using the ×4 objective and then images were captured using the ×10 objective by ACIS. ACIS combines automated microscopy and computerized image processing to analyze multiple tissues on a single slide. In this study, ACIS was used to analyze microarray tissue sections on glass slides stained using a diaminobenzidine chromagen, with hematoxylin counterstain. Positive staining (brown) as viewed by a light microscope indicates the presence of the protein, and the intensity of the color correlated directly with the amount of the protein. The ACIS was able to quantify immunohistochemical staining intensity for the selected individual areas. However, the base limit on the threshold for the generic diaminobenzidine is preset at 50 by the manufacturer because of the high sensitivity of the system. Therefore, any intensity below 50 was treated as 0 in this study, as suggested by the manufacturer.22
Results
Pin1 Levels in Normal and Transformed Human Cell Lines
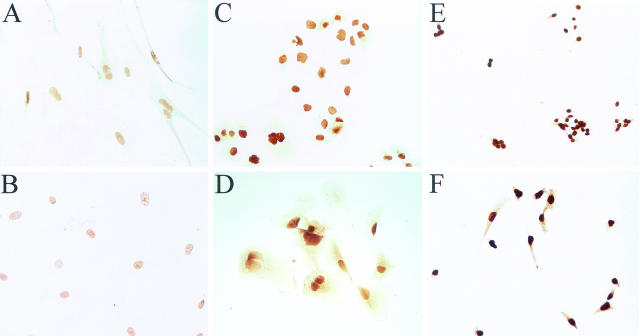
In the previous report,15 higher Pin1 levels were shown in human breast carcinoma-derived cell lines in comparison with normal human mammary epithelial cell lines or a spontaneously immortalized normal human mammary epithelial cell line. To determine Pin1 expression in other tumor cell lines, we first determined Pin1 levels in the following six human cell lines by immunocytochemistry: a normal endothelial (HUV-EC-C) cell line, a normal fibroblast cell line (WI38), a melanoma cell line (RPMI7951), a colon cancer cell line (SW620), and two prostate cancer cell lines (PC3 and DU145). When immunostained with anti-Pin1 polyclonal antibodies and monoclonal antibody, all cell lines had Pin1 staining predominantly in the nucleus, which is consistent with previous findings that Pin1 is primarily located in the nucleus of cultured cells.4 However, the concentration of Pin1 protein varied between cell types with normal fibroblast (WI38) and endothelial (HUV-EC-C) cells showing the lowest Pin1 concentrations and the SW620 (colon cancer) and PC-3 (prostate cancer) cell lines showing highest concentrations of Pin1 (Figure 1).
Figure 1.
Immunocytochemical staining of Pin1 in cultured cells. Cells were incubated with anti-Pin1 antibodies, followed by secondary biotinylated antibody and ABC (avidin and biotinylated horseradish peroxidase complex)-diaminobenzidine reaction. A: WI38 (normal fibroblast) cell line; B: HUV-EC-C (normal epithelial) cell line; C: DU 145 (prostate cancer) cell line; D: RPMI 7951 (melanoma) cell line; E: SW620 (colon cancer) cell line; F: PC3 (prostate cancer) cell line. Original magnifications, ×40.
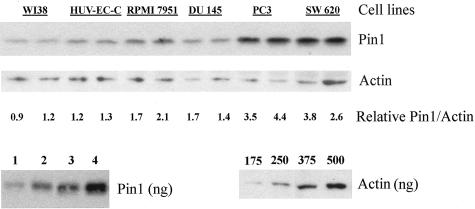
To verify and confirm these immunostaining results by an independent method, we then screened human tumor cell lines from multiple tumor types for Pin1 levels by Western blotting. Western blotting showed a clear single band for both Pin1 (poly and mono) antibodies. The results were semiquantitatively evaluated and internally controlled by actin, with the final results were shown as a relative Pin1 concentration as determined by the Pin 1:actin ratio for each cell line examined (Figure 2 and Table 1), as described previously.15 Pin1 protein levels were determined for 13 human cell lines: a normal fibroblast cell line (WI-38), a normal endothelial cell line (HUV-EC-C), a spontaneously immortalized normal breast cell line (MCF10a), breast tumor cell lines (MDA-MB-435, T47D, MCF-7), glioblastoma cell lines (T98G, DBTRG-05MG), prostate tumor cell lines (PC-3, DU 145), a colon tumor cell line (SW620), a small cell lung cancer cell line (SW1271), and a melanoma cell line (RPMI7951). Average Pin1 levels for these cell lines are shown in Table 1. A representative Western blot of the six of the cell lines examined by immunohistochemistry (above) is shown in Figure 1. All cell lines examined had detectable Pin1 protein by anti-Pin1 monoclonal or polyclonal antibodies (Table 1). Consistent with above immunocytochemistry results, the lowest levels of Pin1were obtained from the normal cell lines, WI-38, HUV-EC-C, and MCF10a. All tumor cell lines contained higher levels of Pin1 than the normal cell lines with two of the tumor cell lines, SW620 (colon cancer) and PC-3 (prostate cancer) containing the highest levels of Pin1 (Figure 2 and Table 1). These results obtained from immunoblotting and immunostaining analysis have not only confirmed but also expanded previous findings that Pin1 levels are higher in tumor cell lines than those in normal cells.15
Figure 2.
Immunoblotting analysis of Pin1 expression of cell extracts. Total cell lysates prepared from different cell lines were subjected to immunoblotting analysis with monoclonal Pin1 and actin antibodies. The locations of Pin1 and actin are indicated. The average Pin1concentrations as determined from the Pin1:actin ratio from a minimum of three Western blots in cell lines is shown in Table 1. Purified protein standards were used to determine the linear range for both proteins. Immunohistochemistry of these cell lines is shown in Figure 1.
Table 1.
The Pin1 Concentration Relative to WI38
| Cell line | Cell type | Relative Pin1 concentration (polyclonal) | Relative Pin1 concentration (monoclonal) |
|---|---|---|---|
| WI 38 | Fibroblast | 1.0 ± 0.0 | 1.0 ± 0.2 |
| HUV-EC-C | Endothelial | Not tested | 1.2 ± 0.1 |
| MCF 10A | Breast | 1.2 ± 0.0 | 1.2 ± 0.4 |
| DBTRG 05MG | Glioma | 1.8 ± 0.1 | 1.6 ± 0.3 |
| RPMI 7951 | Melanoma | 1.9 ± 0.2 | 1.9 ± 0.4 |
| SW 1271 | Lung (small cell) | 1.6 ± 0.3 | 1.9 ± 0.2 |
| MCF 7 | Breast | 1.9 ± 0.1 | 2.0 ± 0.5 |
| T98G | Glioma | 2.1 ± 0.5 | 2.0 ± 0.2 |
| DU 145 | Prostate | 1.9 ± 0.2 | 2.1 ± 0.4 |
| MDA-MB-435 | Breast | 2.1 ± 0.3 | 2.3 ± 0.4 |
| T47D | Breast | 2.4 ± 0.3 | 2.1 ± 0.2 |
| SW 620 | Colon | 3.0 ± 0.4 | 2.9 ± 0.4 |
| PC 3 | Prostate | 3.2 ± 0.4 | 3.5 ± 0.6 |
WI 38, HUV-EC-C, and MCF10a are cell lines derived from human normal tissues. SW 620, PC-3, DU 145, RPMI 7951, T47D, MDA-MB-435, MCF7, T98G, DBTRG 05MG, and SW1271 are cell lines derived from human tumor tissues. Pin1 concentrations as determined from Pin1:actin ratios are averages from a minimum of three gels.
Pin1 Levels in Human Normal Tissues
Before examining the Pin1 levels in human cancer tissues, we first examined its levels in a large number (609 tissue samples) of the normal tissues provided by the Institute of Pathology, University of Basel (Switzerland). Because cancer is typically derived from an individual cell type within normal tissue, all samples were examined in detail and Pin1 levels were evaluated by each individual cell type. Pin1 levels were undetectable or very low (with the score of 0 to 1+) in 49 cell types present in most normal human tissues examined (data not shown). Moderate to medium Pin1-positive staining (with the score of 2+) was observed in 29 cell types (Table 2). High Pin1 level (with the score of 3+) was found only in four cell types, which were ciliated cells in fallopian tube, lung bronchi and nose paranasal sinus, granulose cell layer in ovary and cytotrophoblast, endothelial cells in fetal capillaries, and mesenchymal cells in placenta (Table 2). These results indicate that Pin1 is normally expressed at very low levels in most normal tissues, although significant levels of Pin1 are often found in cell types that normally undergo active cell division.
Table 2.
Pin1 Expression in Human Normal Tissues
| Organ | Cell type |
|---|---|
| Respiratory tract | |
| Lung bronchi | Ciliated cell+++, (glandsa) serous cell++ |
| Nose, paranasal sinus | Ciliated cell+++ |
| Urogenital tract | |
| Kidney pelvis, muscular wall | Lymphocyte++, Schwann cell++, endothelial cell++ |
| Kidney, cortex | Tubule cell++, endothelial cell++ |
| Penis, glans, corpus spongiosum | Endothelial cell++ |
| Prostate | Columnar secretory cell++, basal cell++ |
| Testis | Primary spermatocyte++, secondary spermatocyte++ |
| Epididymis | Tall slender cell (=apical cell)++ |
| Female genital tract | |
| Endometrium, proliferation | Glandular cell++, endometrial stromal cell++ |
| Endometrium, secretion | Glandular cell++, endometrial stromal cell++ |
| Fallopian tube | Ciliated cell+++ |
| Ovary, follicular cyst | Theca interna cell (=theca-lutein cell)++, granulosa cell layer+++ |
| Placenta, early, decidua | Decidual cell++ |
| Placenta, first trimenon | Cytotrophoblast+++, mesenchymal cell+++, endothelial cell fetal capillaries+++ |
| Gastrointestinal tract | |
| Esophagus, muscular wall | Lymphocyte++, Schwann cell++ |
| Ileum, muscular wall | Endothelial cell++, Schwann cell++ |
| Oral cavity | Lymphocyte++, endothelial cell++ |
| Colon descendens, muscular wall | Schwann cell++, endothelial cell++, endothelial cell++ |
| Stomach, antrum | Mucous-secreting cell++ |
| Stomach, fundus and corpus | Parietal cell++, chief cell++ |
| Gallbladder | Columnar cell (surface epithelium)++ |
| Anal canal, skin | Basal cell++, intraep lymphocytes++, suprabasal cell++ |
| Endocrine system | |
| Adrenal gland | Cortical cell++, pheochromocyte++ |
| Pancreas | Islet cell (β-cell (insulin)++, alpha-cell (glucagon)++, ∂-cell (somatostatin)++, PP-cell (pancreatic polypeptide)++ |
| Other systems | |
| Cerebellum, cortex | Neuron++ |
| Aorta, intima | Fibroblast++ |
| Skin, surface | Lymphocyte++, endothelial cell++ |
| Thymus | Thymocyte (small lymphocyte)++ |
| Tonsil, surface | Basal cell++, squamous cell++, intraep lymphocytes++ |
++, Moderate, +++, strong.
Pin1 Levels in Human Cancer Tissues
Study on Conventional Human Tissue Sections
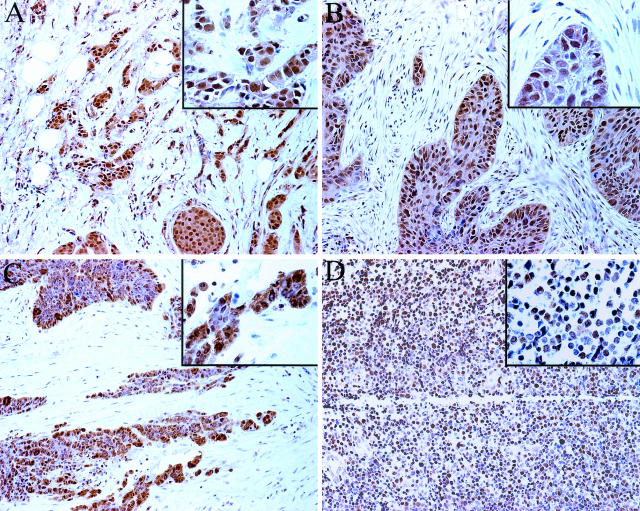
As an initial step to evaluate Pin1 expression in different human cancer tissues, we obtained 109 large conventional tissue sections of human tumor samples from the Cooperative Human Tissue Network. When immunostained with anti-Pin1 antibodies and evaluated under the microscope, Pin1-positive staining was readily identified in both the nucleus and cytoplasm in 10 of 18 bladder, 10 of 10 breast, 9 of 19 colon, 12 of 18 lung, 2 of 3 prostate, 10 of 11 lymphoma, and 5 of 30 ovary cancer samples (Figure 3). Both polyclonal and monoclonal anti-Pin1 antibodies gave a similar staining pattern and results. Although these results were not directly compared with the corresponding normal tissues, they suggested that Pin1 might be overexpressed in many different tumors at rather high incidences.
Figure 3.
Immunohistochemistry of Pin1 in cancer tissues on conventional tissue sections. Sections from paraffin-embedded tissues were subjected to immunostaining with anti-Pin1 antibodies. A: Breast cancer; B: lung cancer; C: ovary cancer; D: lymphoma. Original magnifications: ×20; ×40 (insets).
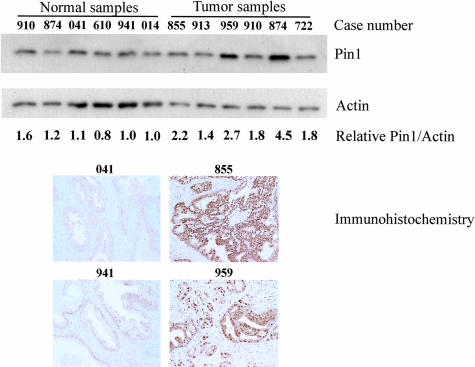
To further verify and confirm these immunocytochemistry results, we performed anti-Pin1 Western blotting analyses on six normal and six prostate cancer tissues (Figure 4 and Table 3). Three prostate tumors were from Gleason score 8 patients (patient numbers, 722, 874, 910) and the other three were from Gleason score 9 patients (patient numbers, 959, 913, 855). Four of the normal prostate tissues were obtained from normal patients (patient numbers, 014, 941, 610, 041). The remaining two were obtained from normal tissue of cancer patients (patient numbers, 874, 910). In agreement with data typically seen by immunohistochemistry, some patients overexpressed Pin1 whereas others did not. Of the tumors examined, one of the Gleason score 8 and two of the Gleason score 9 patients overexpressed Pin1 to a level more than twofold greater than normal. A direct comparison of tumor versus normal tissue is possible for patients 874 and 910 because we had both tumor and normal tissues from the same patients. The tumor from patient 874 shows substantial Pin1 overexpression relative to the surrounding normal tissue. Moreover, six above prostate samples have the corresponding formalin-fixed, paraffin-embedded tissue slides (normal samples, 041, 610, 941; tumor samples, 722, 855, 959) and were subject to immunostaining with anti-Pin1 antibodies (Figure 4). A significant correlation was found between immunohistochemistry and Western blotting by Pearson’s coefficient of correlation, r = 0.81, P < 0.05 (date not shown). These results indicate that there is a good correlation between immunohistochemistry and Western blotting analysis in determining Pin1 expression in human normal and cancer tissues.
Figure 4.
Immunoblotting and immunohistochemistry analyses of Pin1 expression in normal and cancerous prostate tissues. Prostate tissue lysates were subjected to immunoblotting analysis with monoclonal Pin1 and actin antibodies. Tumor lysates are identified by patient number. Lysates 722, 874, and 910 are Gleason score 8. Lysates 959, 913, and 855 are Gleason score 9. Both normal and cancer tissue were obtained from patients 874 and 910. The locations of Pin1 and actin are indicated. The average Pin1concentration as determined from the Pin1:actin ratio from multiple Western blots in cell lines is shown in Table 3. Tissue samples from 041 and 941 (normal) and 855 and 959 (cancer) were also subjected to immunostaining with monoclonal Pin1 antibody. Original magnifications, ×20.
Table 3.
Comparison of Pin1 Levels in Prostate Cancer Tissues Relative to Normal Tissue
| Patient number | Gleason score | Relative Pin1 concentration |
|---|---|---|
| 910 | Normal* | 1.8 ± 0.2 |
| 874 | Normal* | 1.0 ± 0.2 |
| 041 | Normal | 1.3 ± 0.2 |
| 610 | Normal | 1.0 ± 0.0 |
| 941 | Normal | 1.1 ± 0.2 |
| 014 | Normal | 0.9 ± 0.2 |
| 855 | 9 | 2.1 ± 0.2 |
| 913 | 9 | 1.1 ± 0.2 |
| 959 | 9 | 2.7 ± 0.5 |
| 910 | 8 | 1.7 ± 0.3 |
| 874 | 8 | 4.1 ± 1.3 |
| 722 | 8 | 1.4 ± 0.5 |
Normal(*) indicates that the normal tissues were obtained from cancer patients. Tumor lysates are identified by patient number. Both normal and cancer tissue were obtained from patients 874 and 910. Pin1 concentrations, as determined by immunoblotting analysis with the anti-Pin1 monoclonal antibody, were expressed as average Pin1:actin ratios from multiple Western blots.
Large-Scale Quantitative Study on Human Tissue Microarrays
To confirm the above initial observation that Pin1 is overexpressed in many different human cancers, we performed a large-scale study using human tissue microarrays to examine Pin1 protein levels in many different human cancer tissues as well as the corresponding normal tissues. Microarray technology is currently a critical new technology that allows for rapid analysis of several hundred tumor samples in expedited experimental approaches. This relatively new technology has recently shown potential in rapidly identifying and characterizing genes and markers involved in the pathogenesis of human cancers.24–26 Our human tissue microarrays included 2041 tumor samples from 60 different tumor types and 609 normal samples from 50 different organ and/or tissues/cell types.
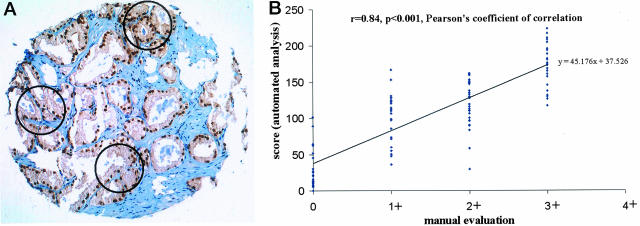
After immunostaining with Pin1 antibodies, Pin1 levels were independently scored manually by a pathologist (GS) using a conventional microscope and automatically by ACIS. For manual evaluation, all immunostained samples were evaluated in 1 day to maximize the internal consistency. The staining intensity was scored in a four-step scale (0, 1+, 2+, 3+).24,25 For the automatic analysis, we first selected three small circles on each sample that contain tumors and then measured the average of the Pin1 intensity and percentage of Pin1-positive tumor cells (selected brown area was divided by total selected area) (Figure 5A). The final Pin1 score was calculated based on the formulation (Pin1 score = intensity + percent positive staining). This score was arbitrarily designed based on our observations that after subtracting the background of 50, the maximal intensity was ∼100, which was similar to maximal percentage of Pin1-positive cells. Therefore, the two parameters are equally weighed.22
Figure 5.
Evaluation of Pin1 immunostaining by ACIS and its correlation with manual evaluation. A: An example of quantitative evaluation for Pin1 immunostaining on tissue microarrays using ACIS. Three small circles were used to selectively measure tumor cell area and obtained the mean of the intensity and percentage of positive tumor cells. B: Correlation between manual evaluation and automated analysis in brain tumors (n = 104).
To determine the correlation between manual and automated analyses, we analyzed the correlation between the scores obtained from both method procedures in selected tumors with various levels of Pin1 expression. When manual evaluation was compared with automated analysis, we found a significant correlation between these two methods. For example, in 104 brain tumors in which Pin1 is highly overexpressed, the Pearson’s coefficient of correlation was 0.84 (P < 0.001) (Figure 5B). Similar results were also obtained in kidney tumors (n = 114; the Pearson’s coefficient of correlation (r), 0.86; P < 0.001), lung tumors (n = 183; r = 0.85; P < 0.001), in breast tumors (n = 149; r = 0.67; P < 0.001), prostate tumors (n = 91; r = 0.7; P < 0.001) and ovarian tumors (n = 116; r = 0.76; P < 0.001) (data not shown). These results indicate that both manual and automatic procedures produce similar results in evaluating Pin1 expression in human tissues arrays.
Pin1 Levels in Human Tumor Tissues
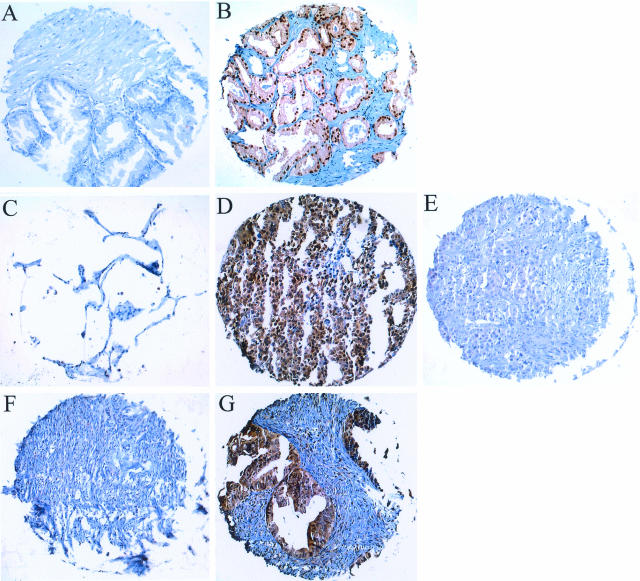
Given that the automatic evaluation procedure can be used to quantify Pin1 expression in a large number of samples and in a less subjective manner, we used this method to compare Pin1 staining in 2041 samples from a total of 60 different tumor types with the corresponding normal tissue (Figure 6). Of note, Pin1 levels in carcinoid and paraganglioma were found to be high, but were not shown because of the difficulty in finding corresponding normal tissues. From our quantitatively evaluated results, we have identified three major groups based on the Pin1 score.
Figure 6.
Comparison of Pin1 expression in tumor tissues and corresponding normal tissues on tissue microarrays. Tissue microarray sections were subjected to immunostaining with anti-Pin1 antibodies. A: Normal prostate tissue; B: prostate cancer; C: normal lung tissue; D: lung cancer; E: lung cancer staining negative for Pin1; F: normal ovary tissue; and G: ovary cancer. Original magnifications, ×10.
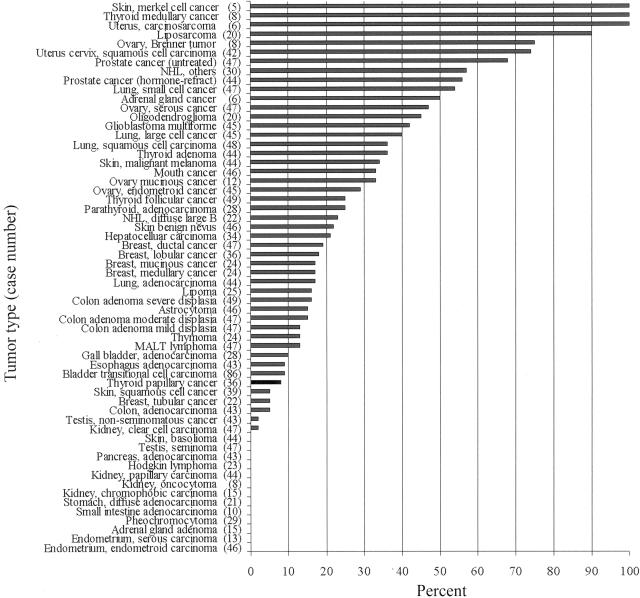
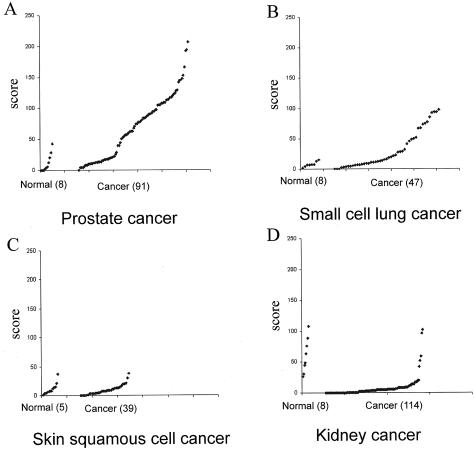
In the first group, we have identified 38 of 60 tumor types that showed more than 10% of cases with elevated Pin1 levels relative to the corresponding normal tissue (Figure 7). Among these cancers, some of the common cancers demonstrated high Pin1 levels in high incidence, including prostate, cervical, brain, lung, breast, colon, liver cancer, and melanoma (Figure 8, A and B). Interestingly, cancers such as small cell lung cancer and liposarcoma, which come from the same cell type origin, both demonstrated high Pin1 levels at high incidence (Figure 7). In the second group, we identified some types of tumors in which Pin1 levels were similar to those present in the corresponding normal tissues. These tumors included skin squamous cell cancer, gall bladder adenocarcinoma, esophagus adenocarcinoma, thyroid papillary carcinoma, breast tubular cancer, and colon adenocarcinoma (Figure 8C). Finally, in third group we found that Pin1 levels in some tumors were even lower than those present in the corresponding normal tissues. These tumors included kidney, testis, adrenal gland, and stomach tumors (Figure 8D). These results indicate that Pin1 overexpression is a specific and prevalent event in human cancers.
Figure 7.
Overexpression of Pin1 in human cancers. Pin1 immunostaining was evaluated quantitatively using ACIS, with the Pin1 score = staining intensity + percentage of positive immunostaining. The percentage of total cases showing elevated levels of Pin1 = the numbers of tumor samples with score larger than the score of the highest normal case divided by the total number of tumor samples.
Figure 8.
Pin1 levels in three representative categories of tumor tissues in comparison with corresponding normal tissues. Pin1 immunostaining was evaluated quantitatively using ACIS with the Pin1 score = staining intensity + percentage of positive immunostaining. Overexpression of Pin1 in prostate cancers (A) and small cell lung cancers (B). No change of Pin1 in skin squamous cell cancers (C) and underexpression of Pin1 in kidney cancers (D).
Discussion
In this study we performed a large scale analysis to examine Pin1 expression in normal and cancerous human tissues as well as cell lines. Of 84 cell types in 50 different normal organs in the human body examined, Pin1 was usually expressed at very low levels in most normal tissues, with high Pin1 levels being found only in a few cell types. However, Pin1 was strikingly overexpressed in many different human cancers. Of 60 human cancer types, Pin1 overexpression was found in 38 types that showed more than 10% of cases with elevated Pin1 levels relative to the corresponding normal tissue including most common human cancers such as prostate, cervical, brain, lung, breast, liver cancer, and melanoma. Consistent with these findings, Pin1 levels in all human cancer cell lines examined were also higher than that in normal cell lines examined. These results indicate that Pin1 overexpression is prevalent and specific in a large subset of human cancers. Given that inhibition of Pin1 can suppress transformed phenotypes and inhibit tumor cell growth as described previously,4,18,27,28 and that Pin1 expression is an excellent prognostic marker in prostate cancer,22 these findings may have important implications for the pathogenesis, diagnosis, and treatment of human cancers.
One important and surprising finding of our study is the prevalence of Pin1 overexpression in a large subset of human cancers. These findings are consistent with the previous findings that Pin1 expression is not only highly regulated but also plays specific roles in oncogenesis. We have shown that Pin1 is an E2F downstream target gene, whose expression is regulated during the cell cycle in normal cells.18 However, in cancer cells, Pin1 levels are elevated and do not change during the cell cycle.8 Given prevalent deregulation of E2F/Rb pathways in many human cancers,29–32 it may play a critical role in the up-regulation of Pin1 in human cancers. Importantly, Pin1 overexpression can activate multiple oncogenic pathways and contribute to cell transformation. For example, in breast cancer, Pin1 positively regulates cyclin D1 function at the transcriptional level in collaboration with Ras and Wnt/β-catenin oncogenic signaling pathways and also through posttranslational stabilization.16,17,28 Furthermore, overexpression of Pin1 can confer anchorage-independent cell growth to normal mammary epithelial cells.18 Moreover, Pin1 overexpression greatly enhances and facilitates transformation induced by oncogenic Neu and Ras in mammary epithelial cells.18 In contrast, inhibition of Pin1 suppresses both cell proliferation and the transformed phenotypes induced by Neu/Ras ontogenesis.18 These results indicate that Pin1 is essential for the Neu/Ras-induced transformation of mammary epithelial cells. Although the biological significance of Pin1 overexpression in many other cancers remains to be elucidated, Pin1 levels are an excellent prognostic marker in prostate cancer.22 Given that Pin1 specifically isomerizes many critical phosphorylated Ser/Thr-Pro motifs, the most common phosphorylation sites in oncogenic pathways,1–3 it is conceivable that Pin1 is an indispensable translator and amplifier of oncogenic signal transduction that responds to and translates oncogenic signaling into cell proliferation and transformation.
The prevalent overexpression of Pin1 in human cancers and correlation of overexpression with poor clinical outcomes in prostate cancer patients are consistent with the previous findings that Pin1 expression is not only highly regulated but also plays specific roles in oncogenesis. Furthermore, they also strongly suggest that Pin1 may be an attractive therapeutic target. Indeed, several lines of evidence also suggest that inhibition of Pin1 can suppress oncogenesis, offering a new option for anti-cancer therapy. First, Pin1 is an enzyme with extraordinarily high-substrate specificity and a well-defined active site.5,7,10,33 Second, Pin1 can potentiate the function of many oncogenic pathways.16–18,28 Third, overexpression of Pin1 can confer transforming properties on mammary epithelial cells and also enhance transformed phenotypes of mammary epithelial cells induced by Neu and Ras.18 Fourth, depletion of Pin1 using anti-sense Pin1 or dominant-negative Pin1 causes cancer cells into apoptosis in transient transfection.4,26,34 Fifth, inhibition of Pin1 via stable expression of dominant-negative Pin1 suppresses the transformed phenotypes induced by Ras/Neu, which can be rescued by constitutively active cyclin D1 mutant.18 Sixth, the strong relationship between the Pin1 level and the clinical outcome of prostate cancer, suggests that Pin1 could become a potential therapeutic target in patients with biologically aggressive tumors.22 Finally, because Pin1 was normally expressed at very low levels in most normal tissues and Pin1 knockout mice do reach adulthood despite some cell proliferative abnormalities,17,35 it is reasonable to assume that a specific anti-Pin1 therapy might not have general toxic effects. However, the feasibility of therapeutic Pin1 inhibition has not yet been explored because of the lack of Pin1-specific inhibitors. Therefore, there is a need for the development of Pin1-specific inhibitors. Such Pin1-specific inhibitors may themselves be effective anti-cancer drugs or become valuable adjuncts to established chemotherapeutic procedures.
In summary, by analyzing Pin1 expression in an usually large number of both normal and cancerous human tissues, we found that Pin1 expression is usually present at relatively low levels in the vast majority of human normal tissues with a few exceptions. More importantly, Pin1 is overexpressed at a rather high frequency in many different tumors, including most common human cancers such as prostate, lung, ovary, cervical, brain tumors, and melanoma. Together with the previous findings that Pin1 plays a pivotal role in breast cancer and that Pin1 overexpression is an independent marker for predicting the probability of recurrence in prostate cancer, these results suggest that Pin1 may play a critical role in the pathogenesis, diagnosis, and treatment of many human cancers.
Footnotes
Address reprint requests to Da-Gong Wang, Pintex Pharmaceuticals Inc., 313 Pleasant St., Watertown, MA 02472. E-mail: dgwang@pintexpharm.com.
K.P.L. and D.-G.W. contributed equally to this article equally.
References
- Blume-Jensen P, Hunter T. Oncogenic kinase signaling. Nature. 2001;411:355–365. doi: 10.1038/35077225. [DOI] [PubMed] [Google Scholar]
- Hanahan D, Weinberg RA. The hallmarks of cancer. Cell. 2000;100:57–70. doi: 10.1016/s0092-8674(00)81683-9. [DOI] [PubMed] [Google Scholar]
- Lu KP, Liou YC, Zhou XZ. Pinning down the proline-directed phosphorylation signaling. Trends Cell Biol. 2002;12:164–172. doi: 10.1016/s0962-8924(02)02253-5. [DOI] [PubMed] [Google Scholar]
- Lu KP, Hanes SD, Hunter T. A human peptidyl-prolyl isomerase essential for regulation of mitosis. Nature. 1996;380:544–547. doi: 10.1038/380544a0. [DOI] [PubMed] [Google Scholar]
- Yaffe MB, Schutkowski M, Shen M, Zhou XZ, Stukenberg PT, Rahfeld J, Xu J, Kuang J, Kirschner MW, Fischer G, Cantley LC, Lu KP. Sequence-specific and phosphorylation-dependent proline isomerization: a potential mitotic regulatory mechanism. Science. 1997;278:1957–1960. doi: 10.1126/science.278.5345.1957. [DOI] [PubMed] [Google Scholar]
- Zhou XZ, Kops O, Werner A, Lu PJ, Shen M, Stoller G, Küllertz G, Stark M, Fischer G, Lu KP. Pin1-dependent prolyl isomerization regulates dephosphorylation of Cdc25C and tau proteins. Mol Cell. 2000;6:873–883. doi: 10.1016/s1097-2765(05)00083-3. [DOI] [PubMed] [Google Scholar]
- Ranganathan R, Lu KP, Hunter T, Noel JP. Structural and functional analysis of the mitotic peptidyl-prolyl isomerase Pin1 suggests that substrate recognition is phosphorylation dependent. Cell. 1997;89:875–886. doi: 10.1016/s0092-8674(00)80273-1. [DOI] [PubMed] [Google Scholar]
- Shen M, Stukenberg PT, Kirschner MW, Lu KP. The essential mitotic peptidyl-prolyl isomerase Pin1 binds and regulates mitosis-specific phosphoproteins. Genes Dev. 1998;12:706–720. doi: 10.1101/gad.12.5.706. [DOI] [PMC free article] [PubMed] [Google Scholar]
- Crenshaw DG, Yang J, Means AR, Kornbluth S. The mitotic peptidyl-prolyl isomerase, Pin1, interacts with Cdc25 and Plx1. EMBO J. 1998;17:1315–1327. doi: 10.1093/emboj/17.5.1315. [DOI] [PMC free article] [PubMed] [Google Scholar]
- Lu PJ, Zhou XZ, Shen M, Lu KP. A function of WW domains as phosphoserine- or phosphothreonine-binding modules. Science. 1999;283:1325–1328. doi: 10.1126/science.283.5406.1325. [DOI] [PubMed] [Google Scholar]
- Lu PJ, Wulf G, Zhou XZ, Davies P, Lu KP. The prolyl isomerase Pin1 restores the function of Alzheimer-associated phosphorylated tau protein. Nature. 1999;399:784–788. doi: 10.1038/21650. [DOI] [PubMed] [Google Scholar]
- Wu X, Wilcox CB, Devasahayam G, Hackett RL, Arevalo-Rodriguez M, Cardenas ME, Heitman J, Hanes SD. The Ess1 prolyl isomerase is linked to chromatin remodeling complexes and the general transcription machinery. EMBO J. 2000;19:3727–3738. doi: 10.1093/emboj/19.14.3727. [DOI] [PMC free article] [PubMed] [Google Scholar]
- Stukenberg PT, Kirschner MW. Pin1 acts catalytically to promote a conformational change in Cdc25. Mol Cell. 2001;7:1071–1083. doi: 10.1016/s1097-2765(01)00245-3. [DOI] [PubMed] [Google Scholar]
- Hsu T, McRackan D, Vincent TS, Gert De Couet H. Drosophila Pin1 prolyl isomerase Dodo is a MAP kinase signal responder during oogenesis. Nat Cell Biol. 2001;3:538–543. doi: 10.1038/35078508. [DOI] [PubMed] [Google Scholar]
- Wulf GM, Ryo A, Wulf GG, Lee SW, Niu T, Lu KP. Pin1 is overexpressed in breast cancer and potentiates the transcriptional activity of phosphorylated c-Jun towards the cyclin D1 gene. EMBO J. 2001;20:3459–3472. doi: 10.1093/emboj/20.13.3459. [DOI] [PMC free article] [PubMed] [Google Scholar]
- Ryo A, Nakamura N, Wulf G, Liou YC, Lu KP. Pin1 regulates turnover and subcellular localization of beta-catenin by inhibiting its interaction with APC. Nat Cell Biol. 2001;3:793–801. doi: 10.1038/ncb0901-793. [DOI] [PubMed] [Google Scholar]
- Liou YC, Ryo R, Huang HK, Lu PJ, Bronson R, Fujimori F, Uchidafl U, Hunter T, Lu KP. Loss of Pin1 function in the mouse resembles the cyclin D1-null phenotypes. Proc Natl Acad Sci USA. 2002;99:1335–1340. doi: 10.1073/pnas.032404099. [DOI] [PMC free article] [PubMed] [Google Scholar]
- Ryo A, Liou YC, Wulf G, Nakamura N, Lee SW, Lu KP. Pin1 is an E2F target gene essential for the Neu/Ras-induced transformation of mammary epithelial cells. Mol Cell Biol. 2002;22:5281–5295. doi: 10.1128/MCB.22.15.5281-5295.2002. [DOI] [PMC free article] [PubMed] [Google Scholar]
- Basu A, Das M, Qanungo S, Fan XJ, DuBois G, Haldar S. Proteasomal degradation of human peptidyl prolyl isomerase pin1-pointing phospho Bcl2 toward dephosphorylation. Neoplasia. 2002;4:218–227. doi: 10.1038/sj.neo.7900233. [DOI] [PMC free article] [PubMed] [Google Scholar]
- Basu A, Haldar S. Signal-induced site specific phosphorylation targets Bcl2 to the proteasome pathway. Int J Oncol. 2002;21:597–601. [PubMed] [Google Scholar]
- Ryo A, Suizu F, Yoshida Y, Perrem K, Liou YC, Wulf G, Rottapel R, Yamaoka S, Lu KP. Regulation of NF-kappaB signaling by Pin1-catalyzed prolyl isomerization and ubiquitin-mediated proteolysis of p65/RelA. Mol Cell. 2003;12:1413–1426. doi: 10.1016/s1097-2765(03)00490-8. [DOI] [PubMed] [Google Scholar]
- Ayala G, Wang DG, Wulf G, Frolov A, Li R, Sowadski J, Wheeler TM, Lu KP, Bao L. The prolyl isomerase Pin1 is a novel prognostic marker in human prostate cancer. Cancer Res. 2003;63:6244–6251. [PubMed] [Google Scholar]
- Lu KP, Hunter T. Evidence for a NIMA-like mitotic pathway in vertebrate cells. Cell. 1995;81:413–424. doi: 10.1016/0092-8674(95)90394-1. [DOI] [PubMed] [Google Scholar]
- Nocito A, Kononen J, Kallioniemi O, Sauter G. Tissue microarrays (TMAs) for high-throughput molecular pathology research. Int J Cancer. 2001;94:1–5. doi: 10.1002/ijc.1385. [DOI] [PubMed] [Google Scholar]
- Torhorst J, Bucher C, Kononen J, Haas P, Zuber M, Kochli OR, Mross F, Dieterich H, Moch H, Mihatsch M, Kallioniemi OP, Sauter G. Tissue microarrays for rapid linking of molecular changes to clinical endpoints. Am J Pathol. 2001;159:2249–2256. doi: 10.1016/S0002-9440(10)63075-1. [DOI] [PMC free article] [PubMed] [Google Scholar]
- Sauter G, Simon R, Hillan K. Tissue microarrays in drug discovery. Nat Rev Drug Discov. 2003;2:962–972. doi: 10.1038/nrd1254. [DOI] [PubMed] [Google Scholar]
- Lu PJ, Zhou XZ, Liou YC, Noel J, Lu KP. Critical role of WW domain phosphorylation in regulating its phosphoserine-binding activity and the Pin1 function. J Biol Chem. 2002;277:2381–2384. doi: 10.1074/jbc.C100228200. [DOI] [PubMed] [Google Scholar]
- Wulf GM, Liou YC, Ryo A, Lee SW, Lu KP. Role of Pin1 in the regulation of p53 stability and p21 transactivation, and cell cycle checkpoints in response to DNA damage. J Biol Chem. 2002;277:47976–47979. doi: 10.1074/jbc.C200538200. [DOI] [PubMed] [Google Scholar]
- Weinberg RA. The molecular basis of oncogenes and tumor suppressor genes. Ann NY Acad Sci. 1995;758:331–338. doi: 10.1111/j.1749-6632.1995.tb24838.x. [DOI] [PubMed] [Google Scholar]
- Macleod K. pRb and E2f-1 in mouse development and tumorigenesis. Curr Opin Genet Dev. 1999;9:31–39. doi: 10.1016/s0959-437x(99)80005-7. [DOI] [PubMed] [Google Scholar]
- Nevins JR. The Rb/E2F pathway and cancer. Hum Mol Genet. 2001;10:699–703. doi: 10.1093/hmg/10.7.699. [DOI] [PubMed] [Google Scholar]
- Trimarchi JM, Lees JA. Sibling rivalry in the E2F family. Nat Rev Mol Cell Biol. 2002;3:11–20. doi: 10.1038/nrm714. [DOI] [PubMed] [Google Scholar]
- Verdecia MA, Bowman ME, Lu KP, Hunter T, Noel JP. Structural basis for phosphoserine-proline recognition by group IV WW domains. Nat Struct Biol. 2000;7:639–643. doi: 10.1038/77929. [DOI] [PubMed] [Google Scholar]
- Rippmann JF, Hobbie S, Daiber C, Guilliard B, Bauer M, Birk J, Nar H, Garin-Chesa P, Rettig WJ, Schnapp A. Phosphorylation-dependent proline isomerization catalyzed by Pin1 is essential for tumor cell survival and entry into mitosis. Cell Growth Differ. 2000;11:409–416. [PubMed] [Google Scholar]
- Fujimori F, Takahashi K, Uchida C, Uchida T. Mice lacking Pin1 develop normally, but are defective in entering cell cycle from G(0) arrest. Biochem Biophys Res Commun. 1999;265:658–663. doi: 10.1006/bbrc.1999.1736. [DOI] [PubMed] [Google Scholar]


