Abstract
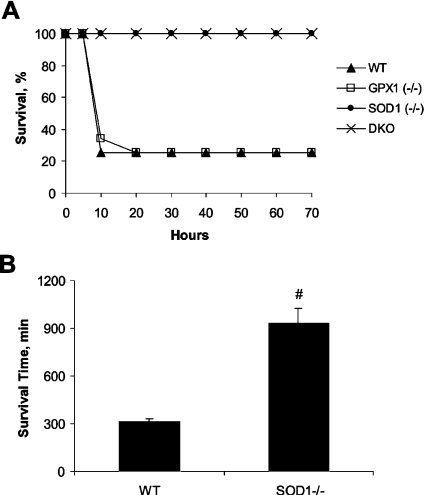
Although antioxidants are used to treat an overdose of the analgaesic/antipyretic drug APAP (acetaminophen), roles of antioxidant enzymes in APAP-induced hepatotoxicity remain controversial. Our objective was to determine impacts of knockout of SOD1 (superoxide dismutase; Cu,Zn-SOD) alone or in combination with selenium-dependent GPX1 (glutathione peroxidase-1) on APAP-induced hepatotoxicity. All SOD1-null (SOD1−/−) and SOD1- and GPX1-double-knockout mice survived an intraperitoneal injection of 600 mg of APAP per kg of body mass, whereas 75% of WT (wild-type) and GPX1-null mice died within 20 h. Survival time of SOD1−/− mice injected with 1200 mg of APAP per kg of body mass was longer than that of the WT mice (934 compared with 315 min, P<0.05). The APAP-treated SOD1−/− mice had less (P<0.05) plasma ALT (alanine aminotransferase) activity increase and attenuated (P<0.05) hepatic glutathione depletion than the WT mice. The protection conferred by SOD1 deletion was associated with a block of the APAP-mediated hepatic protein nitration and a 50% reduction (P<0.05) in activity of a key APAP metabolism enzyme CYP2E1 (cytochrome P450 2E1) in liver. The SOD1 deletion also caused moderate shifts in the APAP metabolism profiles. In conclusion, deletion of SOD1 alone or in combination with GPX1 greatly enhanced mouse resistance to APAP overdose. Our results suggest a possible pro-oxidant role for the physiological level of SOD1 activity in APAP-mediated hepatotoxicity.
Keywords: acetaminophen (APAP), antioxidant enzyme, cytochrome P450 2E1, glutathione peroxidase, protein nitration, superoxide dismutase (SOD)
Abbreviations: ALT, alanine aminotransferase; APAP, acetaminophen; CYP2E1, cytochrome P450 2E1; DKO, double knockout; GPX1, glutathione peroxidase-1; GST, glutathione S-transferase; i.p., intraperitoneal; NAPQI, N-acetyl p-benzoquinoneimine; RNS, reactive nitrogen species; SOD, superoxide dismutase; SOD1, Cu,Zn-SOD; SOD2, Mn-SOD; UGT1A6, UDPglucuronyl transferase 1A6; WT, wild-type
INTRODUCTION
SOD1 (superoxide dismutase; Cu,Zn-SOD; EC 1.15.1.1) and selenium-dependent cellular GPX1 (glutathione peroxidase-1; EC 1.11.19) are widely considered to be two major intracellular antioxidant enzymes in mammals. Because SOD1 catalyses the conversion of superoxide anion into H2O2 that is a substrate of GPX1, these two enzymes are perceived to function consecutively with similar roles in coping with oxidative stress [1–3]. In fact, this view is generally true if the oxidative stress is mediated by pro-oxidants that primarily induce generation of reactive oxygen species [4,5]. However, the reported impacts of SOD1 and GPX1 overexpression on toxicity of APAP (acetaminophen; or N-acetyl-p-aminophenol), a widely used analgaesic/antipyretic drug that induces the formation of RNS (reactive nitrogen species) [6], are completely opposite [7]. Following a lethal dose of APAP (425 mg/kg), mice overexpressing SOD1 had extended survival time and attenuated liver glutathione depletion, whereas mice overexpressing human GPX1 had accelerated death and aggravated hepatotoxicity, compared with WT (wild-type) mice [7]. Meanwhile, another study showed little impact of GPX1 knockout on APAP toxicity [8], which was asymmetrical to the potentiation by GPX1 overexpression [7]. However, effects of SOD1 knockout on APAP toxicity have not been studied or compared with those of GPX1-null mice.
As commonly occurred in clinic, APAP overdose causes hepatotoxicity, including acute liver failure and death [9,10]. The generally accepted mechanism for APAP toxicity is hepatic glutathione depletion [11,12]. After excess APAP saturates glucuronidation and sulfation pathways [13,14], the compound is oxidized into the reactive NAPQI (N-acetyl p-benzoquinoneimine) by liver microsomal cytochrome P450 enzymes [15], mainly CYP2E1 (cytochrome P450 2E1) [16,17]. Low levels of NAPQI are rapidly inactivated by conjugation with glutathione, a reaction catalysed by GST (glutathione S-transferase) [18]. However, high levels of NAPQI bind to cysteine residues on proteins as 3-(cysteine-S-yl)-APAP adducts, after depleting cellular glutathione [9,19]. This type of covalent binding inactivates proteins with important functions [9], leading to hepatic cell death and release of enzymes such as ALT (alanine aminotransferase) into plasma [11,12]. APAP has been shown to induce formation of a potent RNS: peroxynitrite (OONO−) [6]. Because the subsequent nitration of tyrosine residues in liver proteins by peroxynitrite has been suggested to be a critical mediator of APAP toxicity [8], hepatic glutathione might be further depleted as an effective scavenger against the APAP-induced peroxynitrite formation [12].
As our laboratory has mice with four different combinations of SOD1 and GPX1 activities, SOD1−/−, GPX1−/−, DKO (double knockout) and the WT mice, our initial objective was to determine the impacts of knockouts of SOD1 and GPX1 alone or in combination on mouse susceptibility to hepatotoxicity induced by a high dose of APAP. Because SOD1 deletion exerted a much more potent impact on APAP toxicity than that of GPX1, our subsequent objective was to elucidate the biochemical mechanisms for the action of SOD1 deletion.
EXPERIMENTAL
Chemicals and antibodies
All chemicals were purchased from Sigma Chemical Co. (St. Louis, MO, U.S.A.) unless indicated otherwise. Metabolite standards of APAP (APAP-glucuronide and APAP-cysteine) were generously given by McNeil Consumer Healthcare (Fort Washington, PA, U.S.A.). A monoclonal antibody against mouse nitrotyosine was purchased from Upstate Biotechnology (Lake Placid, NY, U.S.A.), and its specificity against nitrotyrosine was verified using the dithionite reduction procedure [20]. The secondary antibody against mouse IgG was from Pierce (Rockford, IL, U.S.A.). The rabbit polycolonal anti-CYP2E1 antibody was purchased from Stressgen (Victoria, British Columbia, Canada). The goat anti-rabbit IgG secondary antibody was from BioRad Laboratories (Hercules, CA, U.S.A.).
Mice and treatments
All experiments were approved by the Institutional Animal Care and Use Committee at Cornell University and conducted in accordance with NIH (National Institutes of Health) Guidelines for Animal Care. WT, GPX1−/− [5] and SOD1−/− [4] mice were derived from 129/SVJ×C57BL/6 lines and provided by Dr Y. S. Ho, Wayne State University (Detroit, MI, U.S.A.). The DKO mice were generated by crossing the GPX1−/− and SOD1−/− mice in our facility. Deletion of GPX1 and SOD1 genes in different genotypes was verified by PCR using tail DNA as templates, and by respective enzyme activity assays in various tissues. Liver GPX1 or SOD1 activities in the respective knockout mice were <1% of the WT mice. Mice were housed in shoebox cages in a room at a constant temperature (22 °C) with a 12 h light/dark cycle and were given free access to food and distilled water.
In the first survival study, WT, SOD1−/−, GPX1−/− and DKO male mice (8-week-old, n=8–10 per group) were given an intraperitoneal injection of PBS or 600 mg of APAP/kg of body mass (prepared in warm PBS) following an overnight fast (8 h). After the injection, mice were observed regularly for 70 h. Two additional survival experiments were conducted with only WT and SOD1−/− mice to assess the impact of SOD1 deletion on mouse survival after injection of a lower dose (300 mg of APAP/kg) and a higher dose (1200 mg of APAP/kg; n=6 for each dose/genotype). In the biochemical and APAP metabolism studies, WT and SOD1−/− mice were injected with 600 or 300 mg of APAP/kg and killed at various time points (0–24 h, n=4–6 per genotype at each time point) post-injection to collect plasma and liver samples. All samples were frozen in liquid nitrogen and stored at −80 °C before analysis.
Liver glutathione concentration, plasma ALT activity and hepatic antioxidant enzyme activities
Liver glutathione was measured using a spectrophotometric method described in [21]. Briefly, liver samples were homogenized (Polytron PT3100; Brinkmann Instruments, Littau, Switzerland) in 10 vol. of 5% (w/v) 5-sulfosalicylic acid. After centrifugation at 14000 g for 20 min at 4 °C, the supernatant was used for the assay. Plasma ALT activity was determined using a kit (Sigma). Liver GPX1 activity was measured using H2O2 as a substrate in a coupled assay with NADPH oxidation, and liver total and SOD2 (Mn-SOD) activities were determined using a water-soluble Formazan dye kit (Dojindo Molecular Technologies, Gaithersburg, MD, U.S.A.) [5]. Liver GST activity was measured using 1-chloro-2,4-dinitrobenzene as a substrate [22]. Liver glutathione reductase and thioredoxin reductase activities were measured as described by Massey and Williams [23] and Holmgren and Bjornstedt [24] respectively.
Metabolites of APAP and related enzyme activities
Metabolite profiles of APAP in plasma and liver were determined using HPLC (Shimadzu, Kyoto, Japan) fitted with an automatic liquid sampler and UV detector [25]. The metabolites were separated utilizing a Nova-Pak® C18 reversed-phase column (4 μm, 3.9×150 mm; Waters, Milford, MA, U.S.A.) and an isocratic solvent system consisting of 1.5% acetic acid and methanol (9:1, v/v) at a flow rate of 1 ml/min. Briefly, 250 μl of acetonitrile containing theophylline as an internal standard was added to 100 μl of plasma samples and the mixture was vigorously vortexed-mixed. Then, 125 μl of acetonitrile was added to precipitate proteins. After centrifugation at 14000 g for 15 min, the supernatant was dried under a gentle stream of nitrogen and re-dissolved in deionized water. After filtration through a 4 mm syringe filter with a 0.2 μm polyethersulfone membrane (Whatman), the filtrate was collected in a 2 ml vial fitted with a 500 μl glass insert for HPLC analysis. For liver tissue, samples were homogenized (1:10, v/w) in 50 mM potassium phosphate buffer (pH 7.8), containing 0.1% Triton X-100 and 1.34 mM diethylenetriaminepenta-acetic acid, and centrifuged at 14000 g for 20 min at 4 °C. Thereafter, 50 μl of supernatant was processed as described in the preparation of fluid samples. APAP metabolite standards were treated the same as tissue samples. Liver microsomal CYP2E1 activity was determined by the CCl3-mediated formation of malondialdehyde [14,26]. Liver microsomal activity of UGT1A6 (UDP glucuronyl transferase 1A6), a key enzyme that catalyses the most predominated pathway for APAP metabolism (glucuoridination) in mice, was determined as described by Hanioka et al. [27].
Western blot analyses
For protein nitration analysis, liver samples were homogenized in 50 mM potassium phosphate buffer (pH 7.8), containing 0.1% Triton X-100, 1.34 mM diethylenetriaminepenta-acetic acid, 1 mM PMSF, 10 μg/ml peptstain A, 10 μg/ml leupeptin and 10 μg/ml aprotinin. The homogenates were centrifuged at 14000 g for 20 min at 4 °C. Protein concentration was measured by the method of Lowry et al. [28]. The supernatant (100 μg of protein/lane) was separated by SDS/PAGE (12% gel). For the analysis of CYP2E1 protein, liver microsomal samples were prepared as described above [14,26], and 10 μg of protein per lane was loaded on to 12% gel. After the gel electrophoresis, the separated proteins were transferred onto a protran BA85 nitrocellulose membrane (Schleicher Schuell Bioscience, Keene, NH, U.S.A.). The membranes were incubated first with respective primary antibodies and then the second antibody against mouse or rabbit IgG.
Statistical analysis
Data were analysed using the GLM procedure of SAS (release 6.11; SAS Institute, Cary, NC, U.S.A.). The Bonferroni t test was used for mean comparisons. The total area under the curves of plasma APAP metabolites was calculated by summing up the areas of trapezoids using Excel (version 2002).
RESULTS
Knockout of SOD1 enhanced mouse resistance to APAP-induced lethality
Following the injection of 600 mg of APAP/kg, 75% of WT and GPX1−/− mice died within 20 h (Figure 1A). In contrast, all SOD1−/− and DKO mice survived for the entire 70 h of the study. No additional death occurred in any genotype for at least 2 weeks after the APAP treatment. Although all SOD1−/− and WT mice died when injected with 1200 mg of APAP/kg, the former survived nearly three times (P<0.05) as long as the latter (Figure 1B). There was no mortality caused by the injection of 300 mg of APAP/kg in WT or SOD1−/− groups up to 2 weeks.
Figure 1. Survival rate and time of different genotypes treated with APAP.
(A) Mice from four different genotypes (n=8–10 per genotype) were given an i.p. (intraperitoneal) injection of 600 mg of APAP/kg and observed for 70 h. (B) WT and SOD1−/− mice (n=6) were given an i.p. injection of 1200 mg of APAP/kg and observed for 24 h. Values are means±S.E.M.; and ‘#’ indicates the genotype effect (P<0.05).
Knockout of SOD1 attenuated APAP-mediated liver injury and glutathione depletion
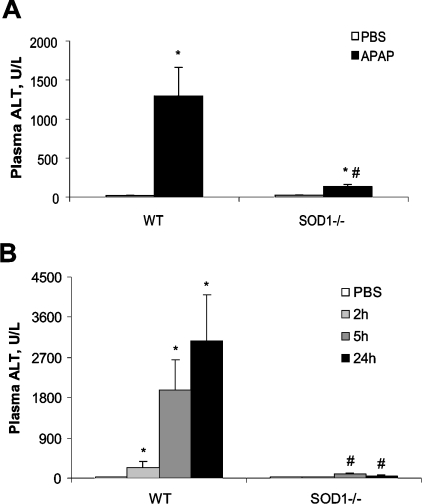
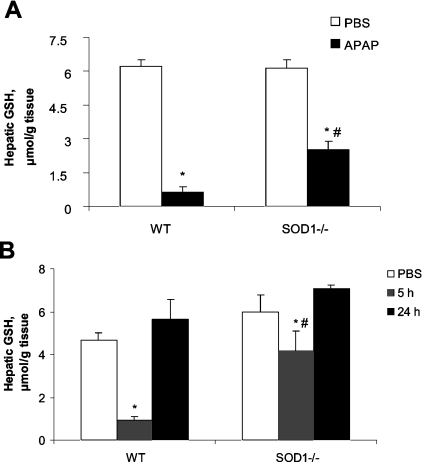
WT mice had a 70-fold increase (P<0.05) over the baseline in plasma ALT activity at 5 h after the injection of 600 mg of APAP/kg (Figure 2A). However, only a small increase in activity was observed (from 23.4 to 134.6 units/l) in the SOD1−/− mice. Significant genotype differences in plasma ALT were also observed at 2, 5 and 24 h after the injection of 300 mg of APAP/kg (Figure 2B). Hepatic glutathione was decreased by the injection of 600 mg of APAP/kg at 5 h to 10% of the PBS-treated controls in the WT mice, as compared with 40% in the SOD1−/− mice (Figure 3A). Likewise, the reduction in hepatic glutathione caused by 300 mg of APAP/kg at 5 h in the SOD1−/− mice was also less (P<0.05) than that in the WT mice (Figure 3B). However, the values were restored to the PBS-treated controls at 24 h in both groups. Neither plasma ALT activities nor hepatic glutathione concentrations were different between the two genotypes treated with PBS.
Figure 2. Plasma ALT activity of WT and SOD1−/− mice treated with APAP at various time points.
(A) Mice were injected (i.p.) with PBS or APAP (600 mg/kg) and killed at 5 h after the injection. (B) Mice were injected (i.p.) with PBS and killed immediately after the injection or injected with APAP (300 mg/kg) and euthanized at 2, 5 and 24 h after the injection. In both panels, values are means±S.E.M. (n=6); * indicates the APAP-treatment effect (P<0.05) as compared with the PBS-treated controls within genotypes, whereas ‘#’ indicates the genotype effect (P<0.05) within the same treatment.
Figure 3. Hepatic glutathione concentrations in WT and SOD1−/− mice treated with APAP at various time points.
(A) Mice were injected (i.p.) with PBS or APAP (600 mg/kg) and killed at 5 h after the injection. (B) Mice were injected (i.p.) with PBS and killed immediately after the injection or injected with APAP (300 mg/kg) and killed at 5 and 24 h after the injection. In both panels, values are means±S.E.M.; (n=6). * indicates the APAP-treatment effect (P<0.05) as compared with the PBS-treated controls within genotypes, whereas ‘#’ indicates the genotype effect (P<0.05) within the same treatment.
Knockout of SOD1 reduced hepatic CYP2E1 activity and blocked APAP-induced hepatic protein nitration
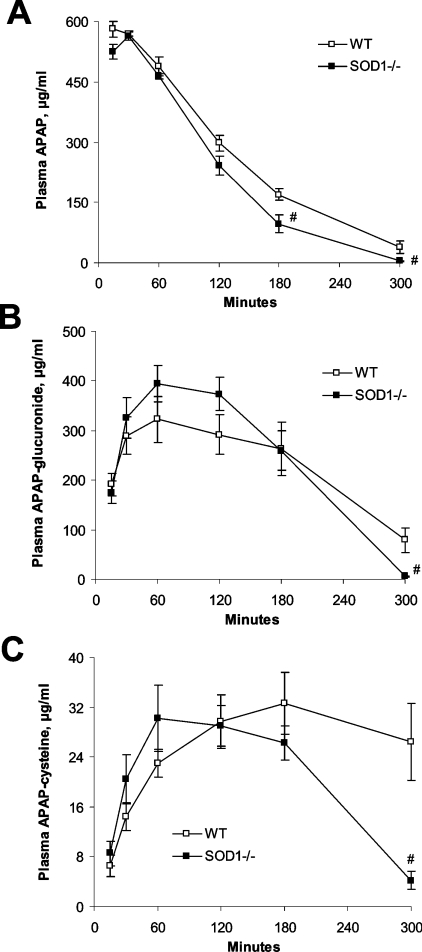
Following the injection of 600 mg of APAP/kg, plasma APAP concentrations in the SOD1−/− mice became lower (P<0.05) than those in the WT mice at 180 and 300 min (Figure 4A). Total area under the curve of plasma APAP was 22% smaller (P<0.05) for the SOD1−/− mice than for the WT mice. Both plasma APAP glucuronide (Figure 4B) and APAP-cysteine (Figure 4C) concentrations in the SOD1−/− mice were lower (P<0.05) than in the WT mice at 300 min. However, total areas under the curves of plasma APAP-glucuronide were nearly identical between the two genotypes. Numerically, the total area under the curve of plasma APAP-cysteine for the SOD1−/− mice was 24% smaller than that for the WT mice, but the difference was not statistically significant (P=0.11).
Figure 4. Plasma concentrations of APAP (A), APAP-glucuronide (B) and APAP-cysteine (C) in WT and SOD1−/− mice treated with 600 mg of APAP/kg at various time points.
Mice were killed at 15, 30, 60, 120, 180 and 300 min after the APAP injection. There was no background in the PBS-treated mice. Values are means±S.E.M. (n=4–6); ‘#’ indicates the genotype effect (P<0.05) within the same time-point.
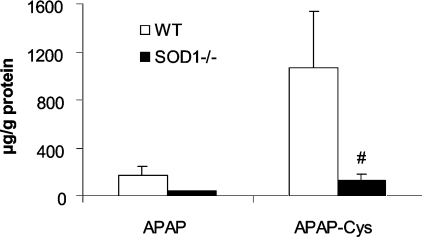
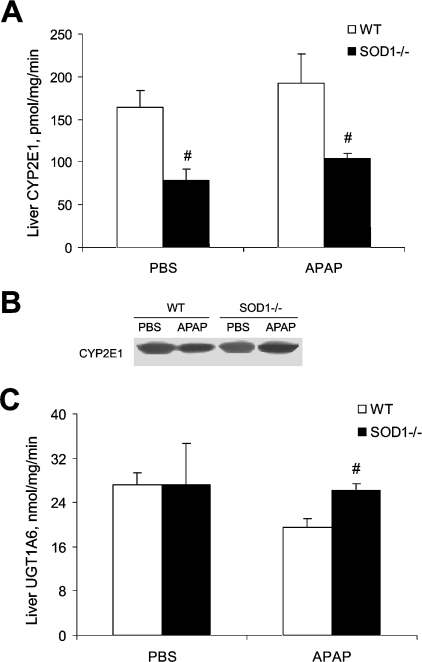
Hepatic concentrations of APAP-cysteine adducts, at 5 h after the APAP injection, in the SOD1−/− mice was only 12% (P<0.05) of that in the WT mice (Figure 5). Meanwhile, there was no significant difference in hepatic APAP concentrations. Hepatic microsomal CYP2E1 activity in the SOD1−/− mice was approx. 50% lower (P<0.05) than that of the WT mice and was unaffected by the APAP treatment (Figure 6A). There was no difference in the protein level of the enzyme between the two genotypes (Figure 6B). Hepatic microsomal UGT1A6 activity was nearly identical between the two genotypes treated with PBS, but was lower (P<0.05) in the WT mice compared with the SOD1−/− mice after being treated with APAP (Figure 6C).
Figure 5. Hepatic concentrations of APAP and APAP-cysteine adducts in WT and SOD1−/− mice treated with 600 mg of APAP/kg.
Mice were killed at 5 h after the injection of APAP. There was no detectable signal in the PBS-treated mice. Values are means±S.E.M. (n=5); ‘#’ indicates the genotype effect (P<0.05) within the same metabolite. APAP-Cys, APAP-cysteine.
Figure 6. Hepatic microsomal activities or concentrations of CYP2E1 and UGT1A6 in WT and SOD1−/− mice treated with PBS or 600 mg of APAP/kg.
(A) CYP2E1 activity. (B) CYP2E1 protein. (C) UGT1A6 activity. Mice were killed at 5 h after the injection of PBS or APAP. In (A) and (C), values are means±S.E.M. (n=5); ‘#’ indicates the genotype effect (P<0.05) within the same treatment. (B) is representative of three independent experiments, and the Western-blot analysis was conducted using SDS/PAGE (12% gel), a primary rabbit polyclonal anti-CYP2E1 antibody and a secondary goat anti-rabbit IgG antibody.
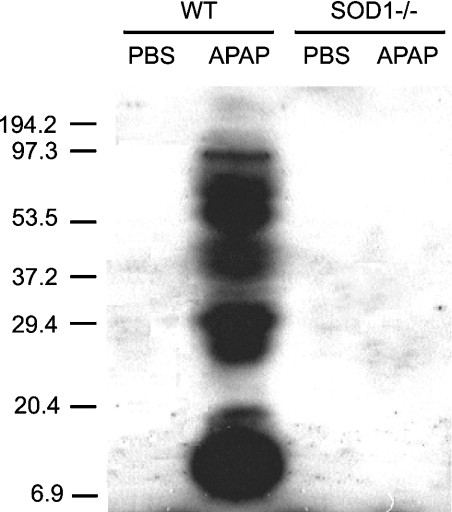
Hepatic protein nitration was induced in the WT, but not in the SOD1−/− mice by the injection of APAP (600 mg/kg) at 5 h (Figure 7). No background hepatic protein nitration was detected in the PBS-treated WT or SOD1−/− mice.
Figure 7. Hepatic protein nitration in the WT and SOD1−/− mice treated with PBS or 600 mg of APAP/kg.
Mice were killed at 5 h after the injection of PBS or APAP. The Western blot analysis was conducted using SDS/PAGE (12% gel), a primary monoclonal mouse antibody against nitrotyrosine and a secondary antibody against mouse IgG. The gel is a representative of four independent experiments.
Knockout of SOD1 altered other antioxidant enzymes or their responses to APAP treatment
Liver GPX1 activity in the PBS-treated SOD1−/− mice was 39% lower (P<0.01) than that in the WT mice (Table 1), and the activity was decreased (24%, P<0.05) in the WT mice by the injection of 600 mg of APAP/kg. Liver thioredoxin reductase activity was 36% higher (P<0.05) in the PBS-treated SOD1−/− mice than that in the WT mice, but the genotype difference disappeared after APAP treatment. Liver GST activity was decreased (45%, P<0.05) by APAP only in the WT mice, resulting in a 1.4-fold higher (P<0.05) enzyme activity in the SOD1−/− mice than in the WT mice. Liver total SOD activity was also decreased (17%, P<0.05) by APAP in the WT mice. However, activities of liver SOD2 or glutathione reductase were not affected by either APAP or genotype.
Table 1. Effect of genotype and APAP on hepatic enzyme activities.
Mice were treated with PBS or APAP (600 mg/kg) for 5 h. Values are means±S.E.M. (n=6–10).
| WT | SOD1−/− | |||
|---|---|---|---|---|
| Substrate | PBS | APAP | PBS | APAP |
| Total SOD | 1384±55 | 1154±48* | 15.6±0.8† | 15.7±0.8† |
| (50% Formazan dye | ||||
| formation rate inhibition | ||||
| per mg of protein) | ||||
| SOD2 | 12.5±0.15 | 11.0±1.0 | 12.0±0.25 | 10.9±0.55 |
| (50% Formazan dye | ||||
| formation rate inhibition | ||||
| per mg of protein) | ||||
| GPX1 | 862±34 | 652±40* | 527±15† | 414±39† |
| (Nanomoles of | ||||
| glutathione oxidized per | ||||
| min per mg of protein) | ||||
| Thioredoxin reductase | 27.2±0.97 | 10.0±0.79* | 36.9±1.22† | 14.1±1.53* |
| (Nanomoles of | ||||
| 5′-thionitrobenzoic acid | ||||
| formed per min per | ||||
| mg of protein) | ||||
| Glutathione reductase | 36.3±2.3 | 28.5±1.7 | 38.0±1.4 | 35.3±1.4 |
| (Nanomoles of GSSG | ||||
| reduced per min | ||||
| per mg of protein) | ||||
| GST | 3926±188 | 2176±460* | 4577±493 | 5318±118† |
| (Nanomoles of S-2,4- | ||||
| dinitrophenylglutathione | ||||
| formed per min per mg | ||||
| of protein) | ||||
*The APAP-treatment effect (P<0.05) as compared with PBS treatment within genotypes.
†The genotype effect (P<0.05) within the same treatment.
DISCUSSION
It is most striking that GPX1 knockout did not potentiate and SOD1 knockout alone or together with GPX1 actually protected mice against lethality induced by 600 mg of APAP/kg. Comparatively, SOD1 exerted a much greater impact on APAP toxicity than GPX1. Following the injection of 600 mg of APAP/kg, the mortality and survival time of GPX1−/− mice were similar to those of the WT mice, and the DKO mice responded virtually the same as the SOD1−/− mice. The protection conferred by SOD1 deletion was also shown at both lower (300 mg/kg) and higher (1200 mg/kg) doses of APAP injection. Thus physiological levels of SOD1 activity were not beneficial, but detrimental for the body defence against the APAP toxicity. Apparently, our findings are in stark contrast with the reported protection against APAP overdose by overexpression of SOD1 [7] and administration of liposome-encapsulated SOD1 [29]. In addition, similar protection has also been produced by a non-peptidyl mimic of SOD2 [30] or SOD3 (extracellular-SOD) gene therapy [31].
The paradoxical roles of SOD1 overexpression and knockout in APAP toxicity may not be simply explained by its catalytic function, but rather by the impact of these extreme SOD1 activity alterations on cellular redox status. Up-regulating SOD1 [7,29] probably shifts intracellular redox balance in a direction opposite to that by knockout of SOD1, resulting in completely different body responses to APAP-mediated hepatotoxicity. Likewise, the impact of GPX1 on APAP-mediated hepatotoxicty also vary with the enzyme activity levels or forms. Whereas the GPX1 mimic ebselen [32] protected against and the GPX1 overexpression [7] potentiated the toxicity, the GPX1 knockout exerted little effect on the toxicity in the present and previous [8] studies.
The enhanced resistance of SOD1−/− mice to APAP overdose was also shown by attenuated hepatic glutathione depletion and plasma ALT activity increase. Previous studies have demonstrated that plasma ALT activity is a good indicator of APAP-induced liver injury [12] and hepatic glutathione depletion, instead of gene expression, is the key event for the acute toxicity of an APAP overdose [11]. A 70% depletion of hepatic glutathione seems to be the critical threshold to induce cell injury [33], and replenishing of cellular glutathione, especially before the challenge of APAP, is protective against the induced toxicity [8,34,35]. As hepatic glutathione in the SOD1−/− mice declined to only 40% of the baseline instead of 10% in the WT mice at the relatively early phase (5 h post-injection), these mice were better off to maintain hepatic glutathione levels above the critical threshold from oxidative injury. In contrast, elevating SOD1 activity, by either overexpression of SOD1 [7] or administration of liposome-encapsulated SOD1 [29], above physiological levels exerted no such effect on hepatic glutathione. Instead, these treatments helped in coping with secondary toxicities of APAP such as the induced lipid peroxidation [29].
The SOD1 deletion caused moderate shifts in APAP metabolism profiles. With lower plasma APAP concentrations at 3 and 5 h and a smaller total area under the plasma APAP curve than those of the WT mice, the SOD1−/− mice displayed a slightly accelerated clearance of plasma APAP. Although the overall profiles of plasma APAP-glucuronide were similar between the two genotypes, the SOD1−/− mice had higher liver activity of UGT1A6 and lower plasma APAP-glucuronide concentrations than the WT mice at 5 h after the injection. More notably, there was a 90% reduction in hepatic APAP-cysteine adducts and an 84% reduction in plasma APAP-cysteine concentration in the SOD1−/− mice compared with the WT mice at 5 h after the injection. Although the overall profiles of plasma APAP-cysteine between the two genotypes were only numerically, but not statistically different, the decreased hepatic APAP-cysteine was consistent with the attenuated hepatic glutathione depletion and the 50% reduction of liver microsomal CYP2E1 activity in the SOD1−/− mice. Because CYP2E1 is the primary enzyme to catalyse the biotransformation of NAPQI from APAP in mice [16,17], the reduced CYP2E1 activity might help attenuate APAP toxicity by producing less NAPQI and subsequently less hepatic glutathione depletion and less APAP-cysteine adducts [15,19]. With a high NADPH oxidase activity, CYP2E1 is very reactive in producing superoxide anions [36]. Because superoxide anions are the substrate of SOD1, down-regulation of CYP2E1 activity, without alteration in CYP2E1 protein expression, in the SOD1−/− mice provides direct evidence for a functional co-ordination between these two enzymes in vivo [37–39].
The inhibition of hepatic protein nitration in APAP-treated SOD1−/− mice was somewhat unexpected, as SOD1 deficiency presumably renders more superoxide anion to form peroxynitrite for protein nitration if NO is available [40]. However, previous in vitro studies have postulated that SOD1 catalyses peroxynitrite-mediated tyrosine nitration [41]. Because protein nitration has been suggested as a critical mediator of APAP-mediated hepatotoxicity [8], blocking the event in the SOD1−/− mice added extra protection against an APAP overdose [12].
The SOD1 knockout altered hepatic activities of three glutathione metabolism-related enzymes or their responses to APAP [42]. The SOD1−/− mice had a lower baseline activity of liver GPX1 [43], but higher baseline activity of liver thioredoxin reductase than the WT mice. These mice also had no loss in hepatic GST activity upon APAP treatment. Although the regulatory mechanisms for these induced changes by SOD1 deletion remain unclear, it is very important to bear in mind that these changes along with those uncharacterized shifts in the SOD1−/− mice may jointly contribute to their enhanced resistance to an APAP overdose.
In summary, our most exciting finding is that knockout of the major intracellular antioxidant enzyme SOD1 actually protected against APAP-induced hepatotoxicity. The protective mechanisms were associated with attenuated hepatic glutathione depletion, moderate shifts in APAP metabolism, down-regulation of the key APAP-metabolizing enzyme CYP2E1 and inhibition of APAP-mediated protein nitration. The functional co-ordination between SOD1 and CYP2E1 in vivo suggests that appropriate inhibition of SOD1 activity [44,45] may be used as a new strategy to treat drug toxicities associated with APAP or other P450 enzymes.
Acknowledgments
This research was supported in part by an NIH (National Institutes of Health) grant DK53018.
References
- 1.Brigelius-Flohe R., Flohe L. Is there a role of glutathione peroxidases in signaling and differentiation? Biofactors. 2003;17:93–102. doi: 10.1002/biof.5520170110. [DOI] [PubMed] [Google Scholar]
- 2.Comhair S. A., Ricci K. S., Arroliga M., Lara A. R., Dweik R. A., Song W., Hazen S. L., Bleecker E. R., Busse W. W., Chung K. F., et al. Correlation of systemic superoxide dismutase deficiency to airflow obstruction in asthma. Am. J. Respir. Crit. Care Med. 2005;172:306–313. doi: 10.1164/rccm.200502-180OC. [DOI] [PMC free article] [PubMed] [Google Scholar]
- 3.Prohaska J. R., Brokate B. Lower copper, zinc-superoxide dismutase protein but not mRNA in organs of copper-deficient rats. Arch. Biochem. Biophys. 2001;393:170–176. doi: 10.1006/abbi.2001.2470. [DOI] [PubMed] [Google Scholar]
- 4.Ho Y. S., Gargano M., Cao J., Bronson R. T., Heimler I., Hutz R. J. Reduced fertility in female mice lacking copper-zinc superoxide dismutase. J. Biol. Chem. 1998;273:7765–7769. doi: 10.1074/jbc.273.13.7765. [DOI] [PubMed] [Google Scholar]
- 5.Cheng W., Fu Y. X., Porres J. M., Ross D. A., Lei X. G. Selenium-dependent cellular glutathione peroxidase protects mice against a pro-oxidant-induced oxidation of NADPH, NADH, lipids, and protein. FASEB J. 1999;13:1467–1475. doi: 10.1096/fasebj.13.11.1467. [DOI] [PubMed] [Google Scholar]
- 6.Knight T. R., Kurtz A., Bajt M. L., Hinson J. A., Jaeschke H. Vascular and hepatocellular peroxynitrite formation during acetaminophen toxicity: role of mitochondrial oxidant stress. Toxicol. Sci. 2001;62:212–220. doi: 10.1093/toxsci/62.2.212. [DOI] [PubMed] [Google Scholar]
- 7.Mirochnitchenko O., Weisbrot-Lefkowitz M., Reuhl K., Chen L., Yang C., Inouye M. Acetaminophen toxicity. Opposite effects of two forms of glutathione peroxidase. J. Biol. Chem. 1999;274:10349–10355. doi: 10.1074/jbc.274.15.10349. [DOI] [PubMed] [Google Scholar]
- 8.Knight T. R., Ho Y. S., Farhood A., Jaeschke H. Peroxynitrite is a critical mediator of acetaminophen hepatotoxicity in murine livers: protection by glutathione. J. Pharmacol. Exp. Ther. 2002;303:468–475. doi: 10.1124/jpet.102.038968. [DOI] [PubMed] [Google Scholar]
- 9.Jollow D. J., Mitchell J. R., Potter W. Z., Davis D. C., Gillette J. R., Brodie B. B. Acetaminophen-induced hepatic necrosis. II. Role of covalent binding in vivo. J. Pharmacol. Exp. Ther. 1973;187:195–202. [PubMed] [Google Scholar]
- 10.Turvill J. L., Burroughs A. K., Moore K. P. Change in occurrence of paracetamol overdose in UK after introduction of blister packs. Lancet. 2000;355:2048–2049. [PubMed] [Google Scholar]
- 11.Ruepp S. U., Tonge R. P., Shaw J., Wallis N., Pognan F. Genomics and proteomics analysis of acetaminophen toxicity in mouse liver. Toxicol. Sci. 2002;65:135–150. doi: 10.1093/toxsci/65.1.135. [DOI] [PubMed] [Google Scholar]
- 12.Hinson J. A., Reid A. B., McCullough S. S., James L. P. Acetaminophen-induced hepatotoxicity: role of metabolic activation, reactive oxygen/nitrogen species, and mitochondrial permeability transition. Drug Metab. Rev. 2004;36:805–822. doi: 10.1081/dmr-200033494. [DOI] [PubMed] [Google Scholar]
- 13.Vermeulen N. P., Bessems J. G., Van de Straat R. Molecular aspects of paracetamol-induced hepatotoxicity and its mechanism-based prevention. Drug Metab. Rev. 1992;24:367–407. doi: 10.3109/03602539208996298. [DOI] [PubMed] [Google Scholar]
- 14.Shankar K., Vaidya V. S., Apte U. M., Manautou J. E., Ronis M. J., Bucci T. J., Mehendale H. M. Type 1 diabetic mice are protected from acetaminophen hepatotoxicity. Toxicol. Sci. 2003;73:220–234. doi: 10.1093/toxsci/kfg059. [DOI] [PubMed] [Google Scholar]
- 15.Dahlin D. C., Miwa G. T., Lu A. Y., Nelson S. D. N-acetyl-p-benzoquinoneimine: a cytochrome P-450-mediated oxidation product of acetaminophen. Proc. Natl. Acad. Sci. U.S.A. 1984;81:1327–1331. doi: 10.1073/pnas.81.5.1327. [DOI] [PMC free article] [PubMed] [Google Scholar]
- 16.Lee S. S., Buters J. T., Pineau T., Fernandez-Salguero P., Gonzalez F. J. Role of CYP2E1 in the hepatotoxicity of acetaminophen. J. Biol. Chem. 1996;271:12063–12067. doi: 10.1074/jbc.271.20.12063. [DOI] [PubMed] [Google Scholar]
- 17.Zaher H., Buters J. T., Ward J. M., Bruno M. K., Lucas A. M., Stern S. T., Cohen S. D., Gonzalez F. J. Protection against acetaminophen toxicity in CYP1A2 and CYP2E1 double-null mice. Toxicol. Appl. Pharmacol. 1998;152:193–199. doi: 10.1006/taap.1998.8501. [DOI] [PubMed] [Google Scholar]
- 18.Henderson C. J., Wolf C. R., Kitteringham N., Powell H., Otto D., Park B. K. Increased resistance to acetaminophen hepatotoxicity in mice lacking glutathione S-transferase Pi. Proc. Natl. Acad. Sci. U.S.A. 2000;97:12741–12745. doi: 10.1073/pnas.220176997. [DOI] [PMC free article] [PubMed] [Google Scholar]
- 19.Roberts D. W., Bucci T. J., Benson R. W., Warbritton A. R., McRae T. A., Pumford N. R., Hinson J. A. Immunohistochemical localization and quantification of the 3-(cystein-S-yl)-acetaminophen protein adduct in acetaminophen hepatotoxicity. Am. J. Pathol. 1991;138:359–371. [PMC free article] [PubMed] [Google Scholar]
- 20.Viera L., Ye Y. Z., Estevez A. G., Beckman J. S. Immunohistochemical methods to detect nitrotyrosine. Methods Enzymol. 1999;301:373–381. doi: 10.1016/s0076-6879(99)01101-5. [DOI] [PubMed] [Google Scholar]
- 21.Anderson A. E. Tissue glutathione. In: Greenwald R. A., editor. CRC Handbook of Methods for Oxygen Radical Research. Boca Raton, FL: CRC Press; 1985. pp. 317–320. [Google Scholar]
- 22.Habig W. H., Pabst M. J., Jakoby W. B. Glutathione S-transferases. The first enzymatic step in mercapturic acid formation. J. Biol. Chem. 1974;249:7130–7139. [PubMed] [Google Scholar]
- 23.Massey V., Williams C. H., Jr On the reaction mechanism of yeast glutathione reductase. J. Biol. Chem. 1965;240:4470–4480. [PubMed] [Google Scholar]
- 24.Holmgren A., Bjornstedt M. Thioredoxin and thioredoxin reductase. Methods Enzymol. 1995;252:199–208. doi: 10.1016/0076-6879(95)52023-6. [DOI] [PubMed] [Google Scholar]
- 25.Kim Y. C., Lee S. J. Temporal variation in hepatotoxicity and metabolism of acetaminophen in mice. Toxicology. 1998;128:53–61. doi: 10.1016/s0300-483x(98)00046-8. [DOI] [PubMed] [Google Scholar]
- 26.Hu Y., Mishin V., Johansson I., von Bahr C., Cross A., Ronis M. J., Badger T. M., Ingelman-Sundberg M. Chlormethiazole as an efficient inhibitor of cytochrome P450 2E1 expression in rat liver. J. Pharmacol. Exp. Ther. 1994;269:1286–1291. [PubMed] [Google Scholar]
- 27.Hanioka N., Jinno H., Tanaka-Kagawa T., Nishimura T., Ando M. Determination of UDP-glucuronosyltransferase UGT1A6 activity in human and rat liver microsomes by HPLC with UV detection. J. Pharm. Biomed. Anal. 2001;25:65–75. doi: 10.1016/s0731-7085(00)00491-x. [DOI] [PubMed] [Google Scholar]
- 28.Lowry O. H., Rosenbrough N. J., Farr A. L., Randall R. J. Protein measurement with the Folin phenol reagent. J. Biol. Chem. 1951;270:21659–21664. [PubMed] [Google Scholar]
- 29.Nakae D., Yamamoto K., Yoshiji H., Kinugasa T., Maruyama H., Farber J. L., Konishi Y. Liposome-encapsulated superoxide dismutase prevents liver necrosis induced by acetaminophen. Am. J. Pathol. 1990;136:787–795. [PMC free article] [PubMed] [Google Scholar]
- 30.Ferret P. J., Hammoud R., Tulliez M., Tran A., Trebeden H., Jaffray P., Malassagne B., Calmus Y., Weill B., Batteux F. Detoxification of reactive oxygen species by a nonpeptidyl mimic of superoxide dismutase cures acetaminophen-induced acute liver failure in the mouse. Hepatology. 2001;33:1173–1180. doi: 10.1053/jhep.2001.24267. [DOI] [PubMed] [Google Scholar]
- 31.Laukkanen M. O., Leppanen P., Turunen P., Tuomisto T., Naarala J., Yla-Herttuala S. EC-SOD gene therapy reduces paracetamol-induced liver damage in mice. J. Gene Med. 2001;3:321–325. doi: 10.1002/jgm.194. [DOI] [PubMed] [Google Scholar]
- 32.Li Q. J., Bessems J. G. M., Commandeur J. N. M., Adams B., Vermeulen N. P. E. Mechanism of protection of ebselen against paracetamol-induced toxicity in rat hepatocytes. Biochem. Parmacol. 1994;48:1631–1640. doi: 10.1016/0006-2952(94)90208-9. [DOI] [PubMed] [Google Scholar]
- 33.Lores Arnaiz S., Llesuy S., Cutrin J. C., Boveris A. Oxidative stress by acute acetaminophen administration in mouse liver. Free Radical Biol. Med. 1995;19:303–310. doi: 10.1016/0891-5849(95)00023-q. [DOI] [PubMed] [Google Scholar]
- 34.Mitchell J. R., Thorgeirsson S. S., Potter W. Z., Jollow D. J., Keiser H. Acetaminophen-induced hepatic injury: protective role of glutathione in man and rationale for therapy. Clin. Pharmacol. Ther. 1974;16:676–684. doi: 10.1002/cpt1974164676. [DOI] [PubMed] [Google Scholar]
- 35.Smilkstein M. J., Knapp G. L., Kulig K. W., Rumack B. H. Efficacy of oral N-acetylcysteine in the treatment of acetaminophen overdose. Analysis of the national multicenter study (1976 to 1985) N. Engl. J. Med. 1988;319:1557–1562. doi: 10.1056/NEJM198812153192401. [DOI] [PubMed] [Google Scholar]
- 36.Kukielka E., Cederbaum A. I. Ferritin stimulation of lipid peroxidation by microsomes after chronic ethanol treatment: role of cytochrome P4502E1. Arch. Biochem. Biophys. 1996;332:121–127. doi: 10.1006/abbi.1996.0323. [DOI] [PubMed] [Google Scholar]
- 37.Morgan E. T., Li-Masters T., Cheng P. Y. Mechanisms of cytochrome P450 regulation by inflammatory mediators. Toxicology. 2002;181–182:207–210. doi: 10.1016/s0300-483x(02)00283-4. [DOI] [PubMed] [Google Scholar]
- 38.Pahan K., Smith B. T., Singh A. K., Singh I. Cytochrome P-450 2E1 in rat liver peroxisomes: down regulation by ischemia/reperfusion-induced oxidative stress. Free Radical Biol. Med. 1997;23:963–971. doi: 10.1016/s0891-5849(97)00017-8. [DOI] [PubMed] [Google Scholar]
- 39.Zangar R. C., Davydov D. R., Verma S. Mechanisms that regulate production of reactive oxygen species by cytochrome P450. Toxicol. Appl. Pharmacol. 2004;199:316–331. doi: 10.1016/j.taap.2004.01.018. [DOI] [PubMed] [Google Scholar]
- 40.Bourdi M., Masubuchi Y., Reilly T. P., Amouzadeh H. R., Martin J. L., George J. W., Shah A. G., Pohl L. R. Protection against acetaminophen-induced liver injury and lethality by interleukin 10: role of inducible nitric oxide synthase. Hepatology. 2002;35:289–298. doi: 10.1053/jhep.2002.30956. [DOI] [PubMed] [Google Scholar]
- 41.Ischiropoulos H., Zhu L., Chen J., Tsai M., Martin J. C., Smith C. D., Beckman J. S. Peroxynitrite-mediated tyrosine nitration catalyzed by superoxide dismutase. Arch. Biochem. Biophys. 1992;298:431–437. doi: 10.1016/0003-9861(92)90431-u. [DOI] [PubMed] [Google Scholar]
- 42.Kozer E., Evans S., Barr J., Greenberg R., Soriano I., Bulkowstein M., Petrov I., Chen-Levi Z., Barzilay B., Berkovitch M. Glutathione, glutathione-dependent enzymes and antioxidant status in erythrocytes from children treated with high-dose paracetamol. Br. J. Clin. Pharmacol. 2003;55:234–240. doi: 10.1046/j.1365-2125.2003.01723.x. [DOI] [PMC free article] [PubMed] [Google Scholar]
- 43.Levy M. A., Tsai Y. H., Reaume A., Bray T. M. Cellular response of antioxidant metalloproteins in Cu/Zn SOD transgenic mice exposed to hyperoxia. Am. J. Physiol. Lung Cell. Mol. Physiol. 2001;281:L172–L182. doi: 10.1152/ajplung.2001.281.1.L172. [DOI] [PubMed] [Google Scholar]
- 44.Ralph G. S., Radcliffe P. A., Day D. M., Carthy J. M., Leroux M. A., Lee D. C., Wong L. F., Bilsland L. G., Greensmith L., Kingsman S. M., et al. Silencing mutant SOD1 using RNAi protects against neurodegeneration and extends survival in an ALS model. Nat. Med. 2005;11:429–433. doi: 10.1038/nm1205. [DOI] [PubMed] [Google Scholar]
- 45.Raoul C., Abbas-Terki T., Bensadoun J. C., Guillot S., Haase G., Szulc J., Henderson C. E., Aebischer P. Lentiviral-mediated silencing of SOD1 through RNA interference retards disease onset and progression in a mouse model of ALS. Nat. Med. 2005;11:423–428. doi: 10.1038/nm1207. [DOI] [PubMed] [Google Scholar]


