

Abstract
Comprehensive verification of the intricate dose distributions associated with advanced radiation treatments is now an immediate and substantial problem. The task is challenging using traditional dosimeters because of restrictions to point measurements (ion chambers, diodes, TLD, etc.) or planar measurements (film). In essence, rapid advances in the technology to deliver radiation treatments have not been paralleled by corresponding advances in the ability to verify these treatments. A potential solution has emerged in the form of water equivalent three dimensional (3D) gel-dosimetry. In this paper we present basic characterization and performance studies of a prototype optical-CT scanning system developed in our laboratory. An analysis of the potential role or scope of gel dosimetry, in relation to other dosimeters, and to verification across the spectrum of therapeutic techniques is also given. The characterization studies enabled the determination of nominal operating conditions for optical-CT scanning. “Finger” phantoms are introduced as a powerful and flexible tool for the investigation of optical-CT performance. The modulation-transfer function (MTF) of the system is determined to be better than 10% out to 1 mm-1, confirming sub-mm imaging ability. System performance is demonstrated by the acquisition of a 1×1×1 mm3 dataset through the dose distribution delivered by an x-ray lens that focuses x rays in the energy range 40-80 KeV. This 3D measurement would be extremely difficult to achieve with other dosimetry techniques and highlights some of the strengths of gel dosimetry. Finally, an optical Monte Carlo model is introduced and shown to have potential to model light transport through gel-dosimetry systems, and to provide a tool for the study and optimization of optical-CT gel dosimetry. The model utilizes Mie scattering theory and requires knowledge of the variation of the particle size distribution with dose. The latter was determined here using the technique of dynamic-light-scattering.
Keywords: gel dosimetry, optical CT, polymer gel, optical Monte Carlo, 3D dosimetry, Mie scattering, dynamic light scattering
I. INTRODUCTION
Modern radiation therapy is characterized by treatment planning that is more elaborate and customized, and treatment delivery that is more precise and complex. These trends are discernable in new treatment techniques in the areas of Intensity-Modulated-Radiation-Therapy(iMRT),1 brachytherapy,2 and radiosurgery.3 The potential benefits are greatly desirable, including the reduction of side effects in normal tissue and the possibility of dose escalation to the tumor with an associated higher probability of cure.4 A significant challenge has arisen, however, because the rapid advances in the technology to deliver radiation treatments have not been paralleled by corresponding advances in the ability to verify these treatments. At present, clinics use traditional dosimeters to verify and commission complex new 3D delivery techniques. Typically in IMRT, the absolute dose is verified at a central point using an accurate dosimeter(e.g., an ion chamber), and the relative distribution is verified in selected planes utilizing less accurate film measurement. The imperfections of this method are significant. A comprehensive verification demands a laborious number of film measurements, which present, at best, a partial sampling of the distribution. Such effort is rarely maintained in practice. Furthermore, accuracy is compromised because of the nonlinear response of film to energy and orientation of irradiation.5 Radiochromic film6 has better energy response characteristics but also has low sensitivity and still presents a partial sampling. Comprehensive treatment verification is a key factor enhancing the quality and accuracy of clinical treatment, articulating the urgent need for a truly 3-D dosimetry system.
The challenge to clinical dosimetry is more fundamental than outlined above. A core issue is that different clinical treatments demand different specifications from a dosimeter. Brachytherapy, utilizing low-energy gamma sources, demands high water equivalence and high spatial resolution. IMRT often requires high spatial resolution over larger volumes. Radiosurgery demands still higher spatial resolution, and a higher dynamic range, but often over much smaller volumes. Many such examples are possible. To summarize, a dosimeter must satisfy a multifaceted web of specifications to be applicable across the spectrum of clinical treatments. This web is illustrated in Fig. 1. A rating of zero indicates that a dosimeter has no functionality for that specification; a rating of 5 indicates highest relative functionality. An ideal dosimeter with global application would rate 5 on all radial axes. A welter of traditional dosimeters stretch to different parts of the web, but none covers all. Present optical-CT gel dosimetry (labeled gel) comes closest to the ideal, and it is the belief of many gel-dosimetry researchers that the optimized technique (labeled gel_*) can come closer still.
FIG. 1.
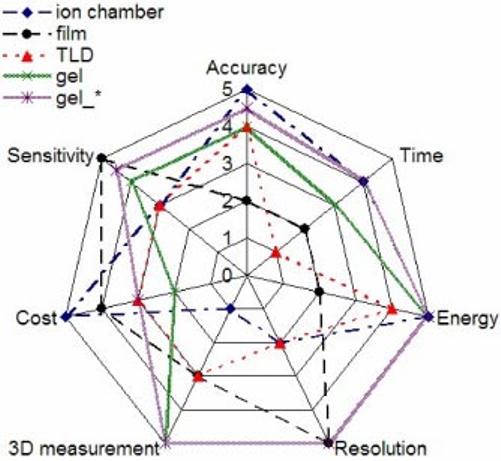
Spider plot of prominent dosimetry specifications common to all radiation therapies. Radial axes correspond to the different specifications and exhibit a scale from 0-5. The performance of a dosimeter(or the requirements of a particular treatment technique)is rated for each specification by a number 0-5 (0=poor and 5=high). An ideal dosimeter would thus track along the outside “5” spider track.
The axes of Fig. 1 are relative, and the question arises as to what performance characteristics a 3-D dosimetry system must exhibit to enable comprehensive verification across the spectrum of treatments outlined above. That is, how to define the outer “5” spider track. Van Dyke7 recommended a 5% overall accuracy in dose delivered to a patient, derived from observations that clinically detectable changes accompany variations in an absorbed patient dose of >7%. This goal is consistent with the International Commission on Radiation Units and Measurements(iCRU) Report No. 24.8 Further recommendations were that the relative dose distribution should be determined to within 2.5%. A spatial accuracy of 5 mm was recommended for conventional radical radiation treatments, although this was reduced for stereotactic procedures. Jordan9 included the comment that the ideal 3-D do-simeter should have sufficient accuracy and resolution to provide a gold standard for comparison with the best available dose calculation algorithms. While this concept has clear merit it is hard to achieve because the algorithms continually evolve. The advent of accurate and fast Monte Carlo dose calculation algorithms have prompted discussions on whether a new 3-D measurement tool is required at all.10 In reality, no matter how accurately one can simulate a virtual world, the real world contains factors and variables impossible to fully implement in a model(e.g., mechanical imperfections and implementation errors).
Given the trend for increasing conformity and smaller margins, it is likely that the criteria outlined above will become ever more stringent. This led Oldham et al.11 to propose the ideal 3-D dosimetry system should meet the RTAP(1,60,3,1) criteria (Resolution 1×1×1 nm, Time 60 min imaging, Accuracy within 3%, and Precision within 1%). The RTAP(1,60,3,1) was developed with reference to the verification of radiosurgery dose distributions, where the resolution requirements are most challenging. The RTAP concept is broadly consistent with those of Jordan and Van Dyke, but has limitations in a wider context, as the time constraint is arbitrary and there is no explicit account of water equivalence or the other parameters in Fig. 1. Water equivalence is a critical specification for a dosimetry system to have wide applicability, particularly at lower photon energies where photoelectric effects are significant. Here we maintain the RTAP is a convenient approximation for the ideal specification of a 3-D gel dosimeter with the addition of water equivalence. At present, a relative dosimetry system that can achieve RTAP(1,60,3,1) across the spectrum of treatments is not available. However, recent gel dosimetry systems (discussed below) show real promise.
Three principle categories of gel dosimeters exist, polyacrylamide (PAG) gels,12 Fricke gels,13 and radiochromic gels,14 and two methods of scanning the gels, magnetic-resonance (MR) imaging,15 and optical-computer-tomography(optical CT).16,14,11 To date, most gel dosimetry has utilized MR scanning, which is expensive and can be susceptible to subtle sources of error (De Deene et al.17-19). These errors originate largely in the technical challenges of controlling magnetic field uniformity and gradients with sufficient precision, and in temperature control associated with rf energy deposited in the gel during MR imaging.17 For MR measurements requiring high accuracy and high spatial resolution, these errors remain problematic to achieving the low uncertainty associated with standard dosimeters(e.g., ion chambers at 3%). Great interest was therefore generated by the introduction of an alternative method of imaging gel dosimeters. Gore et al.20 proposed optical-CT scanning of PAG gels, an approach analogous to first-generation x-ray CT with the x-ray source replaced by a visible laser and the x-ray detector replaced with a light-sensitive photodiode. This approach exploits the fact that polymerized regions of gel contain polymer microparticles that scatter light. The effect is that PAGs becoming increasingly opaque with increasing polymerization and therefore increasing dose. Maryanski et al.21 demonstrated that this opaqueness is due to scattering of light in the PAG rather than to absorption. As the laser is stepped across the water bathĉontaining the PAG dosimeter), the photodiode measures the amount of transmitted light, which varies in relation to the line integral of the polymerized gel in the laser beam. A succession of line integral light transmission measurements are made corresponding to projections of multiple views through the gel. Standard inverse radon CT reconstruction algorithms can then reconstruct the projected transmission profiles to generate maps of optical attenuation coefficients inside the gel dosimeter. Gore et al.22 reported that doses in the range 0-10 Gy could be measured with an accuracy of better than 5% with a spatial resolution of 2×2×1 mm.
First generation optical-CT scanners were also constructed by Kelly et al.,14 utilizing radiochromic gel, and Oldham et al.11 These works have demonstrated that optical-CT has the potential to propel the accuracy of gel dosimetry to meet the RTAP(1,60,3,1) criteria as well as the other factors in the spider plot. Many questions concerning optical-CT gel dosimetry remain unanswered. These include the following: can an optimized optical-CT gel-dosimetry system achieve the RTAP(1,60,3,1) criteria across the spectrum of treatments(i.e., the outer “5” track in Fig. 1), and what are the optimum acquisition parameters, dose-level, scanning technique, wavelength, etc. At the heart of these questions is the issue of how to optimize the optical-CT technique for accuracy and efficiency while maintaining high spatial resolution in three dimensions. In this paper we begin to address this question by conducting basic investigations into the influence of a variety of acquisition parameters on optical-CT performance. Global system performance is demonstrated by the acquisition of a 1×1×1 mm3 dataset through the distribution delivered by an x-ray lens that focuses x rays in the energy range 40-80 KeV. Characterization of the lens was performed for incorporation into a small-animal-radiation-research platform.23 Effective optimization of optical-CT ultimately requires the development and utilization of a model to study the fundamentals of light transport through the gel and scanning system and the transfer of signal and noise through to the reconstructed 3-D image. As a preliminary step in this direction, an optical Monte Carlo model is introduced and preliminary simulations are presented to indicate potential to model and optimize optical-CT gel dosimetry.
II. MATERIALS AND METHODS
Initial investigations focused on fundamental characterization of system performance including the influence on image quality of key acquisition parameters(Sec. III A). Measurements were made with our prototype optical-CT scanner presented in Oldham et al.,11 but significantly modified and rebuilt to enable automated acquisition for multiple slices through the gel dosimeter (Fig. 2). This was achieved utilizing X-95 structural mounts supporting a vertical translation stage that transports the entire rotation stage suspending the gel dosimeter vertically in the optical bath(Newport Corp., 1791 Deere Ave., Irvine CA 92606). Motion control was achieved utilizing NI-DAQ PC-LPM-16 ADC hardware(National Instruments Corp., 6504 Bridge Point Parkway, Austin, TX 78730). Customized amplification electronics were built utilizing the LT1055 operational amplifier. A typical optical-CT scan was performed as follows(a more elaborate description is given in Ref. 11). First optical matching between the fluid in the water bath and the unirradiated gel was achieved by varying the refractive index to minimize the deflection of the laser beam under translation across the do-simeter. This procedure was performed in about 10 min by adding progressive amounts of water-soluble immersion liquid with a high refractive index (n=1.45 at 25 °C at 589 nm) (Cargille Laboratories Inc., 55 Commerce Rd. Cedar Grove, NJ 07009-1205). A projection scan was then taken where the laser was incrementally stepped(e.g., 1 mm increments) across the dosimeter. The dosimeter was incrementally rotated between projections(e.g., by 1.8°) and the procedure repeated until projection data was acquired over 180°. The total scanning time was typically 6 min per plane for an 8 cm diam dosimeter. The optical-CT acquisition software(inhouse C++ code) was configured to return the ratio of the laser intensity at the reference diode to the field diode to enable correction for laser drift. Two-dimensional images of the optical attenuation coefficients (μ) in the gel were obtained from the projection data utilizing the inverse-radon transform algorithm implemented in MATLAB (The Math-Works, Inc., 3-Apple Hill Drive, Natick, MA 01760-2098).
FIG. 2.
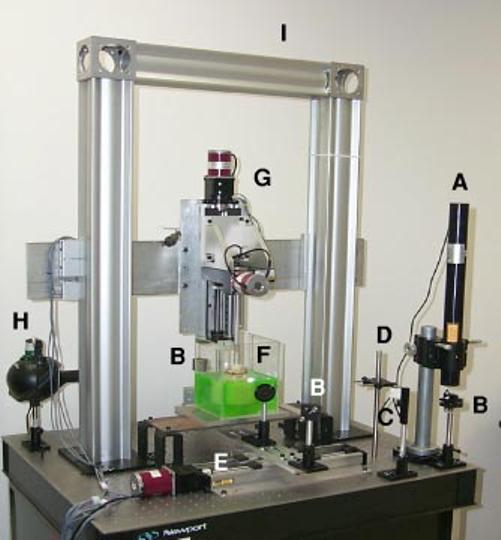
Modified optical-CT scanner incorporating automated multislice acquisition. Components are A=laser, B=mirrors, C=beamsplitter, D=reference diode, E=linear “stepping” translation stage, F=optical-bath containing immersed gel-dosimeter, G=vertical translation stage mounting rotation stage and suspending gel-dosimeter in the optical-bath, H=field photodiode, and I=X95 support. The two mirrors (B)on opposite sides of the water-bath (F)translate the laster translate the laser beam across the optical bath for acquisition of each projection.
The characterization of the influence of key acquisition parameters on system performance was performed by comparing repeat optical-CT scans of special “finger-phantoms,” where the relevant acquisition parameters was varied. Finger phantoms (Fig. 3) consisted of clear gelatin gel containing variably attenuating “fingers” formed by setting test tubes in the gel and then carefully removing them to leave a finger depression mold that was then filled with the remainder of gelatin doped with controlled amounts of (blue) attenuating dye. The flask itself was made of PET plastic. The key to obtaining seamless fingers(important for sensitive optical scanning) was to add hot water to the test tubes for ∼20 s prior to removal, to melt and lubricate the gel immediately in contact with the test tube. In addition, the depressions were filled with gel that was just warm enough to maintain a liquid phase to create a seamless join. Care was taken to avoid adding gel that was too hot, as the finger depression would then distort due to melting.
FIG. 3.
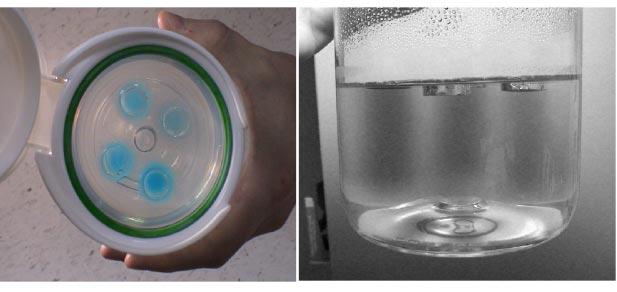
Photograph of a 12 cm diameter finger phantom containing four variably attenuating blue gelatin fingers. Test-tube depressions in a gel can be filled with solutions(or gel), that have a modified refractive index, attenuation, or scattering power. Here, the blue fingers were gelatin gel that had been dyed with precise concentrations of blue food coloring to effect controlled variations in the attenuation coefficients of each finger. This approach is a versatile method to create known optical conditions to validate the optical-CT technique.
The modified optical-CT scanner provides greater flexibility in image acquisition parameters compared to the previous prototype. Key acquisition or operational parameters include(i) the number of ADC samples, NADC read , averaged for each line integral of laser attenuation;(ii) the spatial increment, dx, between line integrals in each projection; and (iii) the angular increment, dθ , between projections. Each of these parameters affects acquisition time as well as image quality. Images of the finger phantoms were acquired at various settings of these acquisition parameters to examine the effect on image noise, accuracy, spatial resolution, and artifacts. In this manner a nominal set of operating conditions was determined for subsequent investigations.
The accuracy of optical-CT reconstructed attenuation coefficients was determined by creating two finger phantoms, each containing four fingers of varying optical attenuation achieved by adding small amounts of blue food coloring dye (Sec. III B). The optical attenuation of the fingers were then measured by optical-CT scanning using the nominal operating conditions. An independent measurement of the optical attenuation coefficient was made by placing excess gel from each finger into 1 cm pathlength optical cuvettes that were then placed in a spectrophotometer [Shimadzu UV-265(Shimadzu America, 7102 Riverwood Drive, Columbia, MD 21046]. Spectrophotometric measurements of attenuation coefficient were then directly compared with the mean pixel value within each finger determined from optical-CT.
The spatial-frequency response characteristics of the optical-CT system was objectively quantified by measurement of the modulation transfer function (MTF)12,13(Sec. III C). A uniform, unirradiated, cylindrical gelatin gelphantom (diameter 8 cm) was prepared in which a 0.25 mm diam steel wire was suspended longitudinally. Images of the phantom were acquired in which the laser was stepped at 0.1 mm increments between each line integral, and the angular increment between projections was 1°. A Hanning window was employed in the reconstruction.
Global system performance is demonstrated by application to diffusion measurement(Sec. III D) and the 3-D measurement of dose delivered by an x-ray lens(Sec. III E). It is well known that small molecules can diffuse through the gelatin over time.24 The diffusion of attenuating dye molecules from regions of high concentration(i.e., the fingers in Fig. 3) into regions of low concentration(surrounding undyed gel) was studied by taking repeat optical-CT scans of a single finger phantom over a 4 h period. The x-ray lens is illustrated in Fig. 4 [OSMIC Inc., 1900 Taylor Rd., Auburn Hills, MI 48326(www.osmic.com]. For correct operation, the lens is positioned 17 cm from the x-ray source (dependent on the energy of the beam). The lens is designed to produce a full-width-half-maximum (FWHM) of 1 mm at the focus with a depth of field of 5 cm. It had been sent to several laboratories for evaluation during which time it had sustained some damage, resulting in suboptimal focus. The lens was used to irradiate a cylindrical BANG gel dosimeter of diameter and height ∼8 cm (MGS Research, P.O. Box 581 Guildford, CT 06437). Optical-CT scans were then taken using the nominal operating conditions that produced a 3-D image dataset with a resolution of 1×1×1 mm3 through the scanned region of the gel dosimeter. A second irradiation was given without the lens, with the unfocused beam collimated to a 5 mm circular field utilizing a lead absorber.
FIG. 4.

Prototype x-ray lens from Osmic Inc. The lens emits focused x rays from 40-80 keV.
The desire to further optimize optical-CT gel dosimetry led to the consideration of how to simulate and model the entire process, which would enable the efficient study of permutations of a large number of variables(Sec. III F). The construction of such a model is a significant undertaking, and so a commercial optical Monte Carlo software “LightTools” was used, manufactured by Optical-Research-Associates (optical Research Associates, Pasadena, CA). LightTools contains functionality for creating arbitrary geometrical arrangements of objects(including immersion and cementing operations) and simulating large numbers of photon tracks through an optical system (histories). Each photon track is “nonsequential,” in that the probability of a certain interaction is applied to the history at each interaction point in the standard Monte Carlo manner. The LightTools software was used to simulate light transport in a simple configuration [Fig. 5(a)], where a laser was incident on a 32 mm thick slab of PAG gel irradiated with a 5×5 cm square field with 6 MV radiation. Judicious placement of buildup material around the flask during irradiation yielded a near-uniform dose along the central axis across the flask. The laser spot size exiting the gel is significantly broadened by light scattering within the gel. An identical physical geometry was implemented on an optical bench to allow independent verification by physical measurement [Fig. 5(b)]. The measurement was performed by stepping a highly collimated photodiode (representing a point detector) across the flask to record the profile of the laser beam on exit of the gel at the measurement plane. A sensitive comparison was therefore possible between the modeled and measured exit laser profile after scattering.
FIG. 5.
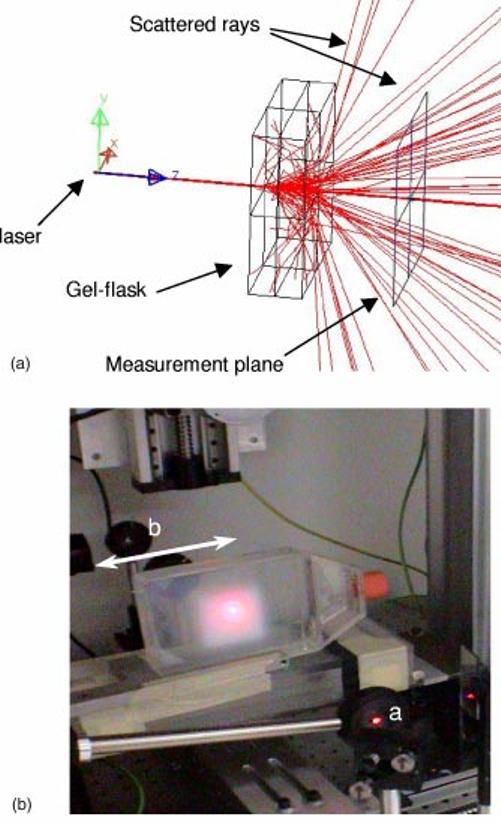
(a)Illustrative LightTools simulation of 200 photon tracks from a 632 nm laser incident on a 32 mm thick slab of PAG gel, which has been irradiated to a significant dose(Wire frame box). Scattered rays hitting the sides of the gel are automatically terminated. The laser spot size at the measurement plane is significantly broadened by scattering inside the gel. The number of histories is limited for display purposes. (b)Measurement geometry matching the simulation in(a). The laser is collimated at(a) and then incident orthogonally on the gel flask, where it is observed to scatter in the polymerized gel region (5 cm×5 cm extent). A collimated photodiode point detector (b)translates behind the dosimeter as indicated, to measure the cross-plane profile of the laser beam 3.5 cm after exiting the gel.
Monte Carlo simulations and corresponding physical measurements were made of the laser profile exiting three identical gel dosimeters irradiated to different doses: 1.5, 4, and 6 Gy, representing low, medium, and high dose, respectively. The aim was to investigate whether LightTools could accurately model laser broadening and scattering in a simple gel-dosimetry configuration. The default scattering model in LightTools is Mie theory,25 which provides analytic solutions for scattering in a medium containing isotropic, homogenous, and spherical particles. This is a first-order approximation for PAG dosimeters, where the input parameters for the Mie model are the radius of the particles, the number density and refractive index. Polymer particle size distributions for PAG gel (BANG1 formulation) given different doses were measured by dynamic-light scattering (DLS). The DLS measurement was made as follows. 5 g of the irradiated gel were added to 20 g of deionized water and the mixture heated to 50 °C with stirring. After the sample had completely dispersed/suspended, several drops of the dispersed sample were again diluted with 20 g of deionized water in a 30 ml beaker, which was then sonicated (Bronsonic 200) for 10 min. This sample was then placed into a Microtrac UPA Particle Size Analyzer(UPA 150, Model # 9240-4-10-1, 0592-33992-001-U1089). The sample concentration was adjusted to give a loading index of 0.5-1.0 (the loading index is an instrumental parameter used to obtain measurable scattering signal from the sample). An average value from three runs of 300 s was used to estimate the particle size distribution. The refractive index of polymer particles is taken as acrylic at 1.53 (the default value in LightTools software at 632 nm) and that of the BANG gel as 1.36.26 An estimation of number density requires the calibration of the DLS technique using monodisperse particles of known size. This technique was beyond the scope of these preliminary measurements, and so number density values were determined by trial and error to match the observed scattered laser-light profiles on exit of the gel-dosimeters. For each of the measured exit laser profiles from gel at 1.5, 4, and 6 Gy, the corresponding Monte Carlo simulations were run using the effective maximum scattering particle size and a range of number density values until the modeled profile most closely matched the measured profile. The laser was simulated as a cylindrical cavity [Fig. 5(a)], where the flat end of the cylindrical source farthest from the gel emits parallel rays in-wardly that traverse the laser cavity, passing through the other flat end, en route to strike the gel dosimeter. The latter flat end is 100% transmissive but applies a Gaussian scattering function to model the divergence and scattering of the laser light emitted from the cavity.
III. RESULTS AND DISCUSSION
A. Fundamental characterization of system performance
The influence of key acquisition parameters on image quality, and susceptibility to image artifacts, is demonstrated in Fig. 6. Figure 6 contains a selection from many optical-CT scans taken of the same finger phantom, where key acquisition parameters were varied. The phantom contained a highly attenuating finger to enable the investigation of susceptibility to “missing data” streak and sampling artifacts. Each pair of images(a,b; c,d; and e,f) correspond to the lowest and highest quality images for a particular acquisition parameter, dΘ , dx, and NADC read , respectively (described in Sec. II). A comparison of the three image-pairs yields interesting observations. First, image quality is seen to be most significantly compromised by inadequate sampling of the ADC (NADC read). In Fig. 6(e)) excessive streak artifacts and con-tour distortion is observed, with dramatic improvement when NADC read was increased to 100. Figures 6(a)) and 6(b) show the least difference, indicating image quality to be relatively insensitive to the rotational increment or the number of projections (Nproj). A slight reduction in streak artifacts and lower image noise is observable. Perhaps the cleanest image is Fig. 6ĉ), where a low noise, artifact-free image is apparently achieved, despite a very course (dx=2 mm) stepping of the laser across each projection. This interpretation is mis-leading, however, as closer inspection reveals that the reconstructed finger sizes are too small, and the lack of streak artifacts is a result of the laser steps failing to intersect the most attenuating paths. The latter point is also the reason that the fine detail of the circular walls of the flask is almost completely lost. In contrast, Fig. 6(d), incorporating very fine stepping (dx=0.5 mm) shows the clearest view of the walls of the flask. Slight streak artifacts are also apparent where the laser does reach the lines of highest attenuation. The effect of translation and rotation sampling on noise and spatial resolution can be understood from basic considerations of signal and noise transfer in CT reconstruction.27
FIG. 6.

Sample optical-CT images of the same finger phantom, illustrating the effect of varying key acquisition parameters on image quality: ADC averaging (NADC read), rotational increment between projections (dtheta=360/Nprojections), and linear step size between line integrals (dx). Figures are presented in pairs corresponding to the lowest and highest quality images for a particular acquisition parameter (further details given in the main text). Units are attenuation coefficient (mm-1) relative to the optically matched bath.
A more quantitative analysis of the images in Fig. 6, and other optical-CT runs, is shown in Fig. 7, where fingers are numbered according to increasing attenuation. Figures 7(i)-(iii) show the standard deviations(stdev) on mean pixel values in the central regions of each finger, and Figs. 7(iv)-(vi) show the mean values. In Figs. 7(i)-(iii) lower stdev’s, corresponding to lower image noise, is generally consistent with higher values for NADC read, smaller dθ , and smaller dx. Consistent with the interpretation above, the greatest improvement in stdev was observed for even modest increases of NADC read . A reduction in stdev of nearly a factor of 10 is observed between NADC read=1 and NADC read=100. Figure 7(iv) suggests that part of this error is caused by artificial depression of the photodiode response for the first few samplings, leading to artificially high attenuation coefficient pixel values. Aside from the gross influence of artifacts, Figs. 7(iv)-(vi) indicates the accuracy of mean pixel values was independent of the key acquisition or operational parameters. The conclusion from multiple acquisitions was the selection of a nominal set of operating conditions consisting of NADC read=50, dx=1 mm, and dΘ =1.5°, which represented an optimal trade-off between time and image quality. The nominal operating condition was adopted for subsequent studies unless otherwise noted.
FIG. 7.

Quantitative analysis of the optical-CT images presented in Fig. 6, together with other scans not shown. Fingers are numbered according to increasing attenuation. Figures i, ii, and iii are standard deviations in the reconstructed pixel value for small regions located centrally in the fingers. Figures iv, v, and vi are mean pixel values in the same regions. Pixel values are attenuation coefficients relative to the matched bath in mm-1.
Characterization of the photodiode detection hardware included signal linearity, signal-to-noise ratio(SNR), temporal response, and temporal stability. Using a graded neutral density filter, photodiode response was measured as a function of laser intensity and found to be linear within a few percent. The response at the upper end of the signal range is limited by the amplifier electronics and (12-bit) ADC. The SNR of photodiode response depended on RF noise, which was minimized by good motor control software, and inherent noise introduced by fluid in the water-bath. The dynamic range of the system both with and without the water-bath was (1020 ±15):1 and 4000:1, respectively. System temporal response was found to be reasonably fast, with less than 1% residual signal measured on the falling edge(and better than 99% full signal on the rising edge) of a step input function as the laser beam was switched off and on using a shutter. Finally, following a 30-40 min warm-up period, the system exhibits temporal stability of ∼1% drift over a period of at least 1 h.
B. Verification of optical-CT reconstructed attenuation coefficients
The optical-CT image of a finger phantom, with finger regions ranging in attenuation from ∼0.21 to ∼0.04 mm-1, is shown in Fig. 8(a)). Optical-CT determined attenuation coefficients in the fingers are compared with those measured by the spectrophotometer in Fig. 8(b). Results agreed well, with a linear fit between the two, showing a slope of ∼0.97 ± 0.03. The optical-CT system appears capable of measuring absolute attenuation coefficient within 3%-4%. The noise in these measurements may be inflated by slight dilutions of the gel comprising the finger when it is poured into the finger depression, and uncertainties in the spectrophotometric readings.
FIG. 8.

(a)Axial optical-CT scan of a finger phantom containing fingers of varying optical attenuation. (b)A comparison of the attenuation coefficient measured in optical-CT versus spectrophotometer values. The close agreement and near unity slope verify that the system is capable of measuring the absolute attenuation coefficient to within 3%-4%.
C. Spatial resolution of the optical-CT system
The high-resolution optical-CT scan of the wire phantom is shown magnified in the region about the 0.254 mm wire in Fig. 9(a)). The full-width at half-maximum of the reconstructed wire was 0.66 mm, which corresponds to the manufacturer-specified width of the laser beam (0.7 mm). The MTF was computed by Fourier transform of the area-normalized Radon transform of the images, and the results are shown in Fig. 9(b). There is very little appreciable “low-frequency drop”(associated with long-range scatter), since the measurement was performed in a clear gel. The MTF is greater than 10% out to approximately 1 mm-1, consistent with the notion that the system provides images with sub-mm spatial resolution.
FIG. 9.

Measurement of spatial resolution for the optical-CT system.(a)A magnified view of the optical-CT image of a 0.25 mm diameter steel wire (black circle superimposed to illustrate the wire cross section), showing the full-width at half-maximum of 0.66 mm (b)The MTF curve for the reconstruction in (a), showing better than 10% MTF out to 1 mm-1. The MTF was corrected for the diameter of the wire by dividing by the Fourier transform of the wire circ function.
D. Investigation of temporal stability (diffusion) in gel phantoms
The results of the 4 h repeat optical-CT study of a finger phantom is illustrated in Fig. 10. In Fig. 10(a), the defining edge of each finger(or cell) region is observed to become blurred over time as the dye diffuses into the surrounding gel. In Fig. 10(b), the pixel value in three regions of Cell #1 are shown(Nominal attenuation ∼0.21 mm-1). Pixel values in the first region, near the center of the cell, are observed to be stable to within 0.6% over 4 h. Values in the second “shoulder” region are at 90% of the central value at time zero and are found to decay by ∼16% over 4 h. In the toe region corresponding to 10% of the central value at time zero, values increase by ∼62% as dye diffuses into surrounding regions over the 4 hours. From these observations the diffusion of dye concentration was estimated at a rate of ∼0.2-0.5 mm per hour at room temperature. These measurements demonstrate the sensitivity of the optical-CT system in examining such subtle effects and highlight a possible time-critical aspect of using optical-CT for accurate dosimetry with high spatial resolution. Small negative pixel values in Fig. 10 are attributed to light scattering in the water-bath and gel-dosimetry system.
FIG. 10.

Variation in optical-CT profiles through the fingers in Fig. 8(a)over a 4 h period.(a)Cross-plane profiles through the four fingers for scans acquired at time zero(solid curves) and t=4 h (dotted curves). (b)Plots of the image pixel value in the central, shoulder, and toe regions of Cell #1 versus time.
E. Application of gel dosimetry to study dose from an x-ray-lens
Multiple axial planes at 1 mm separation through the 8 cm diameter gel dosimeter after irradiation with the x-ray lens (Fig. 4) are shown in Fig. 11. The lens irradiation is incident in the upper right of the flask and is observed to focus as it penetrates the gel. The degree of focusing is illustrated by the comparison of the high-resolution optical-CT scans in Fig. 12, where the lens distribution is compared with the unfocused kV beam collimated to 5 mm diameter. Three optical orientation marks (three lines drawn with a black pen) are visible in the transaxial images as three dots located on the perimeter of the flask. The images shown are in units of an optical-attenuation coefficient (mm-1) and are proportional to dose. The conversion to dose could be made through utilization of a calibration curve determined at this energy. Although not performed in this work(a relative distribution was adequate for our characterization of the lens), such calibrations have been reported in the literature.28 The 3-D measurement of the focused lens distribution would be extremely difficult to achieve with any other dosimetry technique and highlights some of the strengths of gel dosimetry.
FIG. 11.

Optical-CT images of the relative dose distribution delivered in a PAG after irradiation by focused photons (40-80 KeV)emitted by the x-ray lens (shown in Fig. 4). The cylindrical gel flask is ∼8 cm in diameter and the slices are 1 mm apart. The in-plane resolution is 1×1 mm2. The comprehensive 3D measurement presented here would be very difficult to achieve with conventional dosimeters because of the low energy of the radiation and the small dimensions of the field.
FIG. 12.

Optical-CT images of reconstructed attenuation coefficients in 120 kVp irradiations. In the left image the unfocused x-ray beam is collimated to 5 mm diameter utilizing a lead sheet. In the right image, the x-rays have been focused to a point in the gel dosimeter utilizing the x-ray lens in Fig. 4.
F. Model to simulate light transport through gel dosimeters
The Monte Carlo modeled and measured “in-air” laser profiles(Not shown here) showed almost perfect agreement utilizing the Gaussian scattering surface model in the Monte Carlo source model. The particle-size distribution of light-scattering polymer microparticles determined by the dynamic-light-scattering (DLS) technique is shown in Fig. 13. As the dose to gel increases, the particle size distribution is observed to broaden such that that the mean and maximum particle size increases. Less change is observed in the minimum particle size, although that too increases slightly. At present, the LightTools model supports monodispersive Mie particles only, so effective maximum scattering particle radii were estimated for each dose level. These radii were 243, 289, and 575 nm, respectively, for dose levels of 1.5, 4, and 6 Gy. The measured laser profiles exiting the three gel flasks (irradiated to 1.5, 4, and 6 Gy, respectively) are illustrated in Fig. 14(a). As the gel receives more dose, and thus contains more, and larger, light scattering polymer particles, the central laser peak is observed to diminish relative to the back-ground scatter signal. The width of the laser peak appears to maintain its shape, except for an increased broadening observed in the low-intensity tails(Note the log scale). At high doses (6 Gy gel) significant broad scattering is observed manifesting as a “scattering offset” to the laser peak. Normalized, Monte-Carlo simulated laser profiles are illustrated in Fig. 14(b). These simulations were-obtained using the effective maximum particle sizes for each dose level and an estimated number density of 5×104 mm-3. In practice, the shape of the profile was found to be more sensitive to the particle size than to the number density. The general behavior of the measured profiles is seen in the simulated profiles, with the exception of the fine detail of the tapering of the spot width at low-intensity levels for the 1.5 and 4 Gy gels. This is interpreted as the breakdown of the mono-dispersive Mie scattering approximation.
FIG. 13.
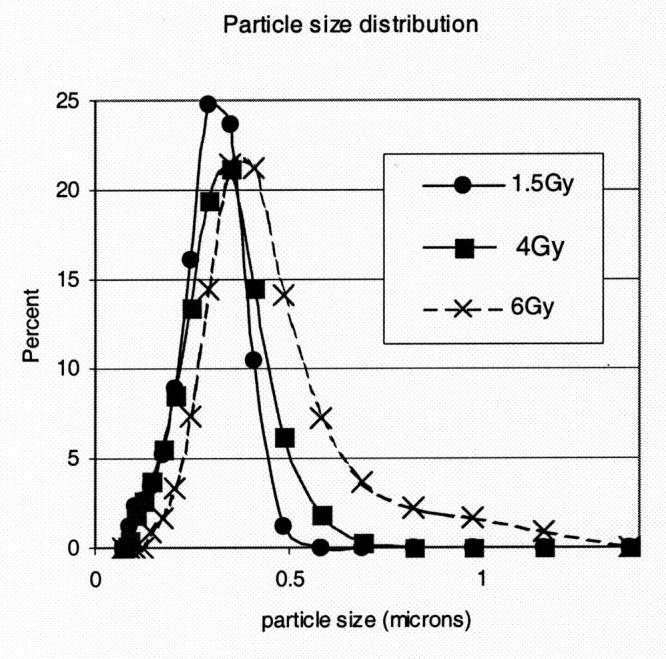
PAG gel polymer microparticle size distributions, as determined by dynamic light scattering (DLS), for gels irradiated to different doses.
FIG. 14.
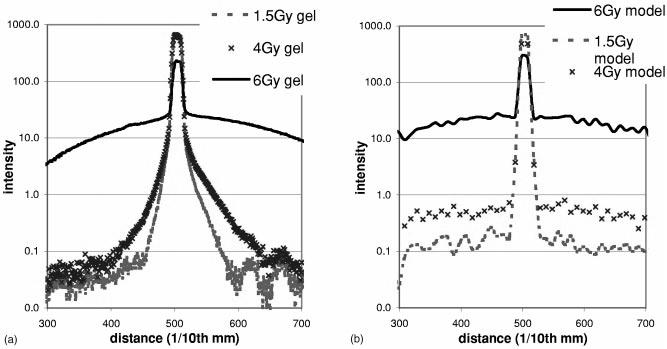
Measured(a) and Monte Carlo calculated (b)profiles across the laser beam on the exit of PAG gels irradiated to different dose levels [measurement setup shown in Fig. 5(b). The Monte Carlo model is observed to reproduce the general behavior of the measured profiles but the limitations of the Mie model are observed in the failure to accurately model the penumbral tails of the PAG gels receiving a low and medium dose.(Note: discrepancies are highlighted by the log scale.
IV. CONCLUSIONS
The role and potential of optical-CT gel dosimetry is discussed in relation to other dosimeters and the spectrum of modern radiation treatments in the spider plot of Fig. 1. Optical-CT gel-dosimetry is shown to approach(e.g., Fig. 11) a long-term key goal of radiation dosimetry as approximated by the RTAP (1,60,3,1) criteria(i.e., Resolution 1 mm, Time 60 mins, Accuracy within 3%, Precision 1%). These criteria, in conjunction with the tissue equivalence of present gel-dosimeters, renders gel-dosimetry a potent tool with wide applicability across the spectrum of photon and electron therapies. The sensitivity of image quality to key acquisition parameters was investigated and nominal operating conditions (laser step size=1 mm, angular rotation increment =1.5 degrees, number of ADC averages=100) were established. The need was articulated for the development of a model to simulate the optical-CT process to enable effective optimization of the technique. As a preliminary step in this direction, a commercially available optical Monte Carlo soft-ware was investigated and demonstrated to have potential to model light transport through simple gel-dosimetry systems. Limitations of the Mie scattering model were identified and are the subject of continued investigations.
ACKNOWLEDGMENTS
We are very grateful to Michael Sharpe and Daniel Letourneau for comments and helpful discussions. Also to Woody Armour for assistance with the x-ray lens delivery, and Leonard Kim for assistance with figures and to Paul Ziemer for assistance with the dynamic-light-scattering measurements.
References
- 1.Webb S. Intensity-Modulated Radiation Therapy. (institute of Physics Publishing; Bristol, UK: 2001. [Google Scholar]
- 2.Perez CA, Michalski JM, Purdy JA, Lockett MA. “New trends in prostatic cancer research. Three-dimensional conformal radiation therapy 3-D CRT, brachytherapy, and new therapeutic modalities,”. Rays. 2000;25:331–343. [PubMed] [Google Scholar]
- 3.Schell MC, Bova FJ, Larsson D, Leavitt DL. Stereotactic radiosurgery, Report of Task Group 42 Radiation Therapy Committee. American Association of Physicists in Medicine; New York: 1995. AAPM Report #54 (aIP. [Google Scholar]
- 4.Leibel SA, et al. “Intensity-modulated radiotherapy,”. Cancer. 2002;8:164–176. doi: 10.1097/00130404-200203000-00010. [DOI] [PubMed] [Google Scholar]
- 5.Oldham M. “Radiation sensitive film and gels,”. In: Mayles PM, Nahum AE, Rosenwald JC, editors. Handbook of Radiotherapy Physics: Theory and Practice. (institute of Physics; Bristol UK: 2002. [Google Scholar]
- 6.Niroomand-Rad A, et al. “Radiochromic film dosimetry: recommendations of AAPM Radiation Therapy Committee Task Group 55. American Association of Physicists in Medicine,”. Med. Phys. 1998;25:2093–2115. doi: 10.1118/1.598407. [DOI] [PubMed] [Google Scholar]
- 7.Van Dyke J. The Modern Technology of Radiation Oncology. Medical Physics Publishing; Madison, WI: 1999. [Google Scholar]
- 8.International Commission on Radiation Units and Measurements(iCRU, ICRU Report 24. Washington, DC: 1976. “Determination of absorbed dose in a patient irradiated by beams of X or gamma rays in radiotherapy procedures,”. [Google Scholar]
- 9.Jordan KJ. “Developmental issues for optical-CT and gel-dosimetry,”; Proceedings of the 1st International Conference on Gel Dosimetry; DOSEGEL, 1999 Queens University Printing Service, Kingston, ON, Canada. 1999.pp. 91–96. [Google Scholar]
- 10.Kron T. “Radiation therapy requirements: what do we expect from gel-dosimetry,”; Proceedings of the 2nd International Conference on Gel Do-simetry; DOSEGEL, 2001 Queensland University of Technology, Brisbane, Australia. 2002.pp. 2–9. [Google Scholar]
- 11.Oldham M, Siewerdsen JH, Shetty A, Jaffray DA. “High resolution gel-dosimetry by optical-CT and MR scanning,”. Med. Phys. 2001;28:1436–1445. doi: 10.1118/1.1380430. [DOI] [PubMed] [Google Scholar]
- 12.Maryanski MJ, Gore JC, Kennan RP, Schulz RJ. “NMR relaxation enhancement in gels polymerized and cross-linked by ionizing radiation: a new approach to 3D dosimetry by MRI,”. Magn. Reson. Imaging. 1993;11:253–258. doi: 10.1016/0730-725x(93)90030-h. [DOI] [PubMed] [Google Scholar]
- 13.Schreiner LJ. “Fricke gel dosimetry,”. pp. 15–22. in Ref. 10. [Google Scholar]
- 14.Kelly BG, Jordan KJ, Battista JJ. “Optical CT reconstruction of 3D dose distributions using the ferrous-benzoic-xylenol FBX gel dosimeter,”. Med. Phys. 1998;25:1741–1750. doi: 10.1118/1.598356. [DOI] [PubMed] [Google Scholar]
- 15.Baustert IC, Oldham M, Smith TA, Hayes C, Webb S, Leach MO. “Optimized MR imaging for polyacrylamide gel dosimetry,”. Phys. Med. Biol. 2000;45:847–858. doi: 10.1088/0031-9155/45/4/303. [DOI] [PubMed] [Google Scholar]
- 16.Gore JC, Ranade M, Maryanski MJ, Schulz RJ. “Radiation dose distributions in three dimensions from tomographic optical density scanning of polymer gels: I. Development of an optical scanner,”. Phys. Med. Biol. 1996;41:2695–2704. doi: 10.1088/0031-9155/41/12/009. [DOI] [PubMed] [Google Scholar]
- 17.De Deene Y, De Wagter C. “Artefacts in multi-echo T2 imaging for high-precision gel dosimetry: III. Effects of temperature drift during scanning,”. Phys. Med. Biol. 2001;46:2697–2711. doi: 10.1088/0031-9155/46/10/312. [DOI] [PubMed] [Google Scholar]
- 18.De Deene Y, De Wagter C, De Neve W, Achten E. “Artefacts in multi-echo T2 imaging for high-precision gel dosimetry: I. Analysis and compensation of eddy currents,”. Phys. Med. Biol. 2000;45:1807–1823. doi: 10.1088/0031-9155/45/7/307. [DOI] [PubMed] [Google Scholar]
- 19.De Deene Y, De Wagter C, De Neve W, Achten E. “Artefacts in multi-echo T2 imaging for high-precision gel dosimetry: II. Analysis of B1-field inhomogeneity,”. Phys. Med. Biol. 2000;45:1825–1839. doi: 10.1088/0031-9155/45/7/308. [DOI] [PubMed] [Google Scholar]
- 20.Gore JC, Ranade M, Maryanski MJ, Schulz RJ. “Radiation dose distributions in three dimensions from tomographic optical density scanning of polymer gels: I. Development of an optical scanner,”. Phys. Med. Biol. 1996;41:2695–2704. doi: 10.1088/0031-9155/41/12/009. [DOI] [PubMed] [Google Scholar]
- 21.Maryanski MJ, Zastavker YZ, Gore JC. “Radiation dose distributions in three dimensions from tomographic optical density scanning of polymer gels: II. Optical properties of the BANG polymer gel,”. Phys. Med. Biol. 1996;41:2705–2717. doi: 10.1088/0031-9155/41/12/010. [DOI] [PubMed] [Google Scholar]
- 22.Gore JC, Ranade M, Maryanski MJ, Schulz RJ. “Radiation dose distributions in three dimensions from tomographic optical density scanning of polymer gels: I. Development of an optical scanner,”. Phys. Med. Biol. 1996;41:2695–2704. doi: 10.1088/0031-9155/41/12/009. [DOI] [PubMed] [Google Scholar]
- 23.Wong J, Jaffray DA, Siewerdsen JH, Oldham M, Laub W, Armour E. “An image guided small animal conformal radiation research platform,”; 49th Annual Meeting of the Radiation Research Society; Reno, Nevada. 2002.pp. 312–313. [Google Scholar]
- 24.Baldock C, Harris PJ, Piercy AR, Healy B. “Experimental determination of the diffusion coefficient in two-dimensions in ferrous sulphate gels using the finite element method,”. Australas. Phys. Eng. Sci. Med. 2001;24:19–30. doi: 10.1007/BF03178282. [DOI] [PubMed] [Google Scholar]
- 25.Bass M, the Optical Society of America . Handbook of Optics. 2nd ed. McGraw-Hill; New York: 1995. [Google Scholar]
- 26.Maryanski MJ, Zastavker YZ, Gore JC. “Radiation dose distributions in three dimensions from tomographic optical density scanning of polymer gels: II. Optical properties of the BANG polymer gel,”. Phys. Med. Biol. 1996;41:2705–2717. doi: 10.1088/0031-9155/41/12/010. [DOI] [PubMed] [Google Scholar]
- 27.Kak AC, Slaney M, the IEEE Engineering in Medicine and Biology Society . Principles of Computerized Tomographic Imaging. (iEEE Press; New York: 1988. [Google Scholar]
- 28.Maryanski M. “Radiation-sensitive polymer-gels: properties and manufacturing,”. pp. 63–73. in Ref. 9. [Google Scholar]