Abstract
The development of intensity-modulated radiotherapy (IMRT) has created a clear need for a dosimeter that can accurately and conveniently measure dose distributions in three dimensions to assure treatment quality. PRESAGE™ is a new three dimensional (3D) dosimetry material consisting of an optically clear polyurethane matrix, containing a leuco dye that exhibits a radiochromic response when exposed to ionizing radiation. A number of potential advantages accrue over other gel dosimeters, including insensitivity to oxygen, radiation induced light absorption contrast rather than scattering contrast, and a solid texture amenable to machining to a variety of shapes and sizes without the requirement of an external container. In this paper, we introduce an efficient method to investigate the basic properties of a 3D dosimetry material that exhibits an optical dose response. The method is applied here to study the key aspects of the optical dose response of PRESAGE™: linearity, dose rate dependency, reproducibility, stability, spectral changes in absorption, and temperature effects. PRESAGE™ was prepared in 1×1×4.5 cm3 optical cuvettes for convenience and was irradiated by both photon and electron beams to different doses, dose rates, and energies. Longer PRESAGE™ columns (2 ×2×13 cm3) were formed without an external container, for measurements of photon and high energy electron depth-dose curves. A linear optical scanning technique was used to detect the depth distribution of radiation induced optical density (OD) change along the PRESAGE™ columns and cuvettes. Measured depth-OD curves were compared with percent depth dose (PDD). Results indicate that PRESAGE™ has a linear optical response to radiation dose (with a root mean square error of ∼1%), little dependency on dose rate (∼2%), high intrabatch reproducibility (<2%), and can be stable (∼2%) during 2 hours to 2 days post irradiation. Accurate PRESAGE™ dosimetry requires temperature control within 1 °C. Variations in the PRESAGE™ formulation yield corresponding variations in sensitivity, stability, and density. CT numbers in the range 100–470 were observed. In conclusion, the small volume studies presented here indicate PRESAGE™ to be a promising, versatile, and practical new dosimetry material with applicability for radiation therapy.
Keywords: gel dosimetry, optical computed tomography, optical CT, 3D dosimetry, verification, PRESAGE™, radiochromic dosimeter
I. INTRODUCTION
Modern radiation treatment techniques including intensity-modulated radiotherapy (IMRT) are being widely used in the clinic with the intent to deliver highly conformal dose in three dimensions.1 Ideally, the commissioning, as well as routine quality-assurance (QA), of these sophisticated treatment techniques requires a dosimeter that can accurately and conveniently measure dose distributions also in three dimensions. IMRT QA dosimetry systems in common use at the present time (e.g., MapCheck2 and RIT3) perform only a limited 2D dose measurement in practice. A critical need has therefore arisen for an accurate and convenient 3D dosimetry system that can more effectively and comprehensively commission and perform routine QA for these techniques. Gel dosimetry has been shown to have promising capability for 3D dose measurement.4-8 Typically, in gel dosimetry studies, a macroscopic volume (e.g., 500 ml) of radiation sensitive gel records the 3D dose distribution, which is subsequently read out by MRI, optical-CT, or x-ray CT.4-9 Fricke gel and polymer gel are the most popular gel dosimeters reported in literature,10-22 and each has merits and limitations. In general, Fricke gel has high reproducibility, and can be easily prepared, but suffers diffusion problems.11,12 Polymer gels are relatively stable, with high sensitivity to radiation, but are susceptible to light scattering artifacts8,22 and are difficult to prepare as the dose response is sensitive to the presence of free oxygen. Although continual improvements in gel formulations have been reported,20,21 a new 3D dosimetry material that can overcome these problems would be of significant interest. In this paper we present the basic characterization of a new solid dosimeter PRESAGE™ that is designed for use with optical CT. The technical implementation of optical CT has been described elsewhere.4-8 It has the advantages of high resolution, relatively low noise, and potentially low cost compared with MRI or x-ray CT readout.
The composition of PRESAGE™ 23 is based on a clear polyurethane matrix doped with radiochromic components (leuco dyes) that generate a color change, and hence optical absorption or optical density (OD) change, on exposure to ionizing radiation. Cursory observations indicate a number of attractive features and potential advantages over other gel dosimeters. First, PRESAGE™ is robust in a lab environment, being insensitive to the atmosphere, and not requiring an external container or phantom material. In addition, the radiochromic color change absorbs light rather than scatters light, which facilitates high accuracy readout by optical CT. Scatter artifacts have been observed in optical-CT scanning of polymer gels, where the principle mechanism of optical contrast is scatter.8,22 Optical-CT images are further enhanced by the lack of a container minimizing the refractive index matching problem and enabling an accurate measurement closer to the periphery of the dosimeter. Dose response sensitivity can be adjusted by changing the proportions of the leuco-dye and initiating agent components. The solid plastic texture of PRESAGE™ is amenable to machining to a variety of shapes for different applications. The CT number of a variety of PRESAGE™ formulations was observed to vary between 100–470 [Fig. 1(a)], which will enable the manufacture of phantoms with different density inserts. The dosimeter with a lower CT number (∼50) is also under investigation.
Fig. 1.
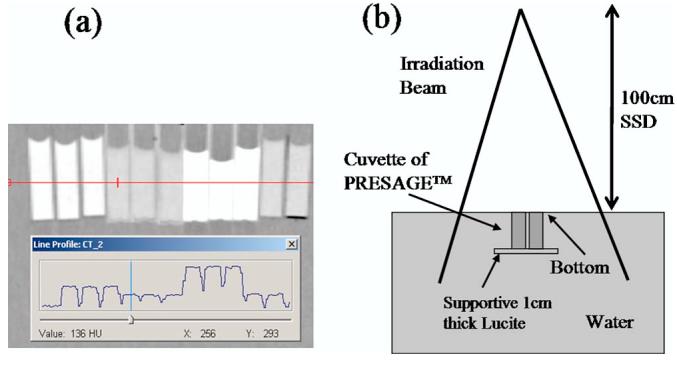
(a) CT scan and CT numbers of PRESAGE™ with different formulations. The top images are the CT scan of cuvettes of PRESAGE™ with different formulations and the bottom curves are the line profile of the CT numbers (ranging from about 100 to 470) of PRESAGE™. (b) Experiment setup for irradiation of PRESAGE™. The cuvettes were placed into the water phantom upside down so that when irradiated the individual cuvettes had the radiation impinging through the cuvettes at the bottom.
Preliminary studies of PRESAGE™ have been reported in conference proceedings and abstracts.23-26 Typically measurements of the dose response were made with a conventional spectrophotometer at a fixed location in a sample. Doran et al.26 presented CCD-based optical CT scanning of PRESAGE™, but did not report a quantitative study of its dosimetric properties. Here we report a new and efficient method of analyzing the dosimetric characteristics of a dosimetry material, expressing either a radiochromic or light-scattering dose response. The method uses small volumes of the material, and is designed to encourage accuracy, convenience, low cost, and to enable the efficient study of a wide range of dosimetric parameters.
II. METHODS
A. An efficient method to characterize a new 3D dosimetry material
The principle of the method is an extension of the “depth-dose” calibration technique introduced by Oldham et al.27 In that paper, depth-T2 curves were measured along the central axis of test tubes (20 cm long and 2.5 cm diameter) containing BANG™ polymer gel, using MRI. Subsequent regression of the depth-T2 values with corresponding depth-dose values enabled an accurate determination of the calibration curve relating T2 to dose. In the present work, depth-optical-density (OD) curves are measured along the long axis of square columns or cuvettes of PRESAGE™ using an in-house linear laser scanning technique. In the same way, a regression of the depth-OD curve with the corresponding depth-dose curve yields the relation between dose and OD change. Performing this analysis on samples irradiated under different conditions (different dose rates, etc.) enables efficient evaluation of the basic dosimetric response of the material.
Small volumes of PRESAGE™, supplied by Heuris Pharma LLC (Skillman, NJ 08558), were prepared in standard optical cuvettes, which were irradiated in pairs in a water bath [Fig. 1(b)]. An overview of PRESAGE™ manufacturing and composition details has been previously published.23,25,28 Different PRESAGE™ formulations exist and different types and amounts of solvent and leuco dye have been used in the formulations to produce PRESAGE™ with different CT numbers and dose sensitivity. The PRESAGE™ used in this study is composed of a clear polyurethane containing 1% leuco malachite green and 0.01% catalyst. Its CT number and density were measured to be ∼130 HU and 1.07 g/cm3, respectively and its effective Z number is calculated to be 8.3. Most PRESAGE™ samples in this report were prepared in optical cuvettes that have an accurate and well-defined optical path length facilitating accurate OD measurement. The cuvettes were made of polystyrene with a density of 1.046 g/cm2, electron density of 3.387×10²³ e/g, wall thickness of 1 mm, and internal dimension of about 1 cm×1 cm×4.5 cm. The short length of the cuvettes represents a limitation when sampling the depth-OD changes of penetrating radiation. Longer PRESAGE™ columns (2 cm×2 cm×13 cm) were therefore also made, which had no external container. Although the tolerances on the pathlength of the long columns were not as precise as the cuvettes, they enabled more comprehensive sampling at deeper depths.
Irradiating PRESAGE™ cuvettes in the same geometry [Fig. 1(b)], but with various radiation parameters (nominal dose rate, electron beam, photon beam, etc.) enabled the investigation of dosimetric response, including linearity, reproducibility, dose rate dependency, and stability. The depth-dose response and spectral absorption changes were investigated using the in-house linear optical scanner (discussed below) and a spectrophotometer. Measurements were performed both pre- and post-irradiation in order to obtain the radiation induced OD change. Irradiations of PRESAGE™ samples in optical cuvettes were performed using a low energy electron beam (6 MeV) such that the full range of percent dose was deposited along the short 4.5 cm length of the cuvette. Photon irradiation with different doses was employed to study the dose response to a photon beam. Different dose rates were used for both electron and photon irradiations to study dose rate dependency. The source-surface distance (SSD) was set to 100 cm in all cases. Optical measurements were made at 2 h, 2 days, and 5 days after irradiation to evaluate post-irradiation stability of the new dosimeter. Cuvettes were stored in the fridge between the measurements. Irradiation of the long PRESAGE™ columns were performed with higher energy electron beams (16 MeV) and photon beams (6 MV) with a dose of 12 Gy. A summary of the irradiation configurations is given in Table I.
Table I.
Irradiation of PRESAGE™.
| Energy | Dose (Gy) | Dose rate (cGy/min) | Field/cone size (cm2) | PRESAGE™ sample |
|---|---|---|---|---|
| 6 MeV | 4 | 200 | 15×15 | Short cuvette |
| 6 MeV | 4 | 400 | 15×15 | Short cuvette |
| 6 MeV | 4 | 1000 | 15×15 | Short cuvette |
| 6 MV | 2 | 400 | 10×10 | Short cuvette |
| 6 MV | 4 | 400 | 10×10 | Short cuvette |
| 6 MV | 10 | 400 | 10×10 | Short cuvette |
| 6 MV | 4 | 100 | 10×10 | Short cuvette |
| 6 MV | 4 | 600 | 10×10 | Short cuvette |
| 16 MeV | 12 | 400 | 15×15 | Long column |
| 6 MV | 12 | 400 | 10×10 | Long column |
In each irradiation experiment, cuvettes were irradiated in pairs, along the long axis from bottom (closed end) to top (open end) as shown in Fig. 1(b). Long PRESAGE™ columns were irradiated in the similar way, but not in pairs. Positioning cuvettes or PRESAGE™ columns in water provided full-scatter conditions and yielded dose deposition along the long axis of the cuvettes or the columns that can be calculated in the Varian Eclipse planning system. The depth dose in the long PRESAGE™ columns were calculated from their CT scans using the commissioned Eclipse Monte Carlo algorithm for electron irradiation (with parameters of accuracy 1%, and a 3D Gaussian smoothing method) and pencil beam algorithm for photon irradiation. Both algorithms have been verified, tested and commissioned for patient treatment in our institution. Any air in the opening of the cuvettes was displaced by filling the cuvette with water. The temperature in the water tank was kept a 22 °C. PRESAGE™ shows significant optical density change in response to the irradiation dose. Figure 2 shows a photograph (red channel of the colored photograph) of an unirradiated cuvette (a), a cuvette irradiated with a 6 MeV electron beam (b), a 6 MV photon beam (c), and the long PRESAGE™ column (without any container) irradiated with a 16 MeV electron beam (d). The column length (d) in this figure has been scaled down in order to fit into the figure.
Fig. 2.
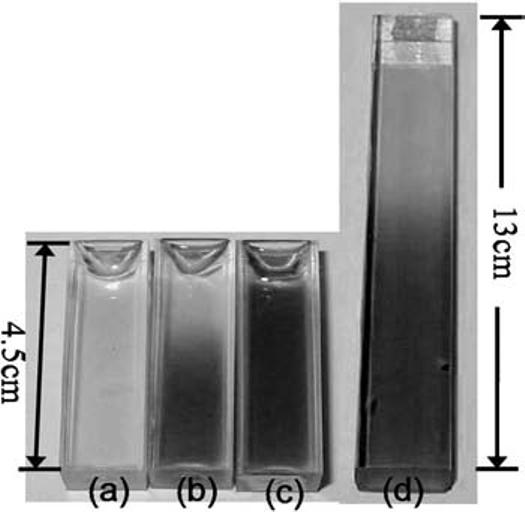
Photographs of various cuvettes. (a) Nonirradiated cuvette. (b) Irradiated cuvette by 6 MeV electrons. (c) Irradiated cuvette by 6 MV photons. (d) A PRESAGE™ column without an external container after irradiation by 16 MeV electrons. The picture (d) has been scaled down in order to fit into the figure. Irradiations were performed in the setup shown in Fig. 1(b).
The temperature sensitivity of the radiochromic response was investigated by measuring the OD change of cuvettes irradiated to the same dose of 12 Gy, but at different temperatures. Hot water and (dissolved) ice water were mixed together with different ratios and poured into the water tank to achieve different temperatures in the geometry of Fig. 1. Cuvettes were placed in the well mixed water for about 10 min to achieve temperature equilibration. The temperature in the water tank was measured right before the irradiation of the cuvettes and different temperatures of 6 °C, 10 °C, 15 °C, 20 °C, and 28 °C were used for the irradiation.
B. Measurement of radiation induced optical density change
The linear optical scanner used to detect optical density variations along the long axis of the PRESAGE™ samples (both the cuvettes and the long PRESAGE™ columns) is shown in Fig. 3. A He-Ne laser (633 nm) was oriented horizontally and incident on the midline of the PRESAGE™ samples (short cuvettes or long columns). A photodiode positioned on the opposite side of the sample detected the amount of light transmitted through the sample. A neutral density filter (Edmund Optics) placed in front of the laser was used to adjust the intensity to avoid saturation of the photodiode. The sample was carefully placed, in a repeatable manner, onto a linear travel stage (Velmex, Inc.) to be scanned by the laser along its long axis (depth). Motion control and data acquisition of the scanner were achieved by National Instrument PXI hardware and Labview® software. The scanning pixel size was set to be 1 mm along the depth of the sample, and the maximum scanning distance was 94 mm, limited by the travel range of the scanner. In essence, the scanning measurement records a transmission profile (converted to an OD profile) at 1 mm increments along the long axis of the sample, each value of the profile representing the amount of transmitted light through the sample. Highest accuracy requires that the absorbance (and hence dose) be uniform across the path length. This is achieved in the geometry of Fig. 1(b), by virtue of the small cross-sectional size of the sample compared with the large radiation beam (10×10 cm2 photons and 15×15 cm2 electrons), and by the presence of the scattering media surrounding the samples.
Fig. 3.
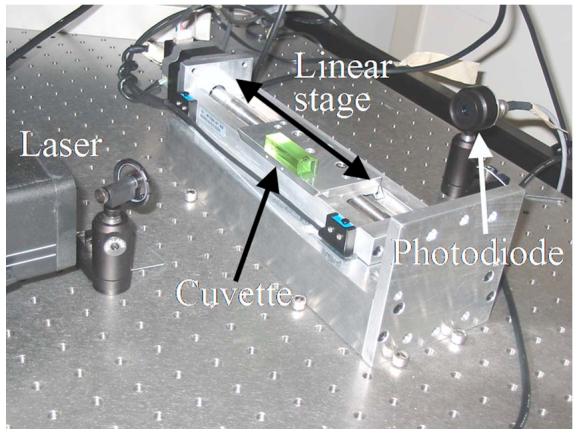
Picture of the linear optical scanner. A He-Ne laser is used as light source. A cuvette is placed onto the linear travel stage for scanning and the transmitted optical signal is detected by a photodiode.
The accuracy of the laser scanning measurement is affected by various factors, including the optical quality and clarity of both the cuvettes and PRESAGE™ material. Surface scratches on the cuvette walls, and bubbles in the PRESAGE™, could introduce significant artifacts. The effect of any such imperfections was minimized by performing the linear scan measurements both pre- and post-irradiation, and subtracting the preirradiation OD from the post-irradiation OD. Common artifacts and the contribution of the cuvette walls on OD measurement were reduced by the subtraction. A complication arises in that the 1 cm optical path length of the cuvette was found to vary linearly from 10 mm at the bottom to 10.6 mm at the opening. Post-processing of the optical scanning data was performed to normalize the measured OD profiles to a standard 10 mm path length. Accuracy can also be affected by fluctuations in laser output that may occur in response to temperature changes. This source of uncertainty was minimized by acclimatizing the laser for at least 30 min prior to measurement. Repeated scanning of the samples showed that the OD measurements were highly reproducible (<0.5% deviation) for both pre- and post-irradiation, except in the cases where significant scratches were noticed, which could introduce a few percent deviations.
Spectral absorption changes of PRESAGE™ cuvettes were measured with a spectrophotometer (Spectronic™ GENESYS™ 20). Each spectral measurement was normalized to the spectrum of air. Difference measurements were again made, pre- and post-irradiation, to obtain the radiation induced spectral changes in absorption.
III. RESULTS AND DISCUSSION
A. Radiation induced spectral absorption changes
The spectral absorption characteristics of PRESAGE™ are illustrated in Fig. 4, where Fig. 4(a) is an example of OD spectra of a cuvette before and after irradiation. The build up of the absorption curves with dose is illustrated in 4(b), where OD changes of cuvettes irradiated by 6 MV photons with different doses are given. The sensitivity of the PRESAGE™ formulation tested in this case was found to be ∼0.063 OD Gy−1 cm−1. Figures 5(a) and 5(b) show the OD changes of the cuvettes irradiated at different nominal dose rates, and by electron (6 MeV, 4 Gy, 15×15 cm2 cone) and photon (6 MV, 4 Gy, 10×10 cm2 field size) beams, respectively. The figures show that the OD change has a minor dependency (∼2%) on dose rate. A more sensitive evaluation of dose rate dependency was shown in Sec. III B 3. The spectra indicate that the maximum radiation induced OD change occurs at the red wavelength ∼633 nm. The full-width-half-maximum of the absorption peak is ∼50 nm. The absorption peak is close to the wavelength of the He-Ne laser used in the linear scanner. Matching the laser wavelength to the absorption peak enabled the highest sensitivity of the scanner. The spectra of the two cuvettes that were irradiated in pairs by electrons (6 MeV, 4 Gy) are shown in Figs. 6(a) and the good agreement between them was observed and indicates high reproducibility of radiation response. The stability of the PRESAGE™ optical response to electron (6 MeV, 4 Gy) and photon (6 MV, 4 Gy) irradiations is shown in Figs. 6(b) and 6(c), respectively. A negligible change was observed over 2 days, but after 5 days about 15% decrease in OD had occurred. It was also observed that the dose response stability varies with PRESAGE™ formulations.
Fig. 4.
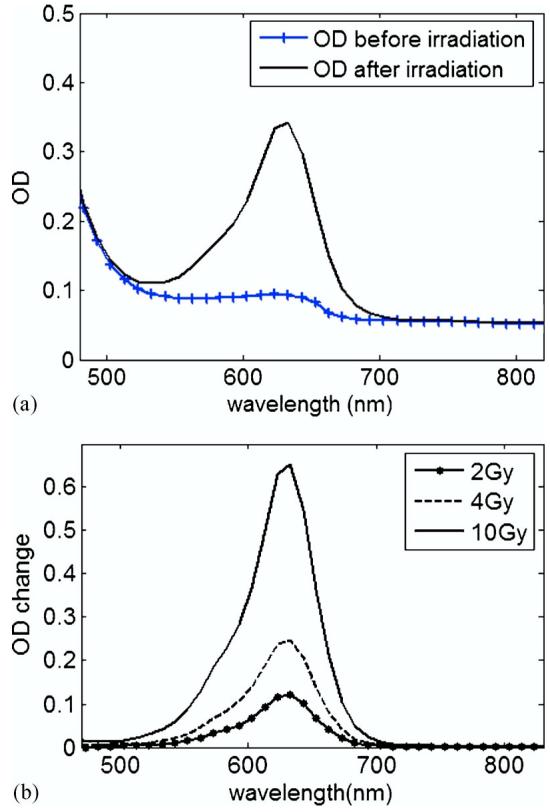
(a) Optical density (OD) spectrum before and after irradiation (6 MeV, 4 Gy). (b) Spectrum of OD change for irradiation (6 MV, 400 cGy/min) with different doses of 2, 4, and 10 Gy.
Fig. 5.
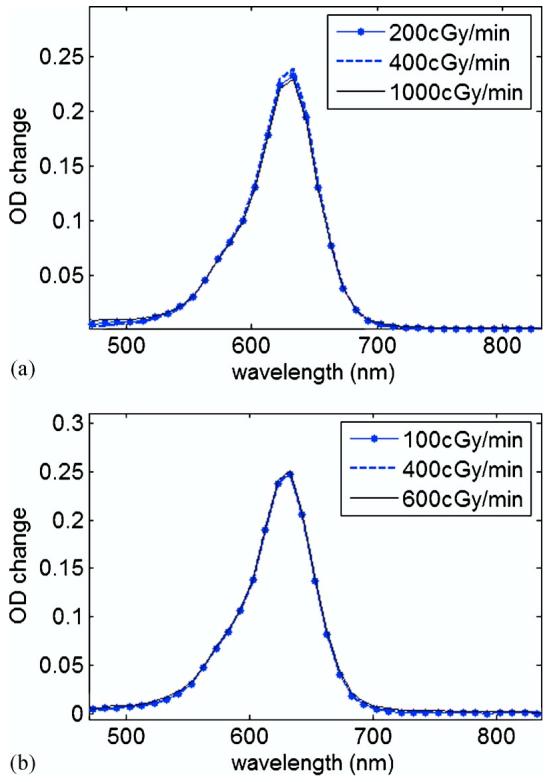
(a) Radiation induced OD change by electron beam (6 MeV, 4 Gy) of different dose rates. (b) Radiation induced OD change by photon beam (6 MV, 4 Gy) of different dose rates.
Fig. 6.
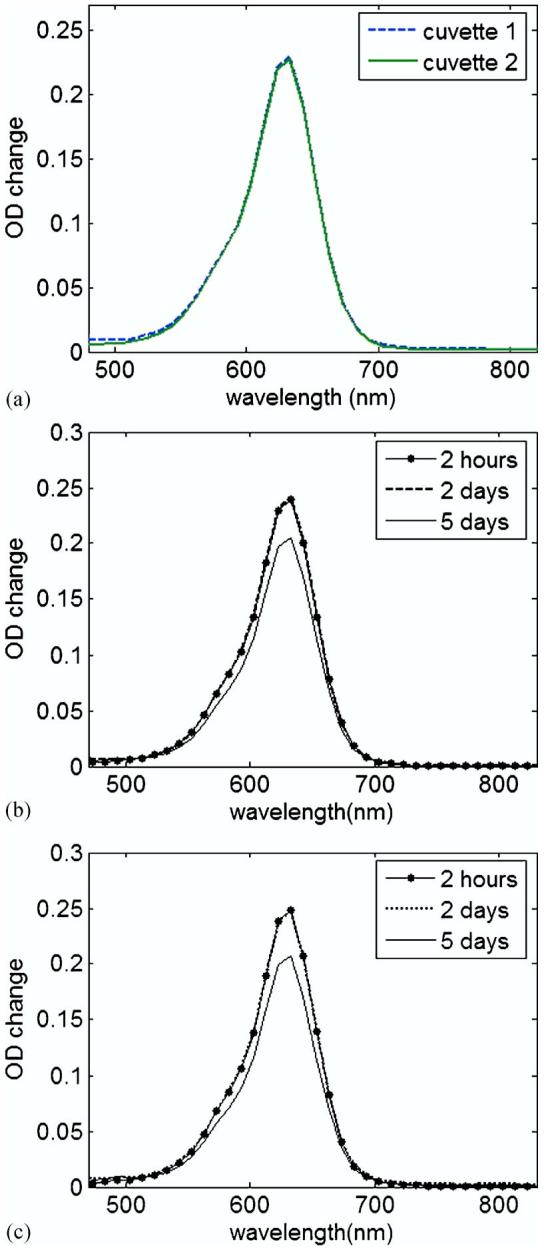
(a) Spectrum of OD change of two cuvettes that were irradiated by electron beam (6 MeV, 4 Gy) at the same time. (b) Post-irradiation (6 MeV, 4 Gy) stability of the spectrum for an electron beam. The curve (dotted line) measured at 2 h after irradiation coincides with that (dashed line) measured at 2 days after irradiation. (c) Post-irradiation (6 MV, 4 Gy) stability of the spectrum for a photon beam. The curve (dotted line) measured at 2 h after irradiation coincides with that (dashed line) measured at 2 days after irradiation.
B. Radiation induced depth OD change
1. Reproducibility
Example plots of the measured OD change with depth along pairs of cuvettes that were irradiated together are shown in Figs. 7(a) and 7(b). In general, good agreement was observed between both cuvettes except in a few cases where imperfections were noted on either the walls of the cuvettes or in the PRESAGE™ itself. For example, there were minor scratches on the surface of the cuvette that might be produced during handling and cleaning, excess PRESAGE™ on walls that was generated by some remainder or spill of PRESAGE™ on the surface of the cuvette when the PRESAGE™ was poured into the cuvette before it solidified, and a few bubbles in PRESAGE™ that were generated in manufacture. Figure 7(a) shows the depth-OD curves for electron irradiation and Fig. 7(b) is for photon irradiation. The percent-depth-dose (PDD) curves measured in Wellhofer® water tank (Wellhofer® diode and ion chamber were used for electron and photon PDD measurements, respectively) are included in both figures for comparison. Some disagreement between the PDD curves and the OD measurements was observed and this may be due to the density difference between water (used for PDD curve) and PRESAGE™ (used for OD measurements). A more accurate comparison between the calculated depth dose and the corresponding depth OD change and is presented in the next section. The OD change for the two cuvettes indicates a high reproducibility of the dose response for both photon and electron beams, with root mean square error (RMSE)<2%. Optical measured data is missing in the early buildup region due to interference of the bottom of the cuvette with the transmitting laser beam. The bottom of the cuvette has a thickness of about 2.5 mm and the cuvette is made of polystyrene with an electron density of 1.013 times that of water. The water equivalent thickness of the bottom is about 2.53 mm, which represents the region of data that cannot be measured by the optical scanner. The measurement region is also limited by the incomplete fill of PRESAGE™ in cuvettes as well as the concave shape formed at the open end of PRESAGE™ when it solidifies.
Fig. 7.
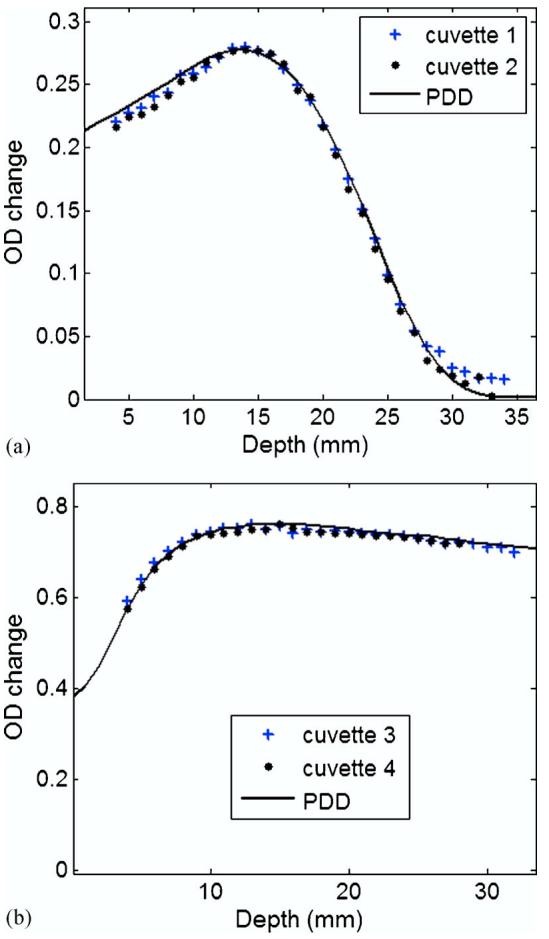
Optical density (OD) change of two cuvettes of PRESAGE™ that were irradiated at the same time. Crosses and dot marks in the figures represent the OD changes along the depth of the cuvettes. The solid lines are the normalized PDD curves measured in the Wellhofer® water tank. (a) Irradiated by electron beam (6 MeV, 4 Gy, 15×15 cm2 cone). (b) Irradiated by a photon beam (6 MV, 10 Gy, 10×10 cm2 field size).
2. Linearity of dose response
Normalized depth OD changes along the long PRESAGE™ columns for a 16 MeV electron and 6 MV photon irradiations are plotted against the calculated percentage-depth-dose (PDD) in PRESAGE™ in Fig. 8(a). Good agreement between the normalized depth OD change and the percent depth dose was observed and indicates good linearity between the OD change and the absorbed dose. To quantify the linearity, an absolute OD change versus an absolute dose in the PRESAGE™ column for 16 MeV electron irradiation is plotted as the “cross” mark in Fig. 8(b), and the corresponding linear fit (solid line) has the form y =0.083x−0.017 with RMSE<1%. For 6 MV photon irradiation, the measurable dose in the PRESAGE™ column only ranges from about 60% to 100% of the full dose, as shown in Fig. 8(a). The corresponding linear fit for the 6 MV photon irradiation was not shown in Fig. 8(b) due to the short dose range, but it has the form of y =0.083x+0.014 with RMSE<1%. These values represent high linearity between OD change and absorbed dose. Meanwhile, the “over-response” at the low dose region [tails of the OD curves in Fig. 7(a) and Fig. 8(a)] was also observed. The reason for this is not fully clear at present. It might be caused by sensitivity to room light during handling and experiment.
Fig. 8.
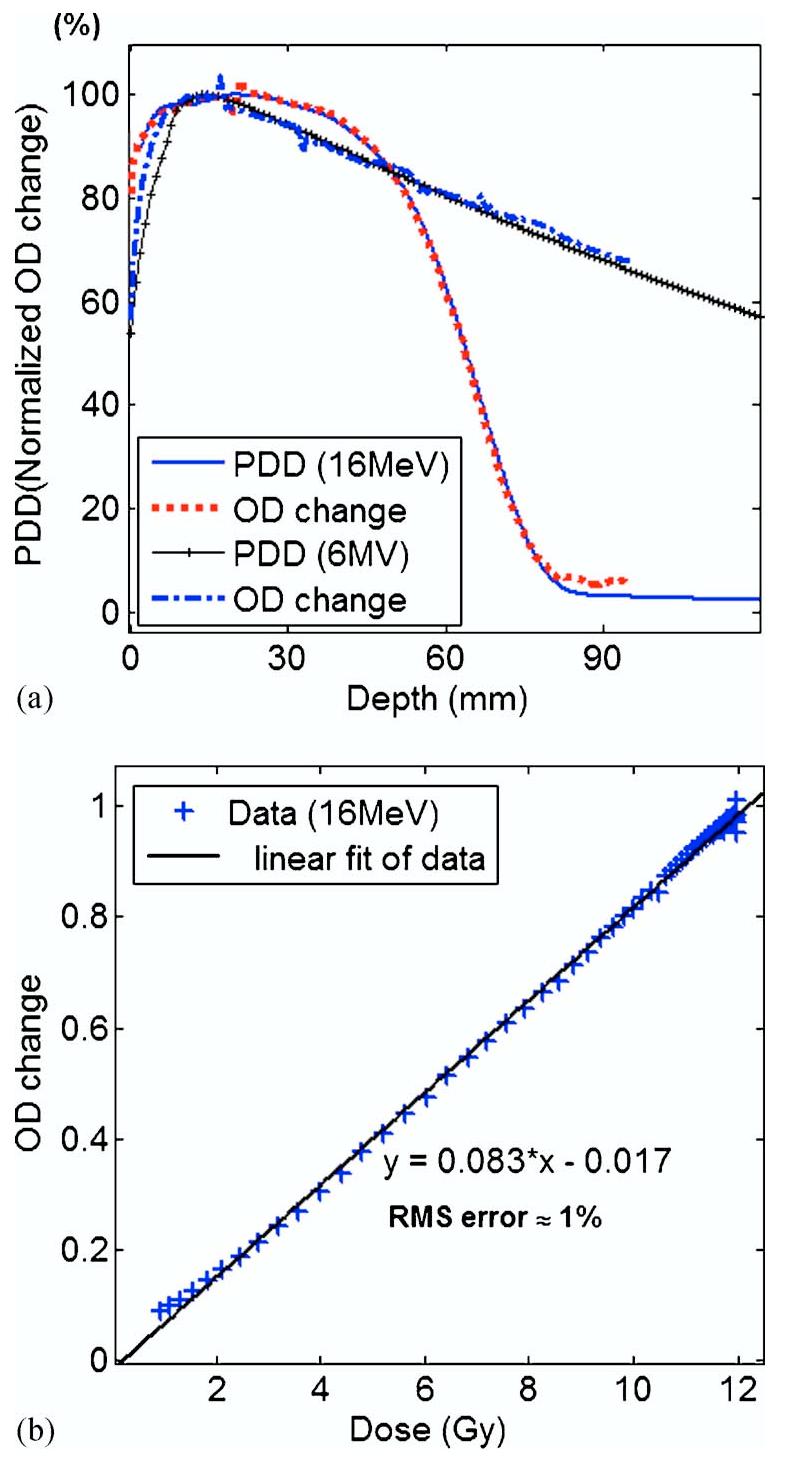
(a) Calculated percent-depth-dose (PDD) and normalized depth optical density (OD) change in two long PRESAGE™ columns irradiated by photon (6 MV, 12 Gy) and an electron (16 MeV, 12 Gy) beams, respectively. The solid line represents the PDD calculated by a Monte Carlo algorithm in a Varian Eclipse planning system for the 16 MeV electron irradiation. The solid line with a cross mark is the PDD calculated by the pencil beam algorithm for the 6 MV photon irradiation. The two dashed lines are the normalized depth OD change for the electron irradiation and photon irradiation, respectively. (b) Linearity curve of the OD change versus the absorbed dose in the long PRESAGE™ column irradiated by the 16 MeV electrons. The linear fit (solid line) of the data (cross) is described by the equation y=0.083x−0.017. Root Mean Square (rms) error for the linear fit of the data is about 1%.
3. Dose rate dependency
The depth OD curves corresponding to irradiation with different nominal dose rates programmed into the linear accelerator (200, 400, and 1000 cGy/min) are shown in Fig. 9(a). The irradiation geometry was kept the same for all irradiations. Little dose-rate effects (∼2% deviation) within experimental error were observed, as indicated by the similarity of the curves. The spectra OD change corresponding to the different dose rates was also measured by a conventional spectrophotometer and show little difference from one another (Fig. 5). The good agreement among the OD changes for different dose rates indicates that the irradiation induced OD change has little dependency on dose rate.
Fig. 9.
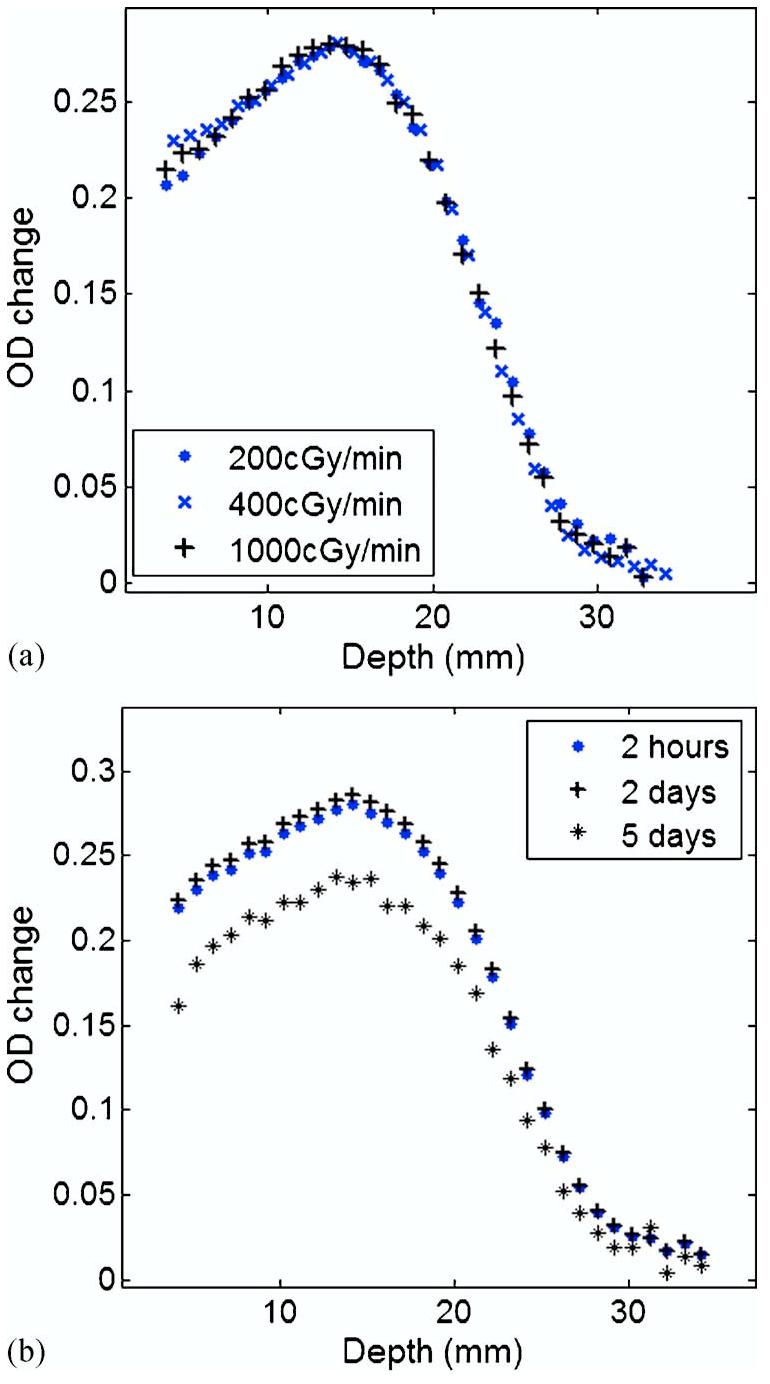
(a) Depth OD changes for irradiated cuvettes (6 MeV, 4 Gy) at different nominal dose rates. (b) Post-irradiation stability. Depth OD changes for irradiated cuvettes (6 MeV, 4 Gy) were measured at 2 h, 2 days, and 5 days after irradiation.
4. Post-irradiation stability
The depth OD change of cuvettes was measured at 2 h, 2 days, and 5 days post-irradiation to investigate the post-irradiation stability. Figure 9(b) shows that the radiation-induced depth OD change is very stable (∼2% deviation) within 2 days post irradiation and significant fading was observed at 5 days post-irradiation. These results are consistent with the spectra measurement shown in Fig. 6. The dosimeter with a less sensitive formulation was observed to be more stable and the fading was much diminished. The plots for the lower sensitive formulation were not shown here but tests showed that the OD change of the dosimeter with less sensitive formulation can be stable up to 5 days post-irradiation.
C. Temperature effect on radiation response
The OD changes of the cuvettes irradiated at different temperatures were measured by the spectrophotometer at the wavelength of 633 nm and are shown in Fig. 10. It indicates that the dose response of PRESAGE™ is sensitive to temperature and irradiation at higher temperature induces larger OD change. The reason for this is probably that the radiochromic components of PRESAGE™ are more active at higher temperature and hence can generate more OD change upon irradiation. As OD change is proportional to absorbed dose (Sec. III B 2), Fig. 10 indicates that careful control of the temperature at time of irradiation is essential for accurate dosimetry. The OD change versus irradiation temperature was observed to be nonlinear, as shown in Fig. 10. However, the temperature sensitivity of the dosimeter around room temperature (22 °C) can be determined approximately from Fig. 10 to be about 1.7% OD variation per degree. For absolute dosimetry measurements, the temperature should be uniform and controlled to within a degree of the calibration samples to achieve an accuracy of dose measurement within 2%.
Fig. 10.

Dose response sensitivity as a function of temperature. The radiation induced OD change was measured by a spectrophotometer at the wavelength of 633 nm.
IV. CONCLUSIONS
There is a pressing need for a robust and convenient dosimetry material that enables an accurate 3D measurement of complex dose distributions. Relative to previous published gel-dosimetry research, the present studies of the properties of a new dosimeter PRESAGE™ are striking in that a repeatable, stable, and sensitive dose response was achieved in a material that was in extended exposure to the atmosphere, had no special protective container, and experienced a normal laboratory environment. PRESAGE™ is a polyurethane leuco dye (radiochromic component) complex that has the texture of solid plastic and was shown to have good dosimetric properties. The results in this study support the conclusion that PRESAGE™ is a practical and robust clinical 3D dosimeter. A preliminary study of the temperature effect on radiation response indicates that the new dosimeter has a higher optical response to irradiation at a higher temperature. Uniform and careful temperature control is required for the new dosimeter to achieve an accurate dose measurement. The characteristics of large volume of PRESAGE™ will need to be further investigated to evaluate its feasibility for dose verification for 3D radiotherapy techniques, including IMRT, brachytherapy, and radiosurgery. Ideally the CT number of PRESAGE™ would be reduced from the (100–470) range observed in this work. In most external beam applications, elevated density CT numbers <100 may not be of significant concern, but implications will need to be considered for brachytherapy and other low energy measurements.
ACKNOWLEDGMENT
The work was supported by NIH Grant No. NIH R01CA100835-02.
References
- 1.Webb S. Intensity-Modulated Radiation Therapy. Institute of Physics Publishing; Bristol, UK: 2001. [Google Scholar]
- 2.Letourneau D, Gulam M, Yan D, Oldham M, Wong JW. Evaluation of a 2D diode array for IMRT quality assurance. Radiother. Oncol. 2004;70:199–206. doi: 10.1016/j.radonc.2003.10.014. [DOI] [PubMed] [Google Scholar]
- 3.Kapulsky A, Gejerman G, Hanley J. A clinical application of an automated phantom-film QA procedure for radiation of IMRT treatment planning and delivery. Med. Dosim. 2004;29:279–284. doi: 10.1016/j.meddos.2004.04.008. [DOI] [PubMed] [Google Scholar]
- 4.Oldham M, Siewerdsen J, Shetty A, Jaffray D. High resolution gel-dosimetry by optical-CT and MR scanning. Med. Phys. 2001;28:1436–1442. doi: 10.1118/1.1380430. [DOI] [PubMed] [Google Scholar]
- 5.Maryanski MJ, Zastavker YZ, Gore JC. Radiation dose distributions in three dimensions from tomographic optical density scanning of polymer gels. II. Optical properties of the BANG polymer gel. Phys. Med. Biol. 1996;41:2705–2717. doi: 10.1088/0031-9155/41/12/010. [DOI] [PubMed] [Google Scholar]
- 6.Kelly BG, Jordan KJ, Battista JJ. Optical CT reconstruction of 3D dose distributions using the ferrous-benzoic-xylenol (FBX) gel dosimeter. Med. Phys. 1998;25:1741–1750. doi: 10.1118/1.598356. [DOI] [PubMed] [Google Scholar]
- 7.Oldham M, Siewerdsen J, Kumar S, Wong J, Jaffray D. Optical-CT gel-dosimetry I: Basic investigations. Med. Phys. 2003;30:623–634. doi: 10.1118/1.1559835. [DOI] [PMC free article] [PubMed] [Google Scholar]
- 8.Oldham M, Kim L. Optical-CT gel-dosimetry II: Optical artifacts and geometrical distortion. Med. Phys. 2004;31:1093–1104. doi: 10.1118/1.1655710. [DOI] [PMC free article] [PubMed] [Google Scholar]
- 9.Hilts M. Image filtering for improved dose resolution in CT polymer gel dosimetry. Med. Phys. 2004;31:39–49. doi: 10.1118/1.1633106. [DOI] [PubMed] [Google Scholar]
- 10.Xu Y, Wuu CS, Maryanski MJ. Determining optimal gel sensitivity in optical CT scanning of gel dosimetes. Med. Phys. 2003;30:2257–2263. doi: 10.1118/1.1593837. [DOI] [PubMed] [Google Scholar]
- 11.Pedersen TV, Olsen DR, Skretting A. Measurement of the ferric diffusion coefficient in agarose and gelatine gels by utilization of the evolution of a radiation induced edge as reflected in relaxation rate images. Phys. Med. Biol. 1997;42:1575–1585. doi: 10.1088/0031-9155/42/8/008. [DOI] [PubMed] [Google Scholar]
- 12.Baldock C, Harris PJ, Piercy AR, Healy B. Experimental determination of the diffusion coefficient in two-dimensions in ferrous sulphate gels using the finite element method. Australas. Phys. Eng. Sci. Med. 2001;24:19–30. doi: 10.1007/BF03178282. [DOI] [PubMed] [Google Scholar]
- 13.McJury M, Oldham M, Leach MO, Webb S. Dynamics of polymerization in polyacrylamide gel (PAG) dosimeters: (I) ageing and long-term stability. Phys. Med. Biol. 1999;44:1863–1873. doi: 10.1088/0031-9155/44/8/301. [DOI] [PubMed] [Google Scholar]
- 14.Hepworth SJ, Leach MO, Doran SJ. Dynamics of polymerization in polyacrylamide gel (PAG) dosimeters: (II) modelling oxygen diffusion. Phys. Med. Biol. 1999;44:1875–1884. doi: 10.1088/0031-9155/44/8/302. [DOI] [PubMed] [Google Scholar]
- 15.Maryanski MJ. Response modification in polymer gel dosimeters. Med. Phys. 2002;29:1209. [Google Scholar]
- 16.De Deene Y, Hanselaer P, De Wagter C, Achten E, De Neve W. An investigation of the chemical stability of a monomer/polymer gel dosimeter. Phys. Med. Biol. 2000;45:858–878. doi: 10.1088/0031-9155/45/4/304. [DOI] [PubMed] [Google Scholar]
- 17.Heufelder J, Stiefel S, Pfaender M, Lüdemann L, Grebe G, Heese J. Use of BANG® polymer gel for dose measurements in a 68 MeV proton beam. Med. Phys. 2003;30:1235. doi: 10.1118/1.1575557. [DOI] [PubMed] [Google Scholar]
- 18.Maryanski MJ, Audet C, Gore JC. Effects of crosslinking and temperature on the dose response of a BANG polymer gel dosimeter. Phys. Med. Biol. 1997;42:303–311. doi: 10.1088/0031-9155/42/2/004. [DOI] [PubMed] [Google Scholar]
- 19.Oldham M, Baustert I, Lord C, Smith TA, McJury M, Warrington AP, Leach MO, Webb S. An investigation into the dosimetry of a nine-field tomotherapy irradiation using BANG-gel dosimetry. Phys. Med. Biol. 1998;43:1113–1132. doi: 10.1088/0031-9155/43/5/005. [DOI] [PubMed] [Google Scholar]
- 20.Chu KC, Jordan YKJ, Battista JJ, Van Dyk J, Rutt BK. Polyvinyl alcohol-Fricke hydrogel and cryogel: two new gel dosimetry systems with low Fe3+ diffusion. Phys. Med. Biol. 2000;45:955–969. doi: 10.1088/0031-9155/45/4/311. [DOI] [PubMed] [Google Scholar]
- 21.Fong PM, Keil DC, Gore JC. Radiation dosimetry using MRI of normoxic polymer gels. Magn. Reson. Med. 2001;9:901. [Google Scholar]
- 22.Oldham M. Optical-CT scanning of polymer gels. Journal of Physics: Conference series. 2004;3:122–135. doi: 10.1088/1742-6596/3/1/011. [DOI] [PMC free article] [PubMed] [Google Scholar]
- 23.Adamovics J, Maryanski M. New 3D radiochromic solid polymer dosimeter from leuco dyes and a transparent polymeric matrix. Med. Phys. 2003;30:1349. [Google Scholar]
- 24.Krstajic N, Wai P, Adamovics J, Doran S. Spectrophotometry of PRESAGE™ polyurethane dosimeters. Journal of Physics: Conference series. 2004;3:244–247. [Google Scholar]
- 25.Adamovics J, Maryanski M. A new approach to radiochromic three-dimensional dosimetry-polyurethane. Journal of Physics: Conference Series. 2004;3:172–175. [Google Scholar]
- 26.Doran S, Krstajic N, Adamovics J, Jenneson P. Optical CT scanning of PRESAGE™ polyurethane samples with a CCD-based readout system. Journal of Physics: Conference series. 2004;3:240–243. [Google Scholar]
- 27.Oldham M, McJury M, Baustert I, Webb S, Leach M. Improving calibration accuracy in gel-dosimetry. Phys. Med. Biol. 1998;43:2709–2720. doi: 10.1088/0031-9155/43/10/002. [DOI] [PubMed] [Google Scholar]
- 28.Adamovics J. Three-dimensional dosimeter for penetrating radiation and method of use. US Patent Application, #20040211917


