Abstract
3-Methylcrotonyl-coenzyme A carboxylase (MCCase) is a nuclear-encoded, mitochondrial biotin-containing enzyme composed of two types of subunits: the biotinylated MCC-A subunit (encoded by the gene At1g03090) and the non-biotinylated MCC-B subunit (encoded by the gene At4g34030). The major metabolic role of MCCase is in the mitochondrial catabolism of leucine, and it also might function in the catabolism of isoprenoids and the mevalonate shunt. In the work presented herein, the single-copy gene encoding the Arabidopsis MCC-A subunit was isolated and characterized. It contains 15 exons separated by 14 introns. We examined the expression of the single-copy MCC-A and MCC-B genes in Arabidopsis by monitoring the accumulation of the two protein and mRNA products. In addition, the expression of these two genes was studied in transgenic plants containing the 1.1- and 1.0-kb 5′ upstream sequences of the two MCCase subunit genes, respectively, fused to the β-glucuronidase gene. Light deprivation induces MCCase expression, which is suppressed by exogenous carbohydrates, especially sucrose. Several lines of evidence indicate that the suppressor of MCCase expression is synthesized in illuminated photosynthetic organs, and can be translocated to other organs to regulate MCCase expression. These results are consistent with the hypothesis that the suppressor of MCCase expression is a carbohydrate, perhaps sucrose or a carbohydrate metabolite. We conclude that MCCase expression is primarily controlled at the level of gene transcription and regulated by a complex interplay between environmental and metabolic signals. The observed expression patterns may indicate that one of the physiological roles of MCCase is to maintain the carbon status of the organism, possibly via the catabolism of leucine.
3-Methylcrotonyl-coenzyme A carboxylase (MCCase; EC 6.4.1.4) catalyzes the ATP-dependent carboxylation of 3-methylcrotonyl-CoA (MC-CoA) to form 3-methylglutonyl-CoA (MG-CoA), in a two-step reaction mechanism:
 |
 |
 |
 |
MCCase is a heteromeric enzyme composed of two types of subunits: a biotinylated subunit (MCC-A) and a non-biotinylated subunit (MCC-B). The MCC-A subunit catalyzes the first half reaction, the MCC-B subunit catalyzes the second, and the biotin prosthetic group acts as an intermediate carrier of the substrate carboxyl group that carboxylates MC-CoA.
MCCase was discovered 40 years ago in bacteria and mammals (Moss and Lane, 1971); however, its presence in plants was more recently reported, first with detection of MCCase activity in plant extracts (Wurtele and Nikolau, 1990), and subsequently its purification and characterization from several plant species (Alban et al., 1993; Chen et al., 1993; Diez et al., 1994). Genic sequences coding for the two MCCase subunits were first isolated from plants (Song et al., 1994; Wang et al., 1994; Weaver et al., 1995; McKean et al., 2000).
In animals and in some bacteria and fungi, MCCase is required for several metabolic processes, including the catabolism of Leu (Lau et al., 1980), the operation of the mevalonate shunt (Popják, 1971; Edmond and Popják, 1974), and isoprenoid catabolism (Seubert and Remberger, 1963). In plants, these metabolic processes have been little studied (Mazelis, 1980; Nes and Bach, 1985; Bach, 1987, 1995). Plants catabolize Leu via two compartmentally separated pathways: a peroxisomal pathway that does not require MCCase (Gerbling and Gerhardt, 1988, 1989; Gerbling, 1993), and a mitochondrial, MCCase-requiring pathway, which catabolizes Leu to acetoacetate and acetyl-CoA. This latter pathway is analogous to that found in animals and bacteria (Anderson et al., 1998), and its discovery provided direct evidence for the metabolic function of MCCase in plants.
Previous studies have indicated that MCCase is expressed to higher levels in non-photosynthetic organs (Wang et al., 1995; Anderson et al., 1998), and that light may suppress MCCase expression (Clauss et al., 1993; Aubert et al., 1996; Maier and Lichtenthaler, 1998). As a first step toward understanding MCCase regulation, and hence obtain more detailed insights into the regulation of mitochondrial Leu catabolism, we isolated and characterized the genomic organization of the MCC-A gene and analyzed environmental and metabolic effectors of MCC-A and MCC-B gene expression patterns. The data presented herein indicate that the expression of the MCC-A and MCC-B genes is coordinately regulated by metabolic suppression at the level of gene transcription and imply that the role of MCCase in plant metabolism is to respond to low carbohydrate availability associated with autophagic processes.
RESULTS
Structure of the Arabidopsis MCC-A Gene
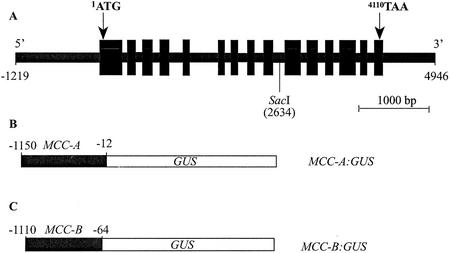
The MCC-A gene was isolated from an Arabidopsis genomic library and its complete sequence was determined. The structure of the MCC-A gene was identified by comparing the sequence with the corresponding cDNA (Weaver et al., 1995). The transcribed region of the MCC-A gene spans 6,165 bp of genomic sequence and consists of 15 exons separated by 14 introns (Fig. 1A). The promoter region contains an apparent TATA box motif between position −243 and −236 (TTAATAAA). All but one exon/intron junction displays the canonical 5′-GT-intron-AG-3′ sequence. The only exception to this rule is the 3′ end of intron 12, which has the sequence 5′-GT-intron-GG-3′. This gene structure differs from that predicted by the Arabidopsis genome sequence deposited at GenBank (accession no. NC_003070). Namely, annotation of Arabidopsis genome sequence fails to identify the last exon of the MCC-A gene, which primarily codes for the 3′-untranslated region. Furthermore, the full-length cDNA (accession no. AY070723, deposited at GenBank by the RIKEN Genomic Sciences Center) contains a 62-nucleotide segment that is absent from the MCC-A cDNA we reported previously (GenBank accession no. U12536; Weaver et al., 1995). This extra sequence in the AY070723 cDNA is predicted to be part of intron 5, as predicted by the Arabidopsis genome sequence and substantiated by the sequence of U12536 cDNA. These results may indicate that the MCC-A gene can undergo alternative splicing to generate mRNAs that are the products of 16 or 15 exons. We previously reported the occurrence of incompletely spliced MCC-A mRNAs in tomato (Lycopersicon esculentum; Wang et al., 1994).
Figure 1.
A, Schematic representation of the structure of the MCC-A gene of Arabidopsis. Black boxes represent the 15 exons, and introns are indicated by the solid black lines that join them. Positions of the translation start codon (1ATG) and stop codon (4110TAA) and the unique SacI site are indicated. B, Schematic representation of the MCC-A:GUS transgene, which is composed of the 1.1-kb promoter region (−1,150 to −12) of the MCC-A gene fused to the GUS reporter gene. C, Schematic representation of MCC-B:GUS transgene, which is composed of the 1.0-kb promoter region (−1,110 to −64) of the MCC-B gene fused to the GUS reporter gene.
Light-Mediated Regulation of MCCase Expression
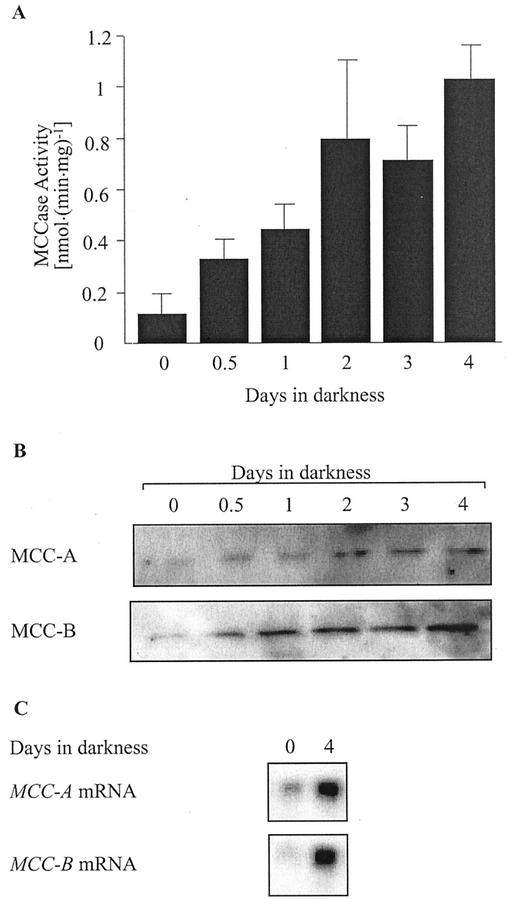
As a first step to investigate the light-mediated regulation of MCCase expression, we examined the effect of illumination on MCCase activity. Arabidopsis seeds were germinated under continuous illumination and at various time points over the next 6 d, a subset of the growing seedlings were removed from illumination. As shown in Figure 2A, over a 4-d period, dark treatment gradually induces MCCase activity by about 10-fold.
Figure 2.
Effect of light deprivation on MCCase expression. A, Changes in MCCase activity in 10-d-old Arabidopsis seedlings, which were initially grown under constant illumination and then transferred to darkness for the indicated time period. The data presented are means ± se from three replicates. B, Western-blot analysis of MCC-A and MCC-B accumulation in Arabidopsis, which were initially grown under constant illumination and then transferred to darkness for the indicated time period. Proteins were extracted from the samples and aliquots containing equal amounts of protein were fractionated by SDS-PAGE, followed by western-blot analysis with antiserum against MCC-A or MCC-B. C, Northern-blot analysis of MCC-A and MCC-B mRNA abundance in 10-d-old Arabidopsis seedlings, which were initially grown under constant illumination and then transferred to darkness for 4 d. Equal amounts of RNA (30 μg) isolated from each sample were fractionated by electrophoresis in a formaldehyde-containing agarose gel. The data presented in B and C were gathered from a single experiment; three replicates of this experiment gave similar results.
To investigate the mechanism of the dark induction of MCCase activity, the accumulation of the MCC-A and MCC-B subunits was determined by western-blot analyses. Aliquots of extracts containing equal amounts of protein were fractionated by SDS-PAGE, followed by western-blot analysis with antisera specific for the MCC-A and MCC-B subunits. These analyses (Fig. 2B) demonstrate that the accumulation of both MCC-A and MCC-B proteins increases in response to darkness in parallel with the increase in MCCase activity. To ascertain whether the induction of MCC-A and MCC-B subunit accumulation is mediated by changes in the accumulation of the corresponding mRNAs, we determined the abundance of the respective mRNAs in the tissues collected from the same experiments. As shown in Figure 2C, the accumulation of MCC-A and MCC-B mRNAs was induced in tissues deprived of illumination, in parallel with the increases in the accumulation of these two subunits. These data indicate that, in response to darkness, MCCase expression is up-regulated, possibly at the level of gene transcription.
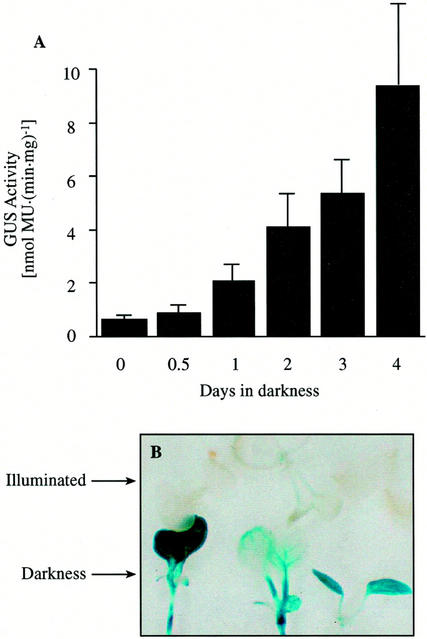
To evaluate whether the enhanced expression of MCCase in response to darkness is due to elevated transcription of the MCC-A and MCC-B genes, we conducted experiments in which the level of MCC-A promoter or MCC-B promoter-driven β-glucuronidase (GUS) expression was determined. Specifically, we generated two sets of transgenic Arabidopsis lines, each of which carried either an MCC-A:GUS or an MCC-B:GUS transgene (Fig. 1, B and C). As shown in Figure 3A, MCC-A-mediated GUS expression is induced about 3-fold after 24 h of light deprivation, and increases to a 10-fold induction after 4 d of light deprivation. Near-identical kinetics of dark-mediated induction of the MCC-B:GUS transgene were also observed in parallel experiments (data not shown).
Figure 3.
Effect of light deprivation on MCC-A promoter-mediated GUS expression. A, GUS activity in 10-d-old MCC-A:GUS transgenic Arabidopsis seedlings, which were initially grown under constant illumination and then transferred to darkness for the indicated time period. The data are means ± se from three replicates using three independent transgenic lines. B, Histochemical localization of MCC-A:GUS expression in transgenic Arabidopsis plants. GUS activity is indicated by the indigo blue precipitate that accumulates after staining with X-Gluc. Seedlings carrying the MCC-A:GUS transgene were grown in continuous light for 5.5 d; one-half of the seedlings were then moved into darkness. GUS expression was stained 8 d after planting. The upper three seedlings (from three independent transgenic lines) were in continues illumination and the lower three seedlings (from same three independent transgenic lines) were in darkness for the last 60 h before staining.
In situ staining of GUS activity in these seedlings indicated that the darkness-induced enhancement of MCC-A- and MCC-B-directed GUS expression occurred throughout the entire seedlings, including the cotyledons, leaves, hypocotyls, and roots (Fig. 3B). These results suggest that the sequences between −1,150 and −12 of the MCC-A gene and −1,110 and −64 of the MCC-B gene are sufficient to confer light-regulated expression to the GUS reporter gene. Furthermore, these results indicate that light-mediated induction of MCC-A and MCC-B gene expression is at least partially regulated by changes in the transcription of the respective genes.
Regulation of MCCase Expressions by Sugars
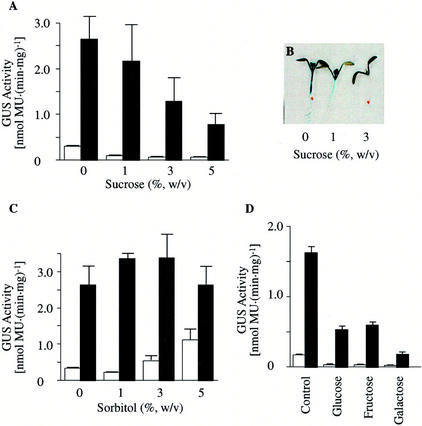
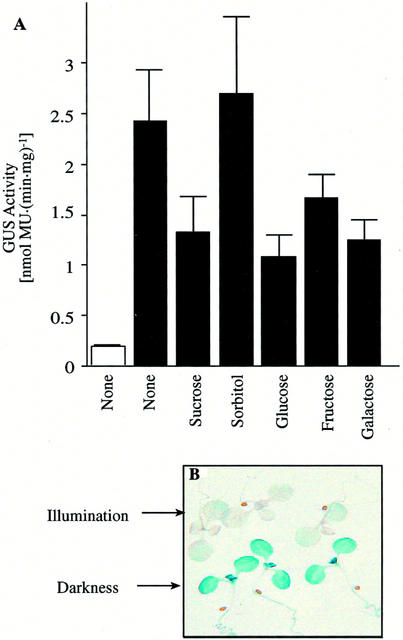
Sugars, particularly Suc, the major translocated sugar, have been recognized as regulatory molecules that can control gene expression (for review, see Koch, 1996). To determine if sugars interact with the light-mediated changes in MCCase expression, GUS expression was studied in MCC-A:GUS and MCC-B:GUS transgenic plants grown in the presence of different concentrations of Suc either in continuous illumination or after transfer to darkness. As shown in Figures 4A and 5A, Suc suppresses MCC-A and MCC-B promoter-mediated GUS expression, especially in seedlings transferred into darkness. Histochemical staining of MCC-A:GUS expression in seedlings grown on different concentrations of Suc showed that at low concentrations of Suc, suppression is confined to the roots and that as the exogenous Suc concentration is raised, MCC-A expression is suppressed in the hypocotyls, shoot meristem, and young leaves (Fig. 4B).
Figure 4.
The effect of illumination and carbohydrates on MCC-A promoter-mediated GUS expression. MCC-A:GUS transgenic Arabidopsis seedlings were grown for 8 d on Murashige and Skoog medium containing the indicated concentration of Suc (A), sorbitol (C), and 1.5% (w/v) of the indicated monosaccharides (D). Seedlings were grown either under continuous illumination (□) or transferred to darkness for the last 2 d of growth (■), and GUS activity was determined in protein extracts. The bars represent the mean ± se from three replicates using three independent transgenic lines. B, Histochemical staining of GUS activity in 8-d-old MCC-A:GUS transgenic Arabidopsis plants that were maintained in darkness for the last 2 d of growth. Seedlings were grown in Murashige and Skoog agar medium containing the indicated concentration of Suc.
In these experiments, we noted that growth of the seedlings is inhibited by the presence of higher concentrations of Suc (>3%; Fig. 4B). This is probably due to the osmotic effect of the sugar. To investigate whether suppression of MCC-A:GUS and MCC-B:GUS expression is due directly to Suc, rather than the increased osmotic pressure of the medium, we measured the effect of sorbitol (a non-metabolizable alditol) on the expression of these transgenes. Although the presence of sorbitol increases the osmotic pressure of the medium and inhibits the growth of Arabidopsis seedlings (data not shown), it has the opposite effect from Suc on MCC-A- and MCC-B-mediated GUS expression (Figs. 4C and 5A). Namely, increasing the concentration of sorbitol slightly increases MCC-A:GUS and MCC-B:GUS expression. These results indicate that the suppression of MCC-A- and MCC-B-directed GUS expression by Suc is not caused by the osmotic effect of the sugar, but rather is due to either the direct effect of Suc or some metabolite derived from Suc.
Figure 5.
Interaction between illumination and sugars on the regulation of MCC-B promoter-mediated GUS activity. A, MCC-B:GUS transgenic Arabidopsis seedlings were grown for 8 d on Murashige and Skoog medium containing either 3% (w/v) Suc or 1.5% (w/v) of the indicated monosaccharide or sorbitol. Seedlings were grown under continuous illumination (□) or transferred to darkness for the last 2 d of growth (■). GUS activity was determined in protein extracts. The bars represent the mean ± se from three replicates using three independent transgenic lines. B, Histochemical staining of GUS activity in seedlings carrying the MCC-B:GUS transgene. Seedlings were grown in continuous light for 6 d, and then one-half the seedlings were moved into darkness. GUS activity was stained on the 8th d after planting. Upper seedlings (from three independent transgenic lines) were grown under continuous illumination, and the lower seedlings (from same three independent transgenic lines) had been transferred to darkness for the last 2 d of growth.
We also determined the metabolic regulation of MCC-A and MCC-B gene expression by Glc, Fru, Gal, and Xyl (Figs. 4D and 5A). As with Suc, all these sugars suppress the dark-mediated induction of MCC-A:GUS and MCC-B:GUS transgenes.
Response to Light Irradiation
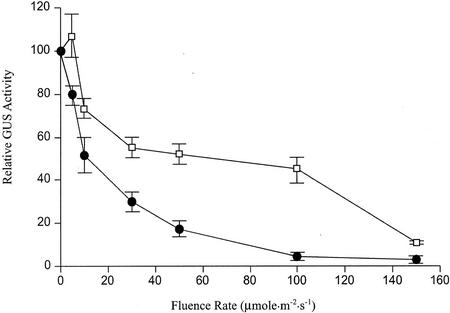
To determine the relationship between light intensity and MCCase expression, we measured MCC-A- and MCC-B-mediated GUS expression in 8-d-old seedlings that had been grown at normal light levels (150 μmol m−2 s−1) for 6 d, and then transferred to different light levels for the last 2 d of growth. A gradient of light intensity was established by placing samples at different distances from the light source. The results shown in Figure 6 demonstrate that expression of MCC-A:GUS and MCC-B:GUS is inversely related to irradiation. A fluence rate of 30 μmol m−2 s−1 inhibits expression to about 50% of that found in total darkness.
Figure 6.
Effect of fluence rate on the transcription of the MCCase subunit genes. MCC-A:GUS (□) and MCC-B:GUS (●) transgenic Arabidopsis seedlings were grown on 1× Murashige and Skoog media under normal illumination levels (150 μmol m−2 s−1) for the first 6 d after planting. Seedlings were then transferred to the indicated light irradiance levels for an additional 2 d of growth. GUS activity was measured in 8-d-old seedlings. GUS activity is expressed as the percentage of that obtained from seedlings grown in darkness. In seedlings transferred to total darkness, MCC-A:GUS and MCC-B:GUS activities were 5.8 ± 0.23 nmol 4-methylumbelliferom (min mg)−1 and 1.83 ± 0.68 nmol 4-methylumbelliferom (min mg)−1, respectively. The data presented here are means ± se from three replicates using three independent transgenic lines.
Long-Distance Communication of the Illumination Status of the Plant Mediates MCCase Expression in Non-Photosynthetic Organs
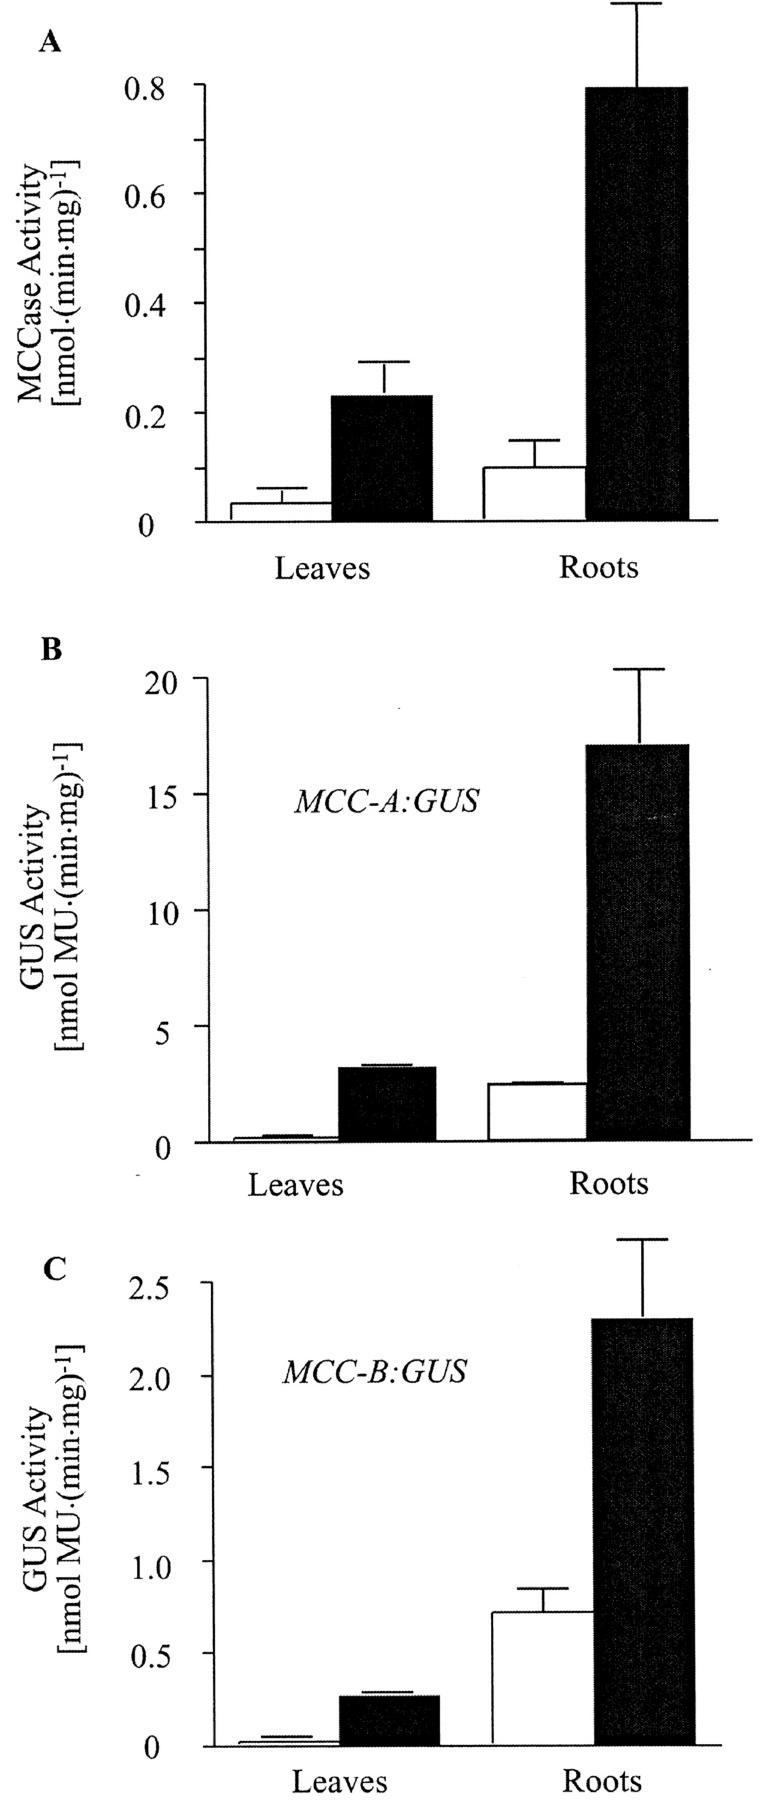
The data presented above indicate that there is an interaction between the illumination status of the plant and sugar levels in regulating MCC-A and MCC-B gene expression in photosynthetic organs. As shown in Figure 7, the illumination status of the plant not only affects MCCase expression in the organs that directly sensed the light (i.e. leaves), but also modulates MCCase expression in roots, an organ that cannot directly sense the illumination status. Specifically, in this experiment MCCase activity was determined in extracts from roots and leaves isolated from identical plants that had been grown in soil for 21 d either under constant illumination or from plants that were deprived of illumination for the last 2 d of growth. As previously reported for tomato (Wang et al., 1995) and pea (Pisum sativum; Anderson et al., 1998), MCCase activity is 3- to 4-fold higher in roots than in leaves. The interesting observation made herein is that MCCase activity is induced by a factor of 6- to 8-fold in both leaves and roots of plants from which light is withheld (Fig. 7A).
Figure 7.
The illumination status of seedlings affects the expression of MCCase in roots and leaves. Arabidopsis seedlings (wild-type [A], MCC-A:GUS [B], or MCC-B:GUS [C] transgenic lines) were grown in soil under constant illumination for 21 d (□) or under constant illumination for 19 d and then transferred to darkness for an additional 2 d of growth (■). MCCase (A) and GUS (B and C) activities were determined in protein extracts prepared from leaves and roots. The data in A are means ± se from three replicates. In B and C, the data are means ± se from three replicates using three independent transgenic lines.
To further delineate the mechanism of MCCase induction in roots of light-deprived plants, we determined MCC-A and MCC-B promoter-mediated GUS expression in transgenic plants treated as in the experiment shown in Figure 7A. GUS expression was induced by a factor of 5- to 7-fold in roots of these light-deprived transgenic plants (Fig. 7, B and C). These findings indicate that the induction of MCCase expression in roots in response to light deprivation of the seedlings is mediated at the level of gene transcription. Furthermore, these results indicate that leaves communicate their illumination status to the roots and affect MCC-A and MCC-B gene transcription. One model to explain these findings is that illuminated leaves produce a mobile signal molecule (possibly Suc or some Suc-derived metabolite), which affects the suppression of MCC-A and MCC-B gene expression. Thus, when plants are placed in the dark, the concentration of the suppressor signaling molecule declines, leading to the induction of MCCase expression in both leaves and roots.
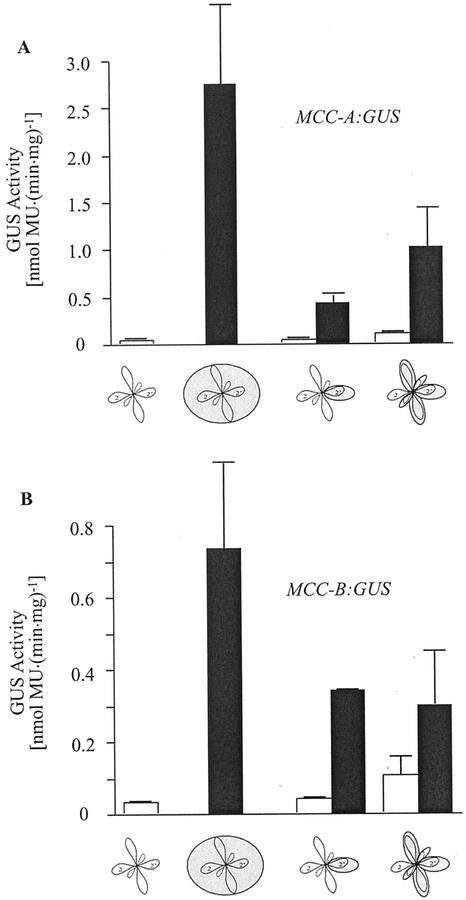
To further develop this hypothesis, we conducted two analogous sets of experiments in which illumination was withheld from a subset of the leaves of 21-d-old Arabidopsis rosettes. In one set of experiments, a single leaf of the second pair of emerged leaves was selectively deprived of illumination, whereas the other leaves were continuously illuminated. In the other experiments, illumination was withheld from all but one of the second pair of emerged leaves. In both experiments, MCC-A- and MCC-B-driven GUS activity was determined in the illuminated and nonilluminated leaves. As shown in Figure 8, A and B, MCC-A:GUS and MCC-B:GUS activity was higher in the leaves from which light was selectively withheld than in the illuminated leaves. However, in both cases, these increases in GUS activity were not as high as in those seedlings in which light was completely deprived from the entire seedling. These data are consistent with the mobile suppressor model outlined above. Namely, the shaded leaf or leaves cease to produce the MCC-A and MCC-B suppressor and thus GUS activities are induced in these leaves. However, because the illuminated leaf or leaves continue to synthesize the suppressor and it is translocated to the shaded leaf or leaves, MCC-A- and MCC-B-mediated GUS activities are not fully induced.
Figure 8.
Intraleaf communication of the illumination status
of the seedling affects MCCase expression. MCC-A:GUS (A) and
MCC-B:GUS (B) transgenic Arabidopsis plants were grown under
constant illumination for 19 d. Then, the indicated subset of
leaves was shaded by wrapping them in aluminum foil, and seedlings were
grown for an additional 2-d period. GUS activity was determined in
protein extracts prepared from shaded
( ) or
illuminated (□) second pair of leaves. The data are means ±
se from three replicates using three independent
transgenic lines.
Effect of Limiting CO2 on MCC-A:GUS and MCC-B:GUS Gene Expressions
To begin the process of identifying the mobile molecular signal that suppresses MCCase expression, we grew Arabidopsis seedlings in a CO2-free atmosphere, but under constant illumination, and examined the effect on the expression of MCCase.
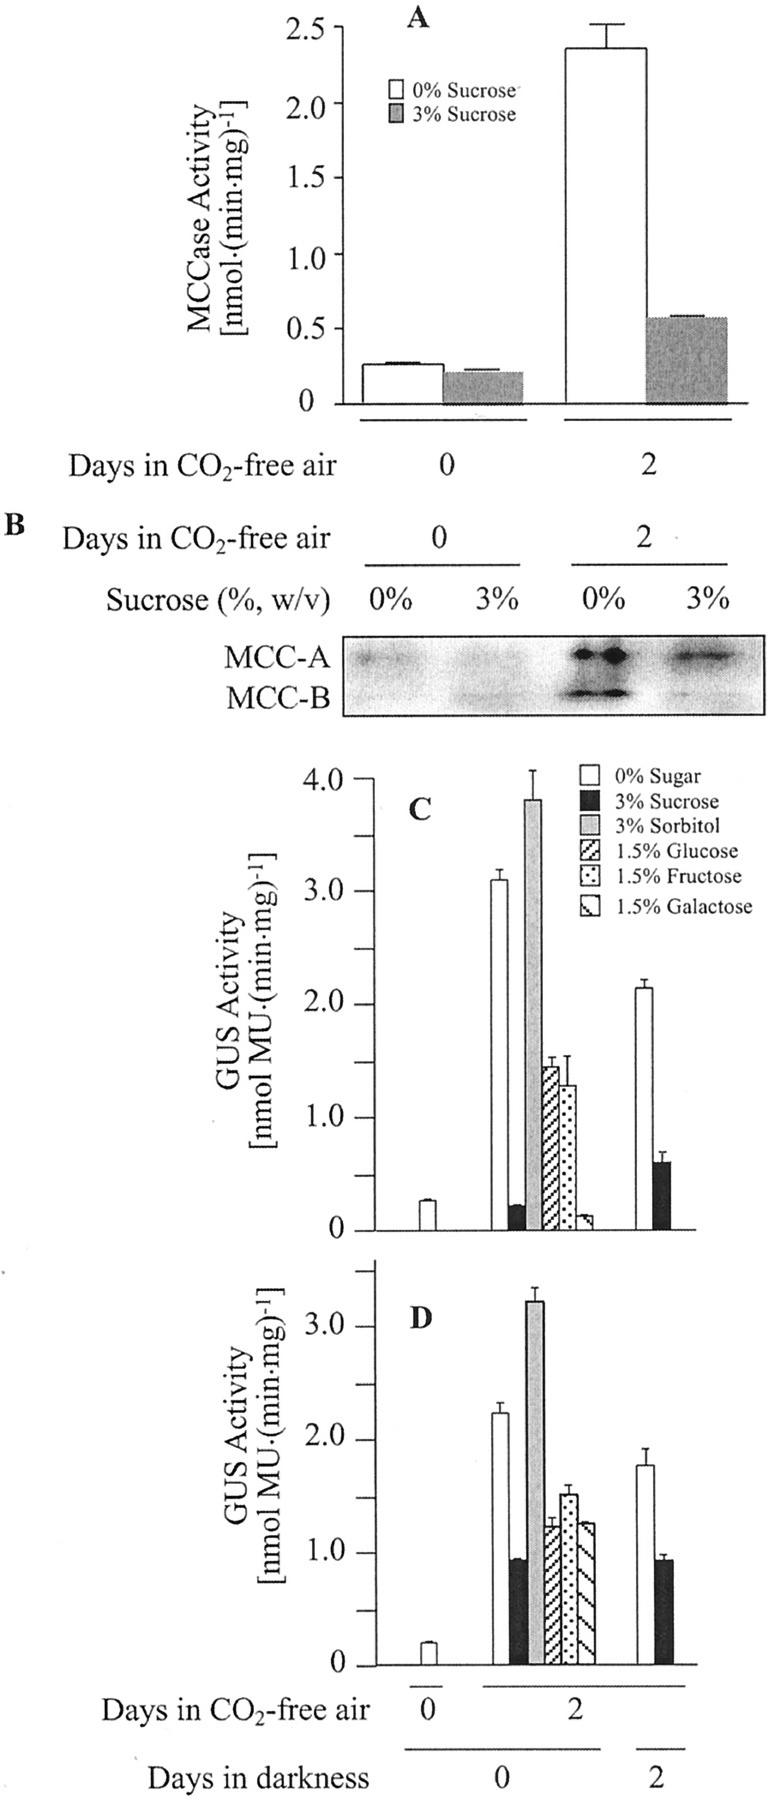
As shown in Figure 9, A and B, MCCase activity and accumulation of the MCC-A and MCC-B subunits were induced 8- to 9-fold 2 d after transfer of seedlings to a CO2-free atmosphere. The provision of exogenous Suc in the growth medium suppressed the induction of MCCase activity and accumulation of its subunits.
Figure 9.
The effect of limiting atmospheric CO2 on MCCase expression. Arabidopsis seedlings (wild-type [A and B], MCC-A:GUS [C], and MCC-B:GUS [D] transgenic lines) were grown on Murashige and Skoog-agar medium supplemented with the indicated carbohydrates (%, w/v). Seedlings were grown in either a normal atmosphere for 8 d under continuous illumination or in a normal atmosphere for the first 6 d of growth followed by 2 d of growth in a CO2-free atmosphere either under continuous illumination or in darkness. MCCase (A) and GUS (C and D) activities were determined in protein extracts prepared from these seedlings. The accumulation of the MCC-A and MCC-B subunits was detected by western analysis of protein extracts (B). The data in A are means ± se from three replicates. The data in B were gathered from a single experiment; three replicates of this experiment gave similar results. The data in C and D are means ± se from three replicates using three independent transgenic lines.
In experiments identical to those shown in Figure 9, A and B, MCC-A and MCC-B promoter-mediated GUS expression was determined in 8-d-old transgenic seedlings which were grown in a CO2-free air atmosphere for the last 2 d of growth. As shown in Figure 9, C and D, in the absence of atmospheric CO2, MCC-A and MCC-B promoter-mediated GUS expression increased 10- and 11-fold, respectively. As with the induction of MCCase activity and accumulation of the MCCase subunits, the induction of MCC-A- and MCC-B-mediated GUS expressions in response to a CO2 deprivation was reversed by the inclusion of Suc in the growth medium (Fig. 9, C and D). Namely, in the presence of exogenous Suc, MCC-A:GUS and MCC-B:GUS expression is not induced by the CO2-free atmosphere.
We utilized this experimental system as a convenient means of identifying whether other biochemicals could substitute for Suc and act as suppressors of the induction process. We found that at equal molar concentrations, Glc, Fru, Gal, and Xyl were also able to suppress the CO2-free atmosphere induction of MCC-A- and MCC-B-mediated GUS expressions. However, these monosaccharides were not as strong suppressors as Suc (Fig. 9, C and D). To ensure that the effects of these sugars on MCCase expression were not due to an osmotic stress of the tissue, sorbitol was also tested. Sorbitol had no effect on the CO2-free atmosphere induction of MCC-A:GUS and MCC-B:GUS expression.
Interestingly, if the 2-d CO2-free atmospheric treatment is conducted in darkness, MCC-A- and MCC-B-mediated GUS activities are still induced, and exogenous Suc suppresses this induction (Fig. 9, C and D), although this effect is not as strong as when conducted on illuminated plants.
Effect of Sugars and Glc Analogs on MCCase Gene Expression in Detached Roots
The data presented above indicate that illuminated leaves produce a suppressor of MCCase expression and that this signaling molecule is mobile and can suppress MCCase expression at a distance. To further test the hypothesis that this suppressor may be Suc, or a metabolite of Suc, we adapted a detached root system for testing the ability of various sugars to act as suppressors of MCCase induction. Specifically, roots were detached at the hypocotyl-root intersection from sterilely grown 14-d-old seedlings. Intact seedlings and the detached roots were separately maintained in culture media in the absence or presence of a variety of sugars and Glc analogs. Two days later, MCCase expression was determined in extracts from the roots.
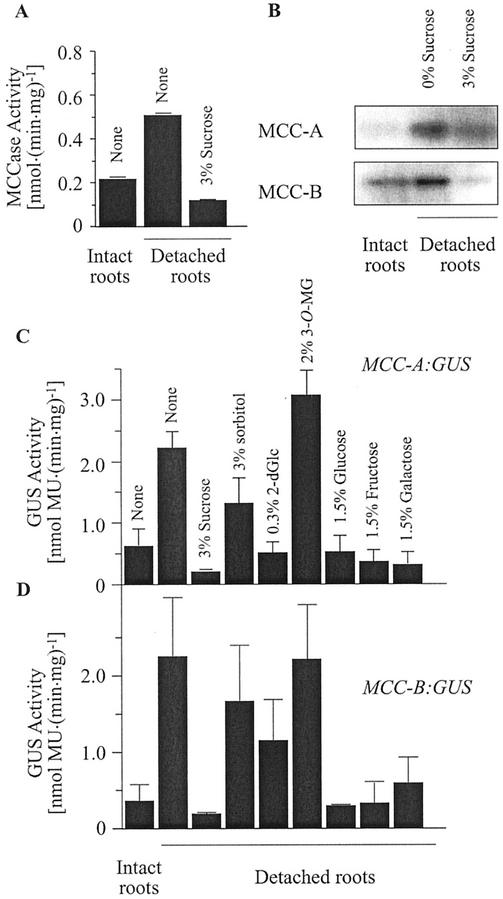
As shown in Figure 10, A and B, in the absence of any exogenous sugars, MCCase activity and accumulation of the MCC-A and MCC-B subunits is induced about 2.5-fold in detached roots as compared with roots attached to the aerial organs of the seedlings. The addition of Suc to the medium in which detached roots were maintained suppressed this induction of MCCase activity (Fig. 10A) and accumulation of the two MCCase subunits (Fig. 10B).
Figure 10.
Regulation of MCCase expression in detached roots. Roots were detached from the aerial portions of 14-d-old wild-type (A and B) or MCC-A:GUS (C) and MCC-B:GUS (D) transgenic Arabidopsis seedlings and incubated for 1 d in Murashige and Skoog media containing the indicated sugars (%, w/v). MCCase (A) and GUS (C and D) activities were determined in protein extracts. The accumulation of the MCC-A and MCC-B subunits was determined by western-blot analysis (B). The data in A are means ± se from three replicates. The data in B were gathered from a signal experiment; three replicates of this experiment gave similar results. The data in C and D are means ± se from three replicates using three independent transgenic lines.
To further elucidate the mechanism by which MCCase expression is induced in detached roots, we studied MCC-A and MCC-B promoter-mediated GUS expressions in such organs. As shown in Figure 10, C and D, MCC-A- and MCC-B-mediated GUS expression is 4-fold higher in detached roots than in roots of intact seedlings. Incubating the detached roots in presence of Suc reversed this induction. These findings indicate that the alterations in MCCase expression in detached roots are primarily the result of changes in the transcription of the MCC-A and MCC-B genes.
These experiments also provide evidence that Suc, or some metabolite of Suc, may be the molecule that is translocated from the aerial portion of the seedling and suppresses MCCase gene transcription in the root. To gain insights as to whether Suc or a metabolite of Suc is the suppressor of MCCase transcription, we used this detached root system to test the ability of various sugars and Glc analogs to suppress MCCase gene transcription. Of the molecules tested, sorbitol and 3-O-methyl-Glc had no suppressing activity on MCC-A:GUS (Fig. 10C) and MCC-B:GUS (Fig. 10D) expression. However, Glc, Fru, Gal, Xyl, and 2-deoxy-Glc were all capable of suppressing MCCase gene transcription in these detached roots (Figs. 10, C and D). Because the non-metabolizable sugar analogs, sorbitol and 3-O-methyl-Glc, do not affect MCCase expression, whereas Glc, Fru, Gal, Xyl, and 2-deoxy-Glc, which are all metabolizable or can be metabolically derived from Suc, do affect MCCase expression, these results cannot clearly distinguish whether Suc or a metabolite of Suc is the MCCase-suppressing molecule.
DISCUSSION
One metabolic function of MCCase in plants is in the mitochondrial catabolism of Leu (Anderson et al., 1998). Additional potential functions for MCCase include the interconnection between isoprenoid catabolism and general metabolism (Gray, 1987; Kleinig, 1989; Bach, 1995), and the mevalonate shunt (Nes and Bach, 1985; Bach, 1987). The studies undertaken herein investigated the mechanisms by which environmental and metabolic signals regulate the expression of MCCase, which we interpret in the context of the complex metabolic network in which this enzyme appears to operate.
Previous studies have suggested that MCCase expression may be under complex regulation (Alban et al., 1993; Clauss et al., 1993; Wang et al., 1995; Aubert et al., 1996; Anderson et al., 1998; Maier and Lichtenthaler, 1998). To methodically dissect the mechanisms that regulate MCCase expression, we used MCC-A- and MCC-B-specific antisera and cDNA reagents (Weaver et al., 1995; McKean et al., 2000) to measure the accumulation of MCCase mRNA and protein gene products in tissues that were exposed to different environmental and metabolic signals. These data were systematically compared with data obtained from transgenic lines that carry MCC-A and MCC-B promoter-reporter transgenes that reflect the transcription of the MCCase subunit genes.
These studies establish that the environmentally and metabolically induced changes in MCCase expression are primarily regulated by the alterations in the transcription of the two MCCase subunit genes. Specifically, in all experimental systems that result in the modulation of MCCase expression (light deprivation, CO2 deprivation, detached roots, and exogenous sugars), there is a coordinated alteration in MCCase-specific activity, accumulation of the MCC-A and MCC-B subunits and mRNAs, and MCC-A and MCC-B promoter-mediated expression of GUS reporter activity. Moreover, these modulations coordinately affect the expression of both the MCC-A and MCC-B genes, indicating that there may be molecular mechanisms that harmonize the expression of these two genes positioned on different chromosomes of the Arabidopsis genome. (The MCC-A gene is located at position 0.7 Mb of chromosome 1, and MCC-B is at position 15.3 Mb of chromosome 4.)
The three experimental systems (light deprivation, CO2 deprivation, and carbon source deprivation) that we used to dissect the regulation of MCCase expression have a common characteristic: Exogenous Suc suppresses the experimentally induced increases in the transcription of the MCCase genes. Furthermore, light, CO2, and carbon deprivation would all be expected to lower the endogenous Suc levels of the tissue. Therefore, these data indicate that the transcription of the MCCase genes may be regulated inversely by the Suc content of the tissue.
The expression of a large and specific set of plant genes is known to respond both positively and negatively to sugar levels within the tissue (for review, see Koch, 1996; Halford et al., 1999; Sheen et al., 1999; Gibson, 2000). Sugar-mediated modulation in the expression of these genes is primarily regulated at the level of gene transcription. Two models have been proposed for how plants determine the sugar content of the tissue, and transduce that information to alter gene transcription (Sheen, 1990, 1994; Halford et al., 1999; Sheen et al., 1999; Gibson, 2000). In one model, sugar sensing involves an SNF1-related protein kinase1, analogous to the SNF1-mediated sugar-sensing system of yeast and fungi (Purcell et al., 1998). The other model hypothesizes that sugar sensing is mediated via the action of hexokinase. Both mechanisms may be operational in parallel sugar-sensing signal transduction pathways (Gibson, 2000).
Our studies of the regulation of MCCase expression indicate that in addition to the disaccharide Suc, the hexoses, Glc, Fru, and Gal, are also capable of suppressing MCCase transcription. Therefore, the direct effector of MCCase expression could be Suc or these hexoses that are potential products of Suc metabolism. Furthermore, we found that 2-deoxy-Glc, but not 3-o-methyl-Glc, can also suppress MCCase transcription. Because the later Glc analog cannot be phosphorylated and metabolized, whereas 2-deoxy-Glc can be phosphorylated but not metabolized (Dixon and Webb, 1979; Graham et al., 1994), these data indicate that MCCase expression may be affected by the phosphorylation of hexoses, consistent with the hexokinase model of sugar-mediated regulation of gene expression. Consistent with this hypothesis, glycerol, which can be readily converted to triose phosphates, does not have any effect on MCCase expression (data not shown), indicating that the sugar effector of MCCase expression is probably a hexose rather than a triose.
The pattern of MCCase expression may be an indication of the expression of the entire mitochondrial Leu catabolic pathway. Consistent with this conclusion are the independent observations that other enzymes (genes) of this pathway (specifically isovaleroyl-CoA dehydrogenase and branched-chain α-keto acid dehydrogenase) appear to show similar environmentally and metabolically induced changes in expression (Fujiki et al., 1997; Luethy et al., 1997; Mooney et al., 1998; Däschner et al., 2001). Hence, the metabolic rationale for the observed MCCase expression patterns may be that catabolic pathways are induced for the organism to maintain homeostasis with respect to its carbon status. For example, plants respond to carbohydrate starvation by increasing activities of enzymes involved in β-oxidation of fatty acids, the catabolism of proteins and amino acids, and the glyoxylate pathway, which is needed for converting the derived carbon to carbohydrate (for review, see Yu, 1999). Therefore, the data presented herein would indicate that part of the autophagic response of plants might be the environmentally and metabolically regulated induction of catabolic pathways, specifically mediated by sugar-sensing signal transduction pathways. The degradation of proteins during autophagy results in increased accumulation of free amino acids (Genix et al., 1990), which are capable of entering the tricarboxylic cycle and glyoxylate pathway to sustain respiration and metabolic processes during environmental stress.
Last, the sugar-signaling pathways that regulate carbon deprivation-induced amino acid catabolism may be interconnected with other signal transduction pathways, such as those mediated by phytohormones (Perate et al., 1997; Gibson, 2000). The mechanistic comprehension of the structure and regulation of these sugar-sensing signaling pathways may be aided by the characterization of mutants that are dysfunctional in these signaling pathways.
MATERIALS AND METHODS
Cloning and Sequence Analysis
An Arabidopsis genomic library, cloned in the bacteriophage vector λ FIX (Voytas et al., 1990), was obtained from the Biological Resource Center (Ohio State University, Columbus). The library was screened by hybridization with the Arabidopsis MCC-A cDNA (Weaver et al., 1995). Hybridizing clones were isolated by plaque purification. Isolation and purification of bacteriophage DNA was conducted using standard methods (Sambrook et al., 1989). DNA manipulation and subcloning of DNA fragments into pBluescript KS (pBKS; Stratagene, La Jolla, CA) was carried out according to standard procedures (Sambrook et al., 1989). The MCC-A gene was isolated as a single λ-clone. Two adjoining SacI fragments were subcloned into pBKS and named pBP4 and pBP5. The junction of pBP4 and pBP5 was amplified by PCR using λ-DNA containing MCC-A genomic DNA as the template. This amplified fragment was sequenced, which verified that pBP4 and pBP5 carried adjoining Arabidopsis genomic fragments. The nucleotide sequence of both strands of all plasmid clones was determined using an Applied Biosystem 373A Automated DNA Sequencer (DNA Sequencing Facility, Iowa State University, Ames). DNA sequences were analyzed using the GCG suite of sequence analysis software (University of Wisconsin Genetics Computer Group, Madison, WI).
Construction of the MCC-A and MCC-B Promoter-GUS Chimeric Genes
A Sau3AI fragment of pBP4, which contains the 5′ end of the MCC-A gene from positions −1,150 to −12, was subcloned into the BamHI site of pBKS. The resulting plasmid, termed pBP6, was digested at the flanking HindIII and XbaI sites, and the MCC-A promoter fragment was subcloned into the Ti-based plant transformation vector, pBI101.2 (CLONTECH, Palo Alto, CA). The resulting plasmid (pBP8) carried the MCC-A:GUS chimeric gene (Fig. 1B).
The promoter of the MCC-B gene was excised from the plasmid, pMAGP (McKean et al., 2000) as a 1.2-kb XhoI-XmnI fragment and subcloned into the XhoI and SmaI sites of pBKS (pBP15). This promoter fragment was PCR amplified with the vector-associated T3 primer and the mutagenic primer of sequence, 3′-CTGTTAGTTCATCAGATCTAGT-5′ (A and T were added to create an XbaI site, which is underlined). The resulting PCR product was digested with XhoI and XbaI, and cloned into the SalI and XbaI sites of pBI101.2. In the resulting plasmid (pBP18), the MCC-B promoter (from −1,110 to −64 relative to the ATG translation start site) was fused with GUS reporter gene (Fig. 1C).
Plant Transformation and Regeneration
The plant transformation vectors, pBP8 and pBP18, were transformed into Agrobacterium tumefaciens C58C1 by electroporation. Transformation of Arabidopsis was done as described by Koncz and Schell (1986), but without applying a vacuum. Primary transgenic plants (T1 generation) were selected by germinating seeds on Murashige and Skoog medium (Gibco-BRL, Cleveland) containing 0.8% (w/v) Bacto-agar, 0.05% (w/v) MES (pH 5.7), 40 mg L−1 kanamycin, 250 mg L−1 vancomycin, and 1% (w/v) Suc. For each transgene construct, 20 independent transgenic lines were generated. T2 seeds obtained from these 20 primary transformants were grown on Murashige and Skoog medium supplemented with 40 mg L−1 kanamycin and scored for resistance to the antibiotic. For each transgenic line, six kanamycin-resistant plants were transferred to soil and T3 seeds were harvested. Ten independent transgenic plants were finally identified as being homozygous for the transgene on the basis of the segregation of the kanamycin resistance trait. The transgenic nature of the kanamycin-resistant plants was further confirmed by Southern-blot analysis (data not shown).
For the analysis of transgenic lines, 10 MCC-A:GUS and 10 MCC-B:GUS independent lines were generated and each was propagated to the T3 generation and confirmed to be homozygous for the transgenes. All these lines showed a very similar histochemical staining pattern for GUS activity when grown in a variety of growth conditions. Three lines for each transgene were selected for detailed fluorometric assays of GUS activity.
Plant Materials and Growth Conditions
Arabidopsis seeds of the Columbia ecotype were germinated in sterile soil or Murashige and Skoog media, and plants were grown in a growth room maintained at 22°C under 24-h, continuous illumination provided by 40-W cold-white fluorescent light bulbs (Sylvania, Danvers, MA) at white-light irradiation of 150 μmol m−2 s−1. In experiments in which plants were grown under different fluence rates of illumination, seedlings were grown at different distances from the light source. In all cases, fluence rate was measured with an L1–1800 spectroradiometer (LI-COR, Lincoln, NE).
Seeds (T2 or T3 generation transgenic plants that are homozygous for the transgene) were surface sterilized by treatment with 50% (v/v) ethanol for 1 min, followed by a 20-min treatment with 50% (v/v) bleach in 1% (v/v) Tween 20. After extensive washing with sterile water, approximately 40 seeds were applied to each petri dish, and plates were sealed with parafilm or gas-permeable surgical tape. In some experiments, the Murashige and Skoog media also contained different concentrations of sugars. Seedlings were grown under constant illumination (150 μmol m−2 s−1) or in complete darkness at 22°C. Day 0 was defined as the time when seeds were sown.
Sterile excised plant organs were maintained in petri dishes containing sterile Murashige and Skoog liquid medium with different concentration of sugars and Glc analogs for 24 h in continuous illumination at 22°C.
Isolation of RNA and Blot Hybridization Analysis
RNA was isolated from whole-plant tissue by the method of Logenmann (1987). Twenty micrograms of each RNA sample was subjected to electrophoresis in a 1.4% (v/v) agarose gel that contained formaldehyde. The RNA was blotted to a nylon membrane by capillary transfer using 25 mm sodium phosphate buffer, pH 7.0. To ensure equal loading of RNA, ethidium bromide was included in the RNA-loading buffer, and blots were viewed under UV illumination. After transfer, RNA was bonded to the membrane by baking at 90°C for 60 min. The filter was hybridized with 32P-labeled MCC-A (Weaver et al., 1995) and MCC-B (McKean et al., 2000) cDNA fragments that have been described previously. The blots were washed once with 1× SSC, 0.1% (w/v) SDS at 60°C for 15 min followed by 0.25× SSC, 0.1% (w/v) SDS at 60°C for another 30 min.
Protein Extracts
Arabidopsis seedling tissue (0.1 g) was frozen with liquid N2 and homogenized with an “Eppendorf pestle” (Eppendorf Scientific, Westbury, NY) in a 1.5-mL microcentrifuge tube. The resulting powder was homogenized at 4°C with 0.3 mL of extraction buffer (0.1 m HEPES-KOH, pH 7.0; 20 mm 2-mercaptoethanol; 0.1 mg mL−1 phenylmethylsulfonyl fluoride; 0.1% [v/v] Triton X-100; 1 mm EDTA; and 20% [v/v] glycerol) using the “Eppendorf pestle.” The mixture was immediately centrifuged at 12,200g for 15 min at 4°C. The supernatant was recovered and frozen in liquid N2 and the pellet was discarded. Protein concentration was determined with the Bradford Reagent (Bio-Rad, Hercules, CA) using bovine serum albumin as a standard (Bradford, 1976).
Histochemical Staining of GUS Activity
Histochemical assay of GUS activity was conducted as described by Jefferson (1987) with minor modification. Whole seedlings and excised plant organs and tissues were incubated in 5-bromo-4-chloro-3-indole glucuronide (X-gluc) solution {0.5 mg mL−1 X-gluc in 50 mm Tris/NaCl buffer, pH 7.0; 0.5% [v/v] Triton X-100; 0.5 mm K3[Fe(CN)6]; 0.5 mm K4[Fe(CN)6]; and 10 mm Na2EDTA). One hundred millimolar X-gluc stock solution was prepared by dissolved 26.1 mg of X-gluc in 0.5 mL of dimethyl sulfoxide just before use. Vacuum infiltration was carried out for 10 min. Tissue was then incubated at 37°C in the dark for up to 16 h or until color developed. To improve the contrast, pigments were removed by incubating the stained material in several changes of 70% (v/v) ethanol until the chlorophyll was cleared from the tissue. The stained tissue was examined under bright-field microscopy, using a BH2 microscope (Olympus, Tokyo).
Fluorometric Analysis of GUS Activity
GUS activity was determined in extracts with a fluorometric assay essentially as described by Jefferson (1987). Plant samples were collected and protein extracts prepared as described above. One hundred microliters of protein extract was mixed with 500 μL of GUS assay buffer (2 mm 4-methylumbelliferyl β-glucuronide in extraction buffer) and incubated at 37°C. Aliquots of 100 μL were removed from the assay at timed intervals (generally 5, 15, 25, 35, and 45 min), and the reaction was terminated by adding 0.9 mL of 0.2 m Na2CO3. The fluorescent product was quantified using a fluorometer (model F-2000, Hitachi, Tokyo). Excitation and emission wavelengths were 365 and 455 nm, respectively. Tissues from regenerated non-transformed plants were used to quantify background GUS activity. All the experiments were repeated three times using three independently transformed plants.
MCCase Assay
MCCase activity was measured as the rate of incorporation of radioactivity from NaH14CO3 into the acid-stable product (Wurtele and Nikolau, 1990). The reaction mixture contained 0.1 m Tricine-KOH, pH 8.0; 5 mm MgCl2; 2.5 mm dithiothreitol, 5 mm KHCO3; 5 μCi NaH14CO3 (58 mCi mmol−1, Amersham, Buckinghamshire, UK); 1 mm ATP; and 0.2 mm methylcrotonyl-CoA. Aliquots of each extract were passed through individual 1-mL Sephadex G-25 columns, pre-equilibrated with extraction buffer, and centrifuged at 800g for 1 min to remove lower Mr molecules. The MCCase assay was initiated by the addition of the protein extract and incubated in a final volume of 200 μL at 37°C for 60 min. The reaction was terminated by the addition of 50 μL of 6 n HCl. A sample (50 μL) was applied to a strip of 3MM paper (Whatman, Clifton, NJ), dried, and the acid-stable radioactivity was determined by liquid scintillation counting. Assays were performed in triplicate. For each protein extract, control assays lacking the methylcrotonyl-CoA substrate were carried out in parallel.
Electrophoresis and Western-Blot Analysis
SDS-PAGE was performed in 10% (w/v) polyacrylamide gels as described previously (Laemmli, 1970). After electrophoresis, proteins were electrophoretically transferred to a nitrocellulose membrane (Kyhse-Andersen, 1984). MCC-A and MCC-B subunits were immunologically detected with specific antisera (Weaver et al., 1995; McKean et al., 2000), diluted 1:2,000 (w/v), followed by an incubation with 125I-protein A. The biotin-containing MCC-A subunit was also detected by using 125I-streptavidin (Nikolau et al., 1985).
Footnotes
This work was supported by the National Science Foundation (grant no. IBN–9982892 to E.S.W. and B.J.N.). This is journal paper no. J–19691 of the Iowa Agriculture and Home Economics Experiment Station (Ames, IA; project nos. 6545 and 6546).
Article, publication date, and citation information can be found at www.plantphysiol.org/cgi/doi/10.1104/pp.001842.
LITERATURE CITED
- Alban C, Baldet P, Axiotis S, Douce R. Purification and characterization of 3-methylcrotonyl-CoA carboxylase from higher plant mitochondria. Plant Physiol. 1993;102:957–965. doi: 10.1104/pp.102.3.957. [DOI] [PMC free article] [PubMed] [Google Scholar]
- Anderson MD, Che P, Song J, Nikolau BJ, Wurtele ES. 3-Methylcrotonyl-coenzyme A carboxylase is a component of the mitochondrial leucine catabolic pathway in plant. Plant Physiol. 1998;118:1127–1138. doi: 10.1104/pp.118.4.1127. [DOI] [PMC free article] [PubMed] [Google Scholar]
- Aubert S, Alban C, Bligny R, Douce R. Induction of beta-methylcrotonyl-coenzyme A carboxylase in higher plant cells during carbohydrate starvation: evidence for a role of MCCase in leucine catabolism. FEBS Lett. 1996;383:175–180. doi: 10.1016/0014-5793(96)00244-x. [DOI] [PubMed] [Google Scholar]
- Bach T. Synthesis and metabolism of mevalonic in plants. Plant Physiol Biochem. 1987;25:163–178. [Google Scholar]
- Bach T. Some new aspects of isoprenoid biosynthesis in plants: a review. Lipid. 1995;30:191–202. doi: 10.1007/BF02537822. [DOI] [PubMed] [Google Scholar]
- Bradford MM. A rapid and sensitive method for quantification for microgram quantities of protein utilization the principle of protein dye-binding. Anal Biochem. 1976;72:248–254. doi: 10.1016/0003-2697(76)90527-3. [DOI] [PubMed] [Google Scholar]
- Chen Y, Wurtele ES, Wang X, Nikolau BJ. Purification and characterization of 3-methylcrotonyl-CoA carboxylase from somatic embryos of Daucus carota. Arch Biochem Biophys. 1993;305:103–109. doi: 10.1006/abbi.1993.1398. [DOI] [PubMed] [Google Scholar]
- Clauss M, Motel A, Lichtenthaler HK. Studies on the plant methylcrotonyl-CoA Carboxylase. J Plant Physiol. 1993;114:508–511. [Google Scholar]
- Däschner K, Couée I, Binder S. The mitochondrial isovaleryl-coenzyme A dehydrogenase of Arabidopsis oxidizes intermediates of leucine and valine catabolism. Plant Physiol. 2001;126:601–612. doi: 10.1104/pp.126.2.601. [DOI] [PMC free article] [PubMed] [Google Scholar]
- Diez TA, Wurtele ES, Nikolau BJ. Purification and characterization of 3-methylcrotonyl-coenzyme-A carboxylase from leaves of Zea mays. Arch Biochem Biophys. 1994;310:64–75. doi: 10.1006/abbi.1994.1141. [DOI] [PubMed] [Google Scholar]
- Dixon M, Webb EC. Enzymes. London: Longman; 1979. pp. 248–251. [Google Scholar]
- Edmond J, Popják G. Transfer of carbon atoms from mevalonate to n-fatty acids. J Biol Chem. 1974;249:66–71. [PubMed] [Google Scholar]
- Fujiki Y, Sato T, Yoshikawa Y, Ito M, Watanabe A. Dark induced expression of genes for branched-chain alpha-keto acid dehydrogenase complex in Arabidopsisleaves (abstract no. 400) Plant Physiol. 1997;114:S-95. [Google Scholar]
- Genix P, Bligny R, Martin J, Douce R. Transient accumulation of asparagine in sycamore cells after a long period of sucrose starvation. Plant Physiol. 1990;94:717–722. doi: 10.1104/pp.94.2.717. [DOI] [PMC free article] [PubMed] [Google Scholar]
- Gerbling H. Peroxisomal degradation of 2-oxoisocaproate. Evidence for free acid intermediates. Bot Acta. 1993;106:380–387. [Google Scholar]
- Gerbling H, Gerhardt B. Oxidative decarboxylation of branched-chain 2-oxo fatty acids by higher plant peroxisomes. Plant Physiol. 1988;88:13–15. doi: 10.1104/pp.88.1.13. [DOI] [PMC free article] [PubMed] [Google Scholar]
- Gerbling H, Gerhardt B. Peroxisomal degradation of branched-chain 2-oxo acids. Plant Physiol. 1989;91:1387–1392. doi: 10.1104/pp.91.4.1387. [DOI] [PMC free article] [PubMed] [Google Scholar]
- Gibson SI. Plant sugar-response pathways. Part of a complex regulatory web. Plant Physiol. 2000;124:1532–1539. doi: 10.1104/pp.124.4.1532. [DOI] [PMC free article] [PubMed] [Google Scholar]
- Graham IA, Denby KJ, Leave CJ. Carbon catabolite repression regulates glyoxylate cycle gene expression in cucumber. Plant Cell. 1994;6:761–772. doi: 10.1105/tpc.6.5.761. [DOI] [PMC free article] [PubMed] [Google Scholar]
- Gray JC. Control of isoprenoid biosynthesis in higher plants. Adv Bot Res. 1987;14:23–91. [Google Scholar]
- Halford NG, Purcell PC, Hardie G. Is hexokinase really a sugar sensor in plants? Trends Plant Sci. 1999;4:117–120. doi: 10.1016/s1360-1385(99)01377-1. [DOI] [PubMed] [Google Scholar]
- Jefferson RA. Assay chimeric genes in plants: the GUSgene fusion system. Plant Mol Biol Rep. 1987;5:387–405. [Google Scholar]
- Koch KE. Carbohydrate-modulated gene expression in plants. Ann Rev Plant Physiol Plant Mol Biol. 1996;47:509–540. doi: 10.1146/annurev.arplant.47.1.509. [DOI] [PubMed] [Google Scholar]
- Kleinig H. The role of plastids in isoprenoid biosynthesis. Ann Rev Plant Physiol Plant Mol Biol. 1989;40:39–59. [Google Scholar]
- Koncz C, Schell J. The promoter of TL-DNA gene 5 controls the tissue-specific expression of chimeric genes carried by a novel type of Agrobacteriumbinary vector. Mol Gen Genet. 1986;204:383–396. [Google Scholar]
- Kyhse-Andersen J. Electroblotting of multiple gels: a simple apparatus without buffer tank for rapid transfer of proteins from polyacrylamide to nitrocellulose. J Biochem Biophys Methods. 1984;10:203–209. doi: 10.1016/0165-022x(84)90040-x. [DOI] [PubMed] [Google Scholar]
- Laemmli UK. Cleavage of structure protein during the assembly of the head of the bacteriophage T4. Nature. 1970;227:680–685. doi: 10.1038/227680a0. [DOI] [PubMed] [Google Scholar]
- Lau EP, Cocharan BC, Fall RR. Subcellular localization of 3-methylcrotonyl-CoA carboxylase in bovine kidney. Arch Biochem Biophys. 1980;205:352–359. doi: 10.1016/0003-9861(80)90117-4. [DOI] [PubMed] [Google Scholar]
- Logemann J, Schell J, Willmitzer J. Improved method for the isolation of RNA from plant tissues. Anal Biochem. 1987;163:16–20. doi: 10.1016/0003-2697(87)90086-8. [DOI] [PubMed] [Google Scholar]
- Luethy MH, Miernyk JA, Randall DD. Molecular analysis of a branched-chain keto-acid dehydrogenase from Arabidopsis thaliana(abstract no. 696) Plant Physiol. 1997;114:S-147. [Google Scholar]
- Maier A, Lichtenthaler HK. Methylcrotonyl-CoA carboxylase from barley (Hordeum vulgareL.): purification, kinetic characterization and senescence-related induction of activity. J Plant Physiol. 1998;152:213–221. [Google Scholar]
- Mazelis M. Amino acid catabolism. In: Miflin BJ, editor. The Biochemistry of Plants: Amino Acids and Derivatives. Vol. 5. New York: Academic Press; 1980. pp. 542–567. [Google Scholar]
- McKean AL, Ke J, Song J, Che P, Achenbach S, Nikolau BJ, Wurtele ES. Molecular characterization of the non-biotin-containing subunit of 3-methylcrotonyl-CoA carboxylase. J Biol Chem. 2000;275:5582–5590. doi: 10.1074/jbc.275.8.5582. [DOI] [PubMed] [Google Scholar]
- Mooney BP, Miernyk JA, Randall DD. Nucleotide sequence of a cDNA encoding the dihydrolipoylacyl transferase (E2) subunit of the branched-chain alpha-keto acid dehydrogenase complex from Arabidopsis thaliana (accession no. AF038505) (PGR 98-071) Plant Physiol. 1998;117:331. [Google Scholar]
- Moss J, Lane MD. The biotin-dependent enzymes. Adv Enzymol. 1971;35:321–442. doi: 10.1002/9780470122808.ch7. [DOI] [PubMed] [Google Scholar]
- Nes WD, Bach TJ. Evidence for a mevalonate shunt in a tracheophyte. Proc Roy Soc Lond B Biol Sci. 1985;225:425–444. [Google Scholar]
- Nikolau BJ, Wurtele ES, Stumpf PK. Use of streptavidin to detect biotin-containing proteins in plants. Anal Biochem. 1985;149:448–453. doi: 10.1016/0003-2697(85)90596-2. [DOI] [PubMed] [Google Scholar]
- Perate P, Matsukura C, Vernieri P, Yamaguchi J. Sugar repression of a gibberellin-dependent signaling pathway in barley embryos. Plant Cell. 1997;9:2179–2208. doi: 10.1105/tpc.9.12.2197. [DOI] [PMC free article] [PubMed] [Google Scholar]
- Popják G. Specificity of enzymes in sterol biosynthesis. Harvey Lect. 1971;65:127–156. [PubMed] [Google Scholar]
- Purcell PC, Smith AM, Halford NG. Antisense expression of a sucrose non-fermenting-1-related protein kinase sequence in potato results in decreased expression of sucrose synthase in tubers and loss of sucrose-inducibility of sucrose synthase transcription in leaves. Plant J. 1998;14:195–202. [Google Scholar]
- Sambrook J, Fritsh EF, Maniatis T. Molecular Cloning: A Laboratory Manual. Ed 2. Cold Spring Harbor, NY: Cold Spring harbor Laboratory; 1989. [Google Scholar]
- Seubert W, Remberger U. Untersuchungen uber den bakteriellen Abbau von Isoprenoiden II. Die Rolle der Kohlensaure. Biochem Z. 1963;338:245–264. [PubMed] [Google Scholar]
- Sheen J. Metabolic repression of transcription in higher plants. Plant Cell. 1990;2:1027–1038. doi: 10.1105/tpc.2.10.1027. [DOI] [PMC free article] [PubMed] [Google Scholar]
- Sheen J. Feed back control of gene expression. Photosynth Res. 1994;39:427–438. doi: 10.1007/BF00014596. [DOI] [PubMed] [Google Scholar]
- Sheen J, Zhou L, Jang JC. Sugars as signaling molecules. Curr Opin Plant Biol. 1999;2:410–418. doi: 10.1016/s1369-5266(99)00014-x. [DOI] [PubMed] [Google Scholar]
- Song J, Wurtele ES, Nikolau BJ. Molecular cloning and characterization of the cDNA coding for the biotin-containing subunit of 3-methylcrotonyl-CoA carboxylase: identification of the biotin carboxylase and biotin-carrier domains. Proc Natl Acad Sci USA. 1994;91:5779–5783. doi: 10.1073/pnas.91.13.5779. [DOI] [PMC free article] [PubMed] [Google Scholar]
- Voytas DF, Konieczny A, Cummings MP, Ausubel FM. The structure distribution and evolution of the Ta1 retrotransposable element family of Arabidopsis thaliana. Genetics. 1990;126:713–721. doi: 10.1093/genetics/126.3.713. [DOI] [PMC free article] [PubMed] [Google Scholar]
- Wang X, Wurtele ES, Keller G, McKean AL, Nikolau BJ. Molecular cloning of cDNAs and genes coding for β-methylcrotonyl-CoA carboxylase of tomato. J Biol Chem. 1994;269:11760–11769. [PubMed] [Google Scholar]
- Wang X, Wurtele ES, Nikolau BJ. Regulation of β-methylcrotonyl-coenzyme A carboxylase activity by biotinylation of the apoenzyme. Plant Physiol. 1995;108:1133–1139. doi: 10.1104/pp.108.3.1133. [DOI] [PMC free article] [PubMed] [Google Scholar]
- Weaver LM, Lebrun L, Franklin A, Huang L, Hoffman N, Wurtele ES, Nikolau BJ. Molecular cloning of the biotinylated subunit of 3-methylcrotonyl-coenzyme A carboxylase of Arabidopsis thaliana. Plant Physiol. 1995;107:1013–1014. doi: 10.1104/pp.107.3.1013. [DOI] [PMC free article] [PubMed] [Google Scholar]
- Wurtele ES, Nikolau BJ. Plants contain multiple biotin enzymes: discovery of 3-methylcrotonyl-CoA carboxylase, propionyl-CoA carboxylase and pyruvate carboxylase in the plant kingdom. Arch Biochem Biophys. 1990;278:179–186. doi: 10.1016/0003-9861(90)90246-u. [DOI] [PubMed] [Google Scholar]
- Yu S. Cellular and genetic responses of plants to sugar starvation. Plant Physiol. 1999;121:687–693. doi: 10.1104/pp.121.3.687. [DOI] [PMC free article] [PubMed] [Google Scholar]


