Abstract
Background
The elemental composition of peptides results in formation of distinct, equidistantly spaced clusters across the mass range. The property of peptide mass clustering is used to calibrate peptide mass lists, to identify and remove non-peptide peaks and for data reduction.
Results
We developed an analytical model of the peptide mass cluster centres. Inputs to the model included, the amino acid frequencies in the sequence database, the average length of the proteins in the database, the cleavage specificity of the proteolytic enzyme used and the cleavage probability. We examined the accuracy of our model by comparing it with the model based on an in silico sequence database digest. To identify the crucial parameters we analysed how the cluster centre location depends on the inputs. The distance to the nearest cluster was used to calibrate mass spectrometric peptide peak-lists and to identify non-peptide peaks.
Conclusion
The model introduced here enables us to predict the location of the peptide mass cluster centres. It explains how the location of the cluster centres depends on the input parameters. Fast and efficient calibration and filtering of non-peptide peaks is achieved by a distance measure suggested by Wool and Smilansky.
Background
The mass spectrometric (MS) technique is widely used to identify proteins in biological samples [1-4]. The proteins are cleaved into peptides by a residue specific protease, e.g. trypsin. The resulting cleavage products can then be analysed by Peptide Mass Fingerprinting (PMF) [5] or subjected to MS/MS fragment ion analysis [6,7], which both rely on the comparison of peptide or peptide fragment ion spectra with spectra simulated from protein sequence databases [8].
The sensitivity and specificity of the peptide identification can be increased by various post-processing methods, for example calibration [9-12] and identification of non-peptide peaks [10,13,14]. The fact that peptide masses are not uniformly distributed across the mass range but form equidistantly spaced clusters [15] is employed by some of these methods. In dependence on the atomic composition of the peptide, the monoisotopic mass would emerge below (e.g. cystein rich peptides) or above (e.g. lysine rich peptides) the cluster centres. The deviation from the cluster centre is a result of the mass defect, which is the difference between the nominal mass and the monoisotopic mass (Table 1). The mass defect is a result of atom fusion [16,17].
Table 1.
Masses of Atoms
| Atom | monoisotopic | nominal | mass defect | |
| 1 | H | 1.00782 | 1 | 0.00782 |
| 2 | C | 12.00000 | 12 | 0.00000 |
| 3 | N | 14.003074 | 14 | 0.003074 |
| 4 | 0 | 15.99491 | 16 | -0.00032 |
| 5 | S | 31.97207 | 32 | -0.00087 |
Calibration
Mass spectrometric peptide peak-lists of peptide mass finger print experiments [18] can be calibrated by comparing the location of measured peptide masses with the location of the peptide mass cluster centres. Gras et al. [19] suggested the use of maximum likelihood methods in order to determine the calibration coefficients a and b. They defined the likelihood function by:
where mi is the i-th mass in the peak-list, and Δm is a search window. P(m, Δm) is the probability to find a mass in [m, m + Δm] given the theoretical distribution of peptide masses. The parameters a, b for argmax ∑i P(ami + b, Δm) can then be used to calibrate the peak-lists. The authors, however, do not provide information on whether P(m, Δm) was determined from the exact distribution of the peptide masses or if a model approximating the distribution was used. They also do not mention which algorithm was used to maximise the likelihood. They reported that a mass measurement accuracy of 0.2Da and better was obtained after calibration.
Wool and Smilansky [10] have used Discrete Fourier Transformation (DFT) to determine the frequency λ and phase ϕ of a peak-list or mass spectrum. By comparing the experimental λ and ϕ with the theoretical λ = 1.000495 and ϕ = 0, they determined the slope and intercept of the calibration function. The authors reported a 40 – 60% reduction of the mass measurement error. Furthermore, they presented a scoring scheme for sequence database searches. This scoring scheme approximates the probability P(m, Δm) to observe a peptide peak of mass m with given measurement error Δm.
Matrix noise filtration
The most widely used MALDI matrices for the analysis of peptides are 3,5-Dimethoxy-4-hydroxycinnamic acid (synapic acid), alpha-Cyano-4-hydroxycinnamic acid (alpha cyano) [20] and 2,5-dihydroxybenzoic acid (DHB) [21]. Unfortunately, clusters of matrix molecules can be ionised and cause peaks in the same mass range where peptide peaks are measured. Matrix aggregate formation can be minimised but not eliminated by adding ammonium acetate [21].
Some of the database search scoring schemes incorporate the number of signals (peaks) not assigned to a protein when computing the identification scores [22]. Therefore, the presence of matrix signals in MS spectra decreases the sensitivity of the MS spectra interpretation. Hence, the removal of peaks strongly deviating from the cluster centres is applied [21,23]. The measure of deviation from cluster centres introduced here provides a simple tool to filter non-peptide peaks.
Data reduction
A further application which employs the property of peptide mass clustering is the binning of the mass measurement range. By applying this technique the amount of data is reduced, thus increasing the speed with which the pairwise comparison of spectra can be made [24,25].
All these applications require us to know the exact location of or the distance between the peptide mass cluster centres. The distance between the cluster centres, which we will henceforth call wavelength λ, is commonly computed by first generating an in silico digest of the database. Afterwards, the linear dependence between the decimal point and the integer part is determined by regression analysis, for a relatively small mass range of 500 to 1000Da [23]. Various authors report different values of the distance between clusters: Wool and Smilansky reported 1.000495 [10], Gay et al. 1.000455 [15], while Tabb et al. used a wavelength of 1.00057 [24].
In this work we present an analytical model allowing us to predict the mass of the peptide cluster centres. The parameters of the model include: the frequencies of the amino acids in the sequence database [26], the average protein length of the proteins in the database, the cleavage sites of the proteolytic enzyme and the cleavage probability. Based on this model we introduced a measure of deviation of peptide masses from the nearest cluster centre, which is a refinement of a measure proposed by Wool and Smilansky [10]. Using this distance measure, we developed a calibration procedure which employs least squares linear regression in order to determine the affine model of the mass measurement error and subsequently to calibrate the spectra. Using this method we reached higher calibration accuracy as reported by Wool and Smilansky [10], and Gras et al [19]. We used the same distance measure to identify and remove non-peptide peaks prior to database searches performed by the Mascot search engine [22].
Results and discussion
A simple way to predict the peptide mass cluster centres of a protein database
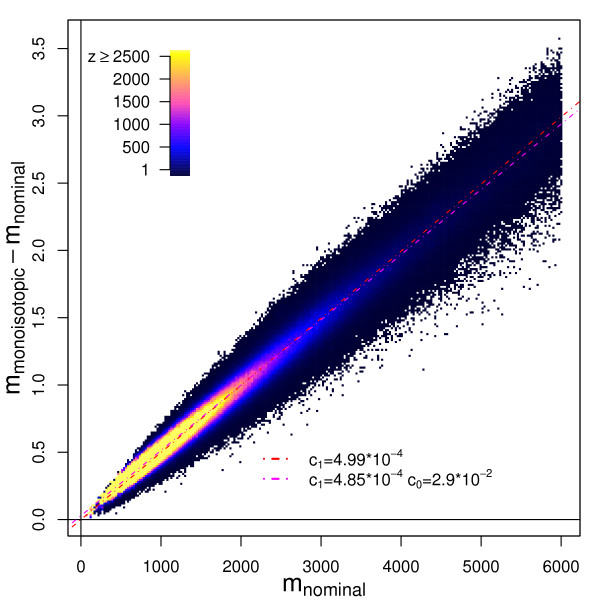
Figure 1 shows the mass defect, the difference of the monoisotopic (m(M)) and nominal (m(N))masses of peptides of a sequence specific in silico protein sequence database digest [27], as a function of m(N). The peptides were produced with the restriction that no missed cleavages were allowed. A strong linear dependence of the mass defect on m(N) can be observed.
Figure 1.
The peptide mass rule. Panel A: Scatterplot of m(M) - m(N) against the m(N) mass (m(M) - monoisotopic mass, m(N) - nominalmass). Red dashed line – the model determined by linear regression with intercept fixed at 0. The magenta line represents the cluster centres predicted by linear regression.
The first model of this dependence which we examined was m(M) - m(N) = c1·m(N). We fixed the intercept at 0, because a hypothetical peptide with a nominal mass of 0 must have a monoisotopic mass equal to 0. The slope coefficient c1, determined by linear regression (cf. Methods) equalled 4.98·10-4(Figure 1, Panel A – red dashed line), which is a value similar to the values 4.95·10-4 reported by Wool and Smilansky [10].
We were interested in determining the dependence between monoisotopic and nominal mass analytically.
For example, the monoisotopic mass (m(M)) of hypothetical peptides built only of one amino acid i can be predicted, given their nominal mass (m(N)) by = λi when λi = /. For peptides generated by random cleavage of protein sequences from a protein database this dependence is approximated by:
where fi is the frequency of the amino acid i in the database.
Now write = λDB + εi. Substituting this is (2), it follows that ∑i∈AA fiεi = 0. Therefore, for an amino acid randomly selected from the database, with frequencies fi, the expectation of εi is zero. Now consider a peptide made of a random selection of J amino acids, i(1),...,i(J). The ratio of monoisotopic to nominal mass for this peptide would be:
If ∑i εi(j) were uncorrelated with for a random selection of amino acids, then λp would have expectation λDB. Of course, there may be a relationship between εi and and we would wish to use any such relationship to improve prediction of
Figure 2 visualises the frequencies fi of all amino acids in the Uniprot database [27] with their respective λi plotted on the abscissa. The position of the red vertical line on the abscissa denotes λDB (Equation 2) and equals λDB = 1.000511. The dotted, dashed and dot dashed lines indicate the wavelength λ of DHB, alpha-cyano and sinapic acid mass spectrometric matrix clusters, respectively.
Figure 2.
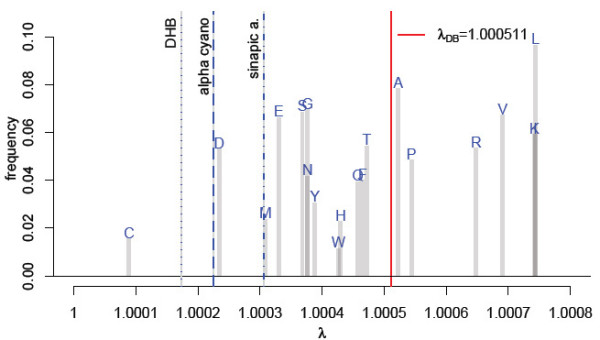
Bar-plot of the Amino Acid frequencies. The bars are drawn on the position of λi = /, for each amino acid i. The red line indicates λDB computed using the Equation 2. Dotted blue line - λDHB 2,5-dihydroxybenzoic acid; dashed line - λalphacyano alpha-Cyano-4-hydroxycinnamic acid; dot dashed line - λsinapica. 3,5-Dimethoxy-4-hydroxycinnamic acid.
When testing for the significance of the intercept coefficient in the regression model mM ∝ λmN of a sequence specific (Tryptic) in silico database digest, we found that the intercept coefficient must be included into the model. Therefore, the extended model of the monoisotopic peptide mass cluster centres was:
m(M) = c1·m(N) + c0. (3)
Subtracting mN from each side of Equation 3 we obtained Δ = m(M) - m(N) = (c1 - 1)·m(N) + c0. The coefficients of the affine linear model of the cluster centres, determined using regression analysis of Δ = m(M) - m(N) on m(N) were c0 = 0.029 and (c1 - 1) = 4.85·10-4.
The maximal difference between the prediction of m(M) using m(M) = 1.000499·m(N) and m(M) = 1.000485·m(N) + 0.029 is 0.022 Dalton for m(N) ∈ [600, 2500] Dalton.
The influence of the digestion enzyme on the wavelength of peptide mass clusters
In case of a complete sequence specific cleavage of proteins, the number of generated peptides is CP + 1 peptides, given that CP is the number of cleavage sites per protein. The peptides generated from the terminus of the protein (further called terminal) will not bear a cleavage site residue RC at their end. All the other peptides, which we call internal, will have such a residue at their end. The fraction of the internal peptides fc,n is given by
where n is the number of missed cleavages per protein. We approximate CP, for a sequence database, by:
where are the relative frequencies of the cleavage sites and |P| is the average protein length in the database. The fraction of the terminal peptides in case of n missed cleavages is given by 1 - fc,n. The fraction of cleavage site residues RC in a internal peptide of mass mpep, with n missed cleavage sites is denoted fm,n and approximated by:
where is the average mass of an amino acid residue. A more accurate model of fm,n is provided in the Appendix. In the case of terminal peptides the fraction of cleavage site residues RC equals fm,n - 1. The fraction of all the other amino acid residues R\RC equals 1 - fm,n or 1 - fm,n - 1 respectively. Table 2 summarises these results.
Table 2.
Frequencies of cleavage site residues, and all other residues, in peptides of mass m and of terminal, and internal, peptides.
| Rnon-cleavage | Rcleavage | Peptide type | |
| (1 - fm,n) | fm,n | fc,n | internal |
| (1 - fm,n - 1) | fm,n - 1 | 1 - fc,n | terminal |
Rcleavage – frequencies of cleavage site residues; Rnon-cleavage – frequencies of non-cleavage site residues; fm,n – see Equation 6; fc,n – see Equation 4.
In the case of internal peptides, the average contribution of the amino acid residues to the peptide mass is the weighted sum:
where
is the average mass of non cleavage residues, and:
is the average mass of the cleavage site residues RC. Finally, the wavelength of internal peptides is presented as:
The wavelength of terminal peptides was determined by: .
The wavelength λ of all peptides at a mass m with exactly n missed cleavages is given by:
where
is the weighted sum of the mass of the terminal peptides (with frequency 1 - fc,n) and the internal peptides (with frequency fc,n).
Cleavage probability pc In practice, the cleavage probability will depend on various factors, for example on the incubation time and the efficiency of the protease used. The probability to generate a peptide with n ∈ 0...∞ missed cleavage sites, given the cleavage probability pc can be modelled using the geometric distribution:
P(n, pc) = (1 - pc)n·pc (17)
Furthermore,
holds. Hence, given the cleavage probability is pcand cleavage residues RC, we express the peptide mass by:
where
Sn = (fc,nfm,n + fm,(n-1) - fc,nfm,(n-1)). (20)
Therefore, the wavelength λ of peptides if the cleavage probability is pc is given by:
The monoisotopic mass as a function of the nominal mass can be expressed by:
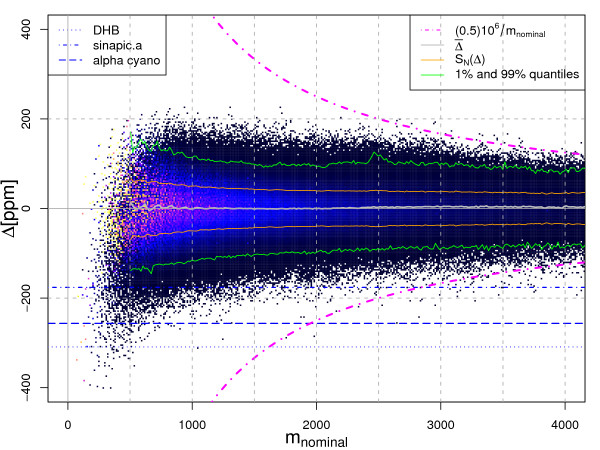
This equation represents our final model of the peptide mass cluster centres. To illustrate the accuracy of the prediction we computed the residuals Δ between the monoisotopic masses of the in silico database digest and the cluster centres predicted by Equation 24. Figure 3 shows the relative residuals Δppm(m) = Δ(m)/m·106, in parts per million. The grey line shows the moving average of the residuals Δppm(m) computed for a window of 15Da.
Figure 3.
Deviation Δppm of peptide masses from mass cluster centres predicted using the Equation 24 in parts per million [ppm]. Gray line – moving average of Δppm. Orange lines – Standard deviation of Δppm, Green lines – 1% and 99% Quantile computed for mass windows having a size of 15Da and covering the mass range. Magenta dot dashed line – maximum possible deviation from cluster centre, which can be assigned to the true cluster centre using the Equation 30. Horizontal dotted blue line – distance of DHB (2,5-dihydroxybenzoic acid) matrix clusters from the peptide mass cluster centres; dashed line – distance of alphacyano (alpha-Cyano-4-hydroxycinnamic acid) clusters from the peptide mass cluster centres; distance of sinapicacid (3,5-Dimethoxy-4-hydroxycinnamic acid) clusters from peptide mass cluster centres.
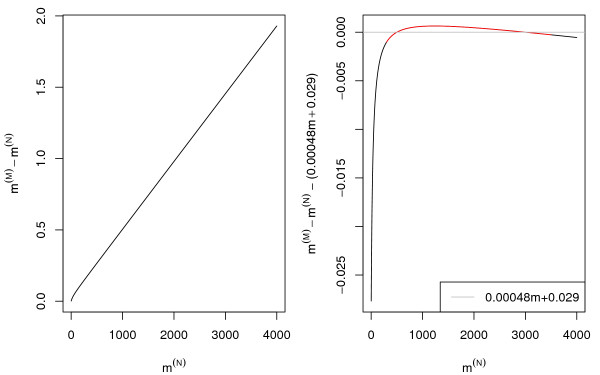
Figure 4, panel A, shows the difference between nominal and monoisotopic mass (m(M) - m(N)) where m(M) was predicted using the model of Equation 24. We observed that m(M) - m(N) ∝ m(N) is approximately a straight line for the mass range greater than 500Da. By using the predicted monoisotopic mass m(M) at m(N) = 500 and at m(N) = 3000 we determined the slope:
Figure 4.
The monoisotopic mass as an function of the nominal mass. Left panel : m(M) - m(N) = ( - 1)·m(N) Right panel : Difference between ( - 1) m(N) and 0.00048 m(N) + 0.029.
and intercept coefficient
These coefficients are in good agreement with the slope and intercept determined by linear regression for the in silico sequence database digest (Figure 1).
Furthermore, we observed that the intercept c0 will be positive if > mnone, zero or negative otherwise. The slope c1 equals λnone = , for large m(N), because the frequency of the cleavage site residues RC decreases with increasing peptide length:
Figure 4, panel B, displays the difference between the line (c1 + 1)·m(M) + c0 and the prediction made using Equation 3. For the mass range m ∈ (500, 4000) where peptide masses for peptide mass fingerprinting are acquired this difference is minimal.
The coefficients c0 and c1 do not depend on the mass of the peptides. Due to this feature, we are going to use the affine model c1m(N) + c0 to predict the peptide mass cluster centres in the applications discussed later. This simplified model is also in agreement with the affine model (Equation 3), which has been fitted by linear regression to the in silico database digest in order to explain the dependency of the peptide mass cluster centres on the nominal mass.
Error of the model
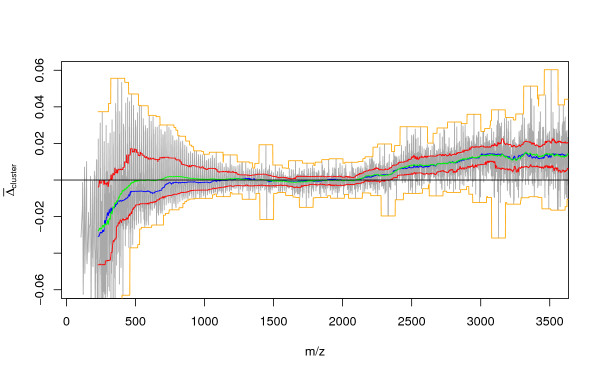
Combinatorial restrictions may cause significant differences between the linear prediction of the model (Equation 24) introduced and the actual location of the cluster centre. To asses this error we first computed the location of the cluster centres (average of all monoisotopic masses in cluster) of the in silico database digest, and afterwards determined the difference to the cluster centre location predicted by model of Equation 24. This difference (cluster) is shown in Figure 5.
Figure 5.
Difference between cluster centre computed for the in silico database digest and the cluster centre location predicted by the model (Equation 24). Orange lines – minimum and maximum, red lines – first and third quartile, green – mean, blue – median of the differences computed for a moving window of 100Da.
For a moving window of 100Da we computed the maximum and minimum (orange), third and first quartile (red), median (blue) and mean(gree) of (cluster). The combinatorial restriction decreases with increasing mass and for peptide masses greater than 1000Da it is negligible. However, (cluster) increases again for masses greater than 2500Da because peptide masses may deviate more strongly from the cluster centres and furthermore much fewer long peptides are generated.
The type of distribution around the cluster centres
In order to remove non-peptide peaks prior to database search, filtering thresholds have to be chosen. In Figure 3 the orange line visualises the standard deviation while the green lines show the 1% and 99% quantiles of Δppm(m) = Δ(m)/m·106 computed for a mass window of 15Da. In addition the dotted, dashed, and dot dashed line show the deviation Δppm(m), at which clusters of mass spectrometric matrices are expected.
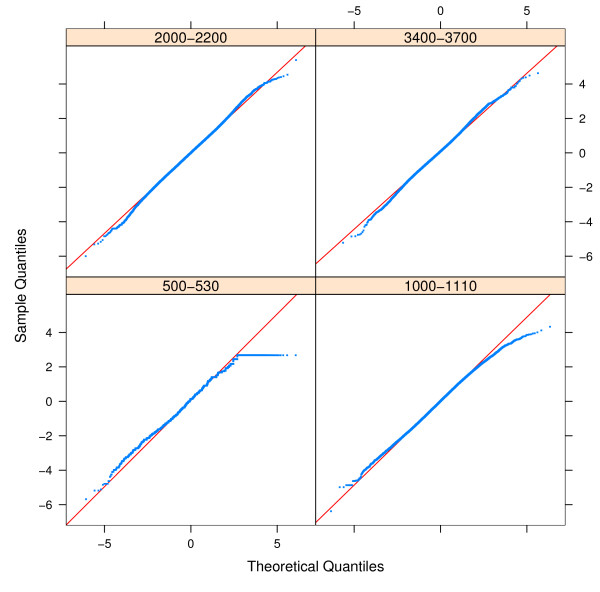
The standard deviation of Δppm(m) is symmetric and does not change for m > 1500. We were interested to determine the distribution of Δppm around the peptide mass cluster centres. To determine the type of distribution we use qqplots [28] shown in Figure 6. We compared the distribution of the residues Δppm(m), observed for four different mass windows (m ∈ (500 – 530), m ∈ (1000 – 1110), m ∈ (2000 – 2200) and m ∈ (3400 – 3700)) with the normal distribution and t-distributions with various degrees of freedom. The t-distribution with degrees of freedom μ ∈ (15, 25) is a good approximation of the empirical distribution of Δppm for masses > 2000,.
Figure 6.
qqplot – of Δppm = mm - c1·mN - c0 versus the t-distribution with 19 degrees of freedom for four mass ranges m ∈ (500 – 530), m ∈ (1000 – 1110), m ∈ (2000 – 2200)and m ∈ (3400 – 3700).
Sensitivity analysis
The input parameters to the model of the peptide mass cluster centres included:
• fi – frequencies of the amino acids.
• cleavage specificity of the protease RC
• |P| – Protein length
• pc – cleavage probability
To examine how the output of the model is influenced by these factors we varied the protein length |P| in steps of 100 from 300 to 800 amino acids per protein. We determined the amino acid frequencies fi for 9 sequence databases (cf. Methods) and used them as inputs to the model. Furthermore, six cleavage specificities (shown in Table 3) were examined and the cleavage probability pc was changed from 0.4 to 1 in increments of 0.2.
Table 3.
Cleavage sites of proteolytic enzymes [36]
| Enzyme | RC | |
| 1 | Trypsin/P | K,R/P |
| 2 | Arg.C | R/P |
| 3 | CNBR + Trypsin | F, Y, M |
| 4 | Lys-C | K/P |
| 5 | PepsinA | F, L |
| 6 | CNBr | M |
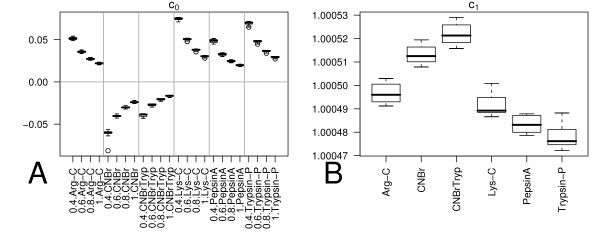
The box-plots, of Figure 7, Panel A demonstrate that the values of the intercept coefficient c0 (Equation 27) mainly depend on the cleavage probability pc and on the cleavage specificity of the proteolytic enzyme. The relatively small height of the boxes indicates that the differences in amino acid frequencies fi for the databases examined, and the average protein length |P| have a negligible effect on the intercept coefficient. The slope coefficient c1 (see Equation 26) depends only on the cleavage site specificities of the proteolytic enzyme and the amino acid frequencies f. The box-plots 7 Panel B show that the model output is highly sensitive to the cleavage specificity of the proteolytic enzyme.
Figure 7.
Panel A – Box plots of the intercept coefficient c0 (Equation 27) itemised according the cleavage specificity and cleavage probability. Panel B – Box plots of the slope coefficient c1 (Equation 26) itemised according the cleavage specificity.
A measure of distance to cluster centres
Given an experimentally determined mM we were interested to estimate the deviation Δ from the closest predicted cluster centre. The model of the monoisotopic mass is:
c0 + c1·mN + Δ = mM, (28)
where c0, c1 can be obtained using the Equations 27 and 26, mN is the nominal mass (an integer).
Therefore, for a given mM, c0 and c1 we can determine the deviation Δ from the closest cluster centre of smaller mass by using the modulo operator as suggested by Wool and Smilansky [10]:
(mM - c0)(modc1) = (c1·m + Δ)(modc1) = Δ. (29)
However, in order to determine the distance to the closest cluster centre we considered two cases:
The units of Δλ(mi, 0) are in [m/z]. The magenta dot dashed curves in Figure 3 indicate the maximum detectable distance from cluster centres in ppm (±0.5Da/m·106[ppm]). Deviations from the cluster centres outside the range enclosed by these two curves are assigned to the wrong cluster. In case of theoretical peptide masses and experimental masses calibrated to high precision, such distances are observed only for masses greater than 2500Da. Fortunately, the majority of tryptic peptide masses detected in a mass spectrometric peptide fingerprint experiment are below this mass.
Applications
Linear regression on peptide mass rule LR/PR
The limitations of calibration methods based on the property of peptide mass clustering are a mass accuracy of only 0.2Da, its sensitivity to non-peptide peaks in the spectra, and that it completely fails if the number of peptide peaks in the peak list is small [10,14,19]. Hence, in practice, the method is used to confirm the results of internal calibration only [14,29]. However, the advantage of the calibration methods based on the property of peptide mass clustering, over other calibration methods [12], is that no internal or external calibrants are required in order to calibrate the peptide mass lists.
We propose here a novel method for the calibration of PMF data, based on robust linear regression and the distance measure introduced in the Equation 30. To determine the slope of the mass measurement error we computed the deviation from the peptide mass rule for every pair of peak masses (mi, mj) within a peak-list, employing the following equation:
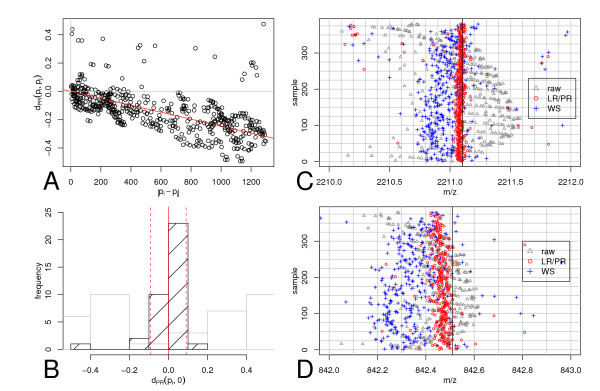
Figure 8 left top panel shows the distance Δλ(mi, mj) (Equation 31) as a function of Δd = |mi - mj|, computed for all pairs (mi, mj) ∈ peak-list, which adhere to the additional constraint that Δd = |mi - mj| <mmax. This constraint is necessary because the measure Δλ is only able to assign deviation smaller than 0.5Da to the correct cluster centre. For large values of Δd, Δλ increases, if c1 ≠ 0 and assignments to wrong clusters may occur. If a systematic dependence of Δλ on Δd is observed it indicates a mass measurement error. We determined the slope 1 using robust linear regression [30] with the intercept fixed at 0. To correct the peak-list masses we applied
Figure 8.
Principle and results of linear regression on peptide rule LR/PR calibration. Panel A: Scatter-plot of ΔPR (mi, mj) (Equation 31) in dependence of Δd = |mi - mj|. The slope, obtained by robust regression, is shown by the red line. Panel B: Histogram (black with diagonals) of dPR(mi, 0). The continuous vertical red line denotes the average (PR(mi, 0)) and the dotted vertical lines denote (PR(mi, 0) ± SN. The histogram in gray is showing the distribution of (dPR(mi, 0) previous to removing the slope error (see text). Panel C & D: Strip-charts of the data-set for a mass range of 2210 – 2212Da and 842 – 843Da, including the tryptic autolysis peaks 842.508Da and 2211.100Da. Gray triangles – raw data; blue "+" – Wool Smilansky algorithm (cf. Appendix); red "o" – LR/RP algorithm for tryptic peaks .
mcorrected = mexperimental·(1 - 1)
To determine the intercept coefficient of the mass measurement error we subsequently computed Δλ(mcorrected, 0) (using Equation 30), for all peak-list masses. Figure 8, Panel B shows the distribution of Δλ(mi, 0) before correcting for the slope error (gray histogram) and afterwards (black histogram). The red vertical line indicates the mean λ(mi, 0), computed for the corrected data, which we used to approximate the intercept 0 of the mass measurement error.
The strip charts (Figure 8, Panel C and D) visualises the experimental masses of two trypsin peptides 842.508Da and 2211.100Da observed in most of the samples of the dataset with 380 peak-lists. The result of LR/PR calibration (red circles) is compared with raw masses (gray triangles) and the output of the Wool and Smilansky calibration method (blue crosses). The LR/PR-method is able to calibrate mass spectrometric peak-lists to an accuracy of 0.1Da. This measurement accuracy surpasses the other published calibration methods [10,19] at least two-fold.
Filtering of non-peptide peaks using the peptide mass rule
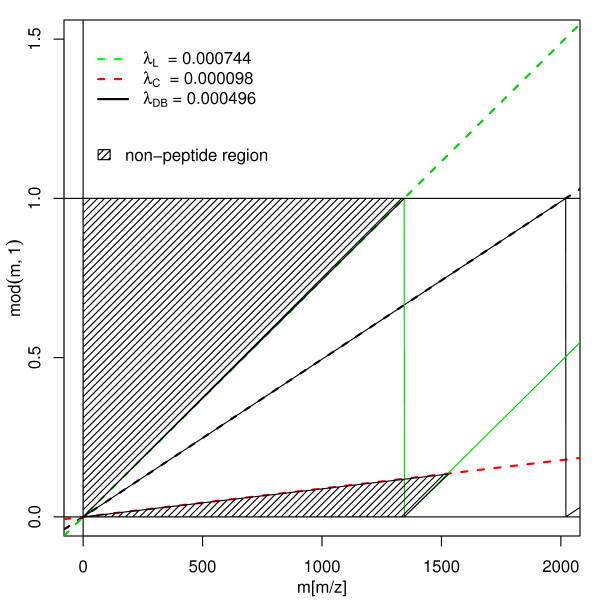
Non-peptide peaks can be recognised according to their deviation from the cluster centres. The amino acids that have the most extreme λ values are I, L and K (because of their large fraction of Hydrogen H (1.007825) atoms) and C (Cysteine – because of the heavy sulfur atom S (31.97207)). If we plot the position after the decimal point given by n·(λi - l)(modl) with n ∈ ℕ, for i = L and i = C, and connect the points for readability purposes by a line (the red and green lines in Figure 9 respectively), we obtain the range enclosing any possible decimal point a theoretical peptide mass can have. If a mass with a decimal point lying in the dashed region is detected it can not be a peptide peak. For peptide peaks, the following inequalities hold:
Figure 9.
Schema of non-peptide mass filtering. Abscissae – peptide mass, ordinate – m mod 1, dashed region – non-peptide masses. Green line – decimal part of poly-(L(lys), I(ile)) peptide masses as a function of their mass. Red line – decimal part of poly-(C(cys)) peptide masses as function of their mass. Black line – Predicted cluster centres using the Equation 2.
-413[ppm] = (λC - λDB)·106 < ΔΔ(m, 0)·106/m = (m, 0) < (λL - λDB) = 241[ppm], (32)
where λDB = 1.000511 (Equation 2). We used the relative deviation of Δppm from the cluster centre in parts per million instead of using absolute values.
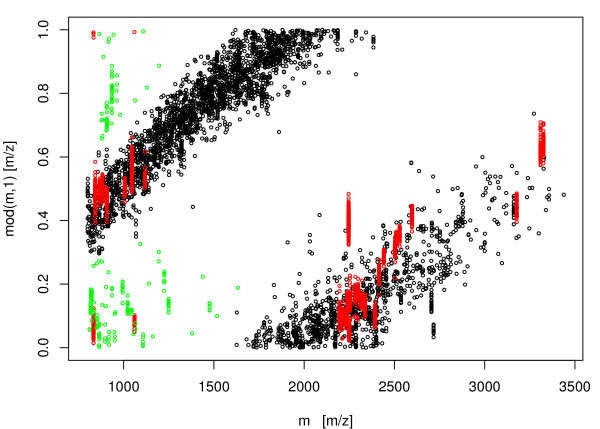
Figure 3 shows that only very short peptides approach the lower bound of -413ppm. This is due to the low frequency of Cysteine (C). The high frequencies of K, L, I (whose λ ≈ 1.00074) mean that the theoretical upper bound of 241ppm can indeed be reached by some peptides with a mass of ≈ l000Da. Peptides of higher mass never approach the upper and lower theoretical bound due to the rapidly decreasing probability to consist of K, L or I, or of C only. The lines for the standard deviation of SN (orange lines) and of the 1% and 99% quantile (green lines) in Figure 3 indicate that it is an exceedingly rare event to encounter a peptide mass for which (m, 0) will deviate more than 200ppm from the peptide cluster centre predicted by our model. Therefore, we use 200ppm as a filtering threshold. An essential requirement, to apply this filtering method successfully is that peak-list must be calibrated to high precision [12].
Figure 10 visualizes the result of non-peptide peak filtering in case of a dataset of 380 calibrated peak-lists. Spots removed by applying the filtering criterion (m, 0) > 200 are shown in green. Peptide masses removed due to filtering of abundant masses [12] are shown in red.
Figure 10.
Scatter plot : abscissae – peptide mass mi, ordinate – mimodλ with λ = 1.000495. In red are highlighted peaks removed from the dataset because of their high frequencies. In green, peaks removed due to the strong deviation from the peptide mass cluster centres.
We studied how the non-peptide peak filtering influences the Probability Based Mascot Score (PBMS) [22]. In theory, for example one cystein rich peptide strongly deviating from the peptide mass rule and with a unique mass in the database digest, if properly assigned is sufficient to identify the protein unambiguously [10]. In case of PBMS, which requires multiple matches to peptide masses, a single match of a unique peptide mass, even if properly assigned, will not give a score indicating reliable identification of the protein. Furthermore, this scoring scheme takes into account the number of non-matching peaks. If many unassigned peaks are observed, the score is decreased and the assignment is interpreted as insignificant. Therefore, the removal of non-peptide peaks should increase the identification sensitivity. Table 4 demonstrates that an increase of 2.5% in the number of identified samples can be obtained by removing all peaks with a distance (m, 0) > 200ppm from the peptide peak-lists. Row 8 of Table 4 shows that non-peptide peak filtering increases the PBMS score in 30 – 55% of cases. Removal of peptide peaks due to filtering caused a decrease of the PBMS score in less than 1% of samples.
Table 4.
Results for filtering of non-peptide masses.
| Arabidopsis t. | Rhodopirelulla b. | Mus musculus | ||
| 1 | Identification no PR filtering | 423 | 1009 | 872 |
| 2 | Identification with PR filtering | 432 | 1017 | 894 |
| 3 | Change in identification (Percent) | 2.13 | 0.79 | 2.52 |
| 4 | Total nr. of samples* | 818 | 1169 | 1709 |
| 5 | Nr. samples with PBMS increase | 240 | 622 | 724 |
| 6 | Nr. samples with no change of PBMS | 571 | 542 | 982 |
| 7 | Nr. samples with PBMS decrease | 7 | 5 | 3 |
| 8 | Percent increase of PBMS score | 29.34 | 53.21 | 42.36 |
| 9 | Percent decrease of PBMS score | 0.86 | 0.43 | 0.18 |
Columns: Arabidopsis t., Rhodopirelulla b., Mus musculus – peptide mass fingerprint datasets (cf. Methods). Row 1 – number of samples with a significant PBMS score prior to filtering of non-peptide peak masses. Row 2 – number of samples with a significant PBMS score for peak-lists with non-peptide removed. Row 3 – relative change of the identification rate (Row 2 – Row 1)/Row1 100. Row 4 – Total number of samples which produced a PBMS score. Row 5 -number of samples for which an increase of the PBMS score due to non peptide peak filtering was observed. Row 6 – number of samples for which no change of the PBMS score due to non-peptide peak filtering was observed. Row 7 – number of samples for which a decrease of the PBMS score due to non-peptide peak filtering was observed. Row 8–9 – relative increase and decrease of the PBMS score, respectively.
We concluded that non-peptide peak filtering increases the sensitivity of protein identification if using the PBMS scoring schema. However, to which extend these results can be reproduced is dependent on the database search algorithm used.
Conclusion
We introduced here a simple model to predict the cluster centres of peptide masses. The input parameters of the model can be easily determined for the sequence databases. We studied how these parameters influence the location of cluster centres, concluding that the cleavage specificity of the enzyme used for peptide digestion and the cleavage probability are the main factors. The change of the cluster centre location due to changes in average protein length or due to variability of amino acid frequencies among the databases is relatively small. However, our analysis also illustrates that, due to combinatorial constraints, the location of the cluster centres for masses smaller than l000Da can differ from the average location. Based on the model of the peptide mass cluster centres we derived a measure to determine the deviation of an experimental peptide mass from the nearest cluster centre. We used this distance measure to calibrate the peptide peak-lists and to recognise non-peptide peaks. The calibration method, linear regression on peptide rule, is a robust and accurate method to calibrate single peak lists without resorting to internal calibrants. With this method higher calibration precision was obtained in comparison to other calibration methods, which also employ the property of peptide mass clustering.
The same distance measure was used to recognise non-peptide peaks and to remove them from the peak-lists. Due to their removal, an increase of the identification rate of up to 2.5% for the PBMS scoring schema was observed.
Methods
Data sets
In this study, we used three data sets generated in different proteome analyses:
1. A bacterial proteome of Rhodopirellula baltica (unpublished data) (1,193 spectra) measured on a Reflex III [31] MALDI-TOF instrument.
2. A mammalian proteome of Mus musclus (1, 882 spectra) measured on an Ultraflex [31] MALDI-TOF instrument.
3. A plant proteome of Arabidopsis thaliana [32] measured on an Autoflex [31] MALDI-TOF instrument.
All PMF MS spectra derive from tryptic protein digests of individually excised protein spots. For this purpose, the whole tissue/cell protein extracts of the aforementioned organisms were separated by two-dimensional (2D) gel electrophoresis [33] and visualised with MS compatible Coomassie brilliant blue G250 [32]. The MALDI-TOF MS analysis was performed using a delayed ion extraction and by employing the MALDI AnchorChip ™targets (Bruker Daltonics, Bremen, Germany). Positively charged ions in the m/z range of 700 – 4, 500m/z were recorded. Subsequently, the SNAP algorithm of the XTOF spectrum analysis software (Bruker Daltonics, Bremen, Germany) detected the monoisotopic masses of the measured peptides. The sum of the detected monoisotopic masses constitutes the raw peak-list.
Calibration
In order to perform filtering of non-peptide peaks the dataset must be calibrated to high mass measurement accuracy. To align the dataset we used a calibration sequence [12] consisting of several calibration procedures.
First calibration using external calibration samples was performed in order to remove higher order terms of the mass measurement error [11]. Next, the affine mass measurement error of all samples on the sample support was determined by linear regression on the peptide mass rule introduced here. Subsequently, the thin plate splines were used to model the mass measurement error in dependence of the sample support positions to calibrate the spectra. Finally, the spectra were aligned using a modified spanning tree algorithm [12].
Mascot database search
Processed peak-lists were then used for the protein database searches with the Mascot search software (Version 1.8.1) [22], employing a mass accuracy of ± 0.1Da. Methionine oxidation was set as a variable and carbamidomethylation of cysteine residues as fixed modification. We allowed only one missed proteolytic cleavage site in the analysis.
Sequence databases
We determined the amino acid frequencies of the nine protein sequence databases listed in Table 5. Seven of these databases are organism specific subsets of the NCBI non-redundant protein database [34].
Table 5.
Protein lengths and amino acid frequencies (one letter code) for nine in the nine databases, length – average protein length in database, reference – database reference; fi – amino acid frequencies
| Organ izm | length | fF | fS | fT | fN | fK | fY | fE | fV | fQ | fM |
| Arabidopsis t. | 422.40 | 4.27 | 9.01 | 5.11 | 4.41 | 6.36 | 2.86 | 6.74 | 6.69 | 3.52 | 2.44 |
| Drosophila m. | 506.20 | 3.48 | 8.33 | 5.68 | 4.80 | 5.70 | 2.91 | 6.41 | 5.88 | 5.21 | 2.33 |
| Escherichia coli | 300.30 | 3.86 | 6.25 | 5.67 | 4.26 | 4.59 | 2.96 | 5.65 | 6.91 | 4.40 | 2.67 |
| Homo sapiens | 360.40 | 3.61 | 8.61 | 5.55 | 3.55 | 5.54 | 2.86 | 6.81 | 6.02 | 4.80 | 2.12 |
| Mus musculus | 378.30 | 3.74 | 8.58 | 5.55 | 3.59 | 5.71 | 2.88 | 6.75 | 6.11 | 4.74 | 2.22 |
| Rattus norvegicus | 484.40 | 3.81 | 8.33 | 5.52 | 3.59 | 5.62 | 2.74 | 6.77 | 6.32 | 4.64 | 2.28 |
| Saccharomyces c. | 447.00 | 4.47 | 9.02 | 5.93 | 6.18 | 7.26 | 3.41 | 6.43 | 5.58 | 3.94 | 2.10 |
| Rhodopirellula b. | 314.70 | 3.70 | 7.37 | 5.85 | 3.37 | 3.44 | 2.09 | 6.02 | 7.05 | 4.04 | 2.43 |
| SwissProt DB | 367.90 | 4.03 | 6.89 | 5.47 | 4.22 | 5.93 | 3.09 | 6.59 | 6.70 | 3.93 | 2.38 |
| Mean | 397.96 | 3.89 | 8.04 | 5.59 | 4.22 | 5.57 | 2.87 | 6.46 | 6.36 | 4.36 | 2.33 |
| SD | 71.90 | 0.32 | 0.98 | 0.24 | 0.88 | 1.07 | 0.35 | 0.39 | 0.50 | 0.54 | 0.18 |
| Min | 300.30 | 3.48 | 6.25 | 5.11 | 3.37 | 3.44 | 2.09 | 5.65 | 5.58 | 3.52 | 2.10 |
| Max | 506.20 | 4.47 | 9.02 | 5.93 | 6.18 | 7.26 | 3.41 | 6.81 | 7.05 | 5.21 | 2.67 |
| reference | fC | fL | fA | fW | fP | fH | fD | fR | fI | fG | |
| Arabidopsis t. | [34] | 1.80 | 9.52 | 6.36 | 1.26 | 4.80 | 2.28 | 5.43 | 5.39 | 5.34 | 6.41 |
| Drosophila m. | [34] | 1.95 | 9.02 | 7.36 | 1.00 | 5.46 | 2.64 | 5.18 | 5.53 | 4.96 | 6.17 |
| Escherichia coli | [34] | 1.17 | 10.23 | 9.27 | 1.50 | 4.32 | 2.22 | 5.21 | 5.54 | 5.94 | 7.38 |
| Homo sapiens | [34] | 2.24 | 9.78 | 6.98 | 1.35 | 6.22 | 2.51 | 4.73 | 5.64 | 4.28 | 6.80 |
| Mus musculus | [34] | 2.29 | 9.92 | 6.86 | 1.29 | 6.03 | 2.57 | 4.76 | 5.51 | 4.38 | 6.54 |
| Rattus norvegicus | [34] | 2.29 | 10.07 | 6.88 | 1.25 | 5.97 | 2.58 | 4.77 | 5.59 | 4.51 | 6.49 |
| Saccharomyces c. | [34] | 1.30 | 9.52 | 5.51 | 1.04 | 4.39 | 2.18 | 5.76 | 4.41 | 6.58 | 5.00 |
| Rhodopirellula b. | [37] | 1.27 | 9.31 | 9.25 | 1.54 | 5.33 | 2.31 | 6.23 | 6.96 | 4.95 | 7.48 |
| SwissProt | [27] | 1.57 | 9.63 | 7.80 | 1.17 | 4.86 | 2.27 | 5.30 | 5.29 | 5.92 | 6.94 |
| Mean | 1.76 | 9.67 | 7.36 | 1.27 | 5.26 | 2.40 | 5.26 | 5.54 | 5.21 | 6.58 | |
| SD | 0.45 | 0.38 | 1.25 | 0.18 | 0.71 | 0.18 | 0.50 | 0.65 | 0.80 | 0.74 | |
| Min | 1.17 | 9.02 | 5.51 | 1.00 | 4.32 | 2.18 | 4.73 | 4.41 | 4.28 | 5.00 | |
| Max | 2.29 | 10.23 | 9.27 | 1.54 | 6.22 | 2.64 | 6.23 | 6.96 | 6.58 | 7.48 | |
In silico protein digestion
The theoretical digestion of the protein databases was done with ProtDigest [35], a command line program taking a protein sequence database file in fasta format and cleavage specificities as input. Other optional input parameters included fixed as well as variable modifications and number of missed cleavages. The output file contains all theoretically resulting peptides with their corresponding masses.
Regression analysis
The complete tryptic insilico digest of the SwissProt [27] database generated more than 7 million peptides. In order to compute the slope coefficient we were sampling 500 times 10000 monoisotopic and corresponding nominal masses. For each sample we fitted the affine linear model with and without fixed intercept using linear regression. The slope and intercept coefficients in Figure 1 are the medians of these 500 samples.
Appendix
Wool and Smilanskys algorithm
Wool and Smilansky [10] use a Discrete Fourier Transform (DFT) to determine the calibration coefficients. The wavelength λ of a peptide peak-list can be determined by convolution. The "time domain" is the peak-list X with masses xi. We computed the amplitude A (Equation 36) for a small range of frequencies (ω ~ f = 1/λ around λtheo. We scanned the range λ ∈ λtheo ± 0.0005 in steps of 5·10-7 computing, for each λ, the real part (Equation 35), the imaginary part (Equation 34) and the amplitude A(ω) (Equation 36):
f = 1/λ ω = 2πf, (33)
The wavelength of the masses in the peak-list is the λ at the maximum of A(ω). The phase for this ω0 = ωmax A(ω) can be determined by:
The peak centres are at the line:
But they should be on the line:
M = λtheo * N. (39)
Solving Equation 38 for N and substituting N in the Equation 39 yields the Equation:
mcorr = α(mexp - β) = αmexp - αβ, (42)
which can be used to correct the masses. This is an affine linear model with two coefficients α and αβ.
Abbreviation
• PBMS – Probability based Mascot score
• DFT – Discrete Fourier Transformation
• m/z – mass over charge
Authors' contributions
WEW developed and implemented the methods described, carried out the analysis and visualised the results.
WEW, MF, ML and AKE wrote the manuscript.
AKE implemented the sequence digester.
All authors contributed to the final version of the manuscript.
Acknowledgments
Acknowledgements
I would like to thank the members of Algorithmic Bioinformatics group of Prof. Knut Reinert at the FU-Berlin for valuable discussion, especially Andreas Döring and Dr. Clemens Gröpl. Many thanks also to Dr. Johan Gobom, Dr. Patrick Giavalisco for providing the PMF-MS data and for valuable discussion. This project was partially funded by the National Genome Research Network (NGFN) of the German Ministry for Education and Research (BMBF).
Contributor Information
Witold E Wolski, Email: w.e.wolski@ncl.ac.uk.
Malcolm Farrow, Email: malcolm.farrow@ncl.ac.uk.
Anne-Katrin Emde, Email: emde@inf.fu-berlin.de.
Hans Lehrach, Email: lehrach@molgen.mpg.de.
Maciej Lalowski, Email: m.lalowski@mdc-berlin.de.
Knut Reinert, Email: reinert@inf.fu-berlin.de.
References
- Fenyo D. Identifying the proteome: software tools. Current Opinion in Biotechnology. 2000;11:391–395. doi: 10.1016/S0958-1669(00)00115-4. [DOI] [PubMed] [Google Scholar]
- Griffin TJ, Aebersold R. Advances in proteome analysis by mass spectrometry. J Biol Chem. 2001;276:45497–500. doi: 10.1074/jbc.R100014200. [DOI] [PubMed] [Google Scholar]
- Patterson SD. Data analysis – the Achilles heel of proteomics. Nat Biotechnol. 2003;21:221–2. doi: 10.1038/nbt0303-221. [DOI] [PubMed] [Google Scholar]
- Aebersold R, Mann M. Mass spectrometry-based proteomics. Nature. 2003;422:198–207. doi: 10.1038/nature01511. [DOI] [PubMed] [Google Scholar]
- Mann M, Hojrup P, Roepstorff P. Use of mass spectrometric molecular weight information to identify proteins in sequence databases. Biol Mass Spectrom. 1993;22:338–345. doi: 10.1002/bms.1200220605. [DOI] [PubMed] [Google Scholar]
- Johnson R, Martin S, Biemann K, Stults J, Watson J. Novel Fragmentation Process of Peptides by Collision-Induced Decomposition in a Tandem Mass Spectrometer: Differentiation of Leucine and Isoleucine. Analytical Chemistry. 1987;59:2621–2625. doi: 10.1021/ac00148a019. [DOI] [PubMed] [Google Scholar]
- Smith RD, Loo JA, Edmonds CG, Barinaga CJ, Udseth HR. New developments in biochemical mass spectrometry: electrospray ionization. Anal Chem. 1990;62:882–99. doi: 10.1021/ac00208a002. [DOI] [PubMed] [Google Scholar]
- Apweiler R, Bairoch A, Wu CH. Protein sequence databases. Curr Opin Chem Biol. 2004;8:76–80. doi: 10.1016/j.cbpa.2003.12.004. [DOI] [PubMed] [Google Scholar]
- Gentzel M, Kocher T, Ponnusamy S, Wilm M. Preprocessing of tandem mass spectrometric data to support automatic protein identification. Proteomics. 2003;3:1597–610. doi: 10.1002/pmic.200300486. [DOI] [PubMed] [Google Scholar]
- Wool A, Smilansky Z. Precalibration of matrix-assisted laser desorption/ionization-time of flight spectra for peptide mass fingerprinting. Proteomics. 2002;2:1365–1373. doi: 10.1002/1615-9861(200210)2:10<1365::AID-PROT1365>3.0.CO;2-9. [DOI] [PubMed] [Google Scholar]
- Gobom J, Mueller M, Egelhofer V, Theiss D, Lehrach H, Nordhoff E. A calibration method that simplifies and improves accurate determination of peptide molecular masses by MALDI-TOF MS. Anal Chem. 2002;74:3915–3923. doi: 10.1021/ac011203o. [(eng)] [DOI] [PubMed] [Google Scholar]
- Wolski WE, Lalowski M, Jungblut P, Reinert K. Calibration of mass spectrometric peptide mass fingerprint data without specific external or internal calibrants. BMC Bioinformatics. 2005;6:203. doi: 10.1186/1471-2105-6-203. http://www.biomedcentral.com/1471-2105/6/203 [DOI] [PMC free article] [PubMed] [Google Scholar]
- Levander F, Rognvaldsson T, Samuelsson J, James P. Automated methods for improved protein identification by peptide mass fingerprinting. Proteomics. 2004;4:2594–601. doi: 10.1002/pmic.200300804. [DOI] [PubMed] [Google Scholar]
- Chamrad DC, Koerting G, Gobom J, Thiele H, Klose J, Meyer HE, Blueggel M. Interpretation of mass spectrometry data for high-throughput proteomics. Anal Bioanal Chem. 2003;376:1014–22. doi: 10.1007/s00216-003-1995-x. [DOI] [PubMed] [Google Scholar]
- Gay S, Binz PA, Hochstrasser DF, Appel RD. Modeling peptide mass fingerprinting data using the atomic composition of peptides. Electrophoresis. 1999;20:3527–3534. doi: 10.1002/(SICI)1522-2683(19991201)20:18<3527::AID-ELPS3527>3.0.CO;2-9. [(eng)] [DOI] [PubMed] [Google Scholar]
- Wikipedia is a Web-based, free-content encyclopedia. 2004. http://www.wikipedia.org
- Giles J. Internet encyclopaedias go head to head. Nature. 2005;438:900–1. doi: 10.1038/438900a. [DOI] [PubMed] [Google Scholar]
- Pappin DJC, Hojrup P, Bleasby AJ. Rapid identification of proteins by peptide-mass fingerprinting. Curr Biol. 1993;3:327–332. doi: 10.1016/0960-9822(93)90195-T. [DOI] [PubMed] [Google Scholar]
- Gras R, Muller M, Gasteiger E, Gay S, Binz PA, Bienvenut W, Hoogland C, Sanchez JC, Bairoch A, Hochstrasser DF, Appel RD. Improving protein identification from peptide mass fingerprinting through a parameterized multi-level scoring algorithm and an optimized peak detection. Electrophoresis. 1999;20:3535–3550. doi: 10.1002/(SICI)1522-2683(19991201)20:18<3535::AID-ELPS3535>3.0.CO;2-J. [(eng)] [DOI] [PubMed] [Google Scholar]
- Gobom J, Schürenberg M, Mueller M, Theiss D, Lehrach H, Nordhoff E. Alpha-cyano-4-hydroxycinnamic acid affinity sample preparation. A protocol for MALDI-MS peptide analysis in proteomics. Analytical Chemistry. 2001;73:434–438. doi: 10.1021/ac001241s. [DOI] [PubMed] [Google Scholar]
- Zhen Y, Xu N, Richardson B, Becklin R, Savage JR, Blake K, Peltier JM. Development of an LC-MALDI method for the analysis of protein complexes. J Am Soc Mass Spectrom. 2004;15:803–22. doi: 10.1016/j.jasms.2004.02.004. [DOI] [PubMed] [Google Scholar]
- Perkins DN, Pappin DJ, Creasy DM, Cottrell JS. Probability-based protein identification by searching sequence databases using mass spectrometry data. Electrophoresis. 1999;20:3551–3567. doi: 10.1002/(SICI)1522-2683(19991201)20:18<3551::AID-ELPS3551>3.0.CO;2-2. [DOI] [PubMed] [Google Scholar]
- Schmidt F, Schmid M, Jungblut PR, Mattow J, Facius A, Pleissner KP. Iterative data analysis is the key for exhaustive analysis of peptide mass fingerprints from proteins separated by two-dimensional electrophoresis. J Am Soc Mass Spectrom. 2003;14:943–56. doi: 10.1016/S1044-0305(03)00345-3. [DOI] [PubMed] [Google Scholar]
- Tabb DL, MacCoss MJ, Wu CC, Anderson SD, Yates JRr. Similarity among tandem mass spectra from proteomic experiments: detection, significance, and utility. Anal Chem. 2003;75:2470–7. doi: 10.1021/ac026424o. [DOI] [PubMed] [Google Scholar]
- Wolski WE, Lalowski M, Martus P, Herwig R, Giavalisco P, Gobom J, Sickmann A, Lehrach H, Reinert K. Transformation and other factors of the peptide mass spectrometry pairwise peak-list comparison process. BMC Bioinformatics. 2005;6:285. doi: 10.1186/1471-2105-6-285. [DOI] [PMC free article] [PubMed] [Google Scholar]
- Cagney G, Amiri S, Premawaradena T, Lindo M, Emili A. In silico proteome analysis to facilitate proteomics experiments using mass spectrometry. Proteome Science. 2003;1:5. doi: 10.1186/1477-5956-1-5. http://www.Proteomesci.com/content/1/1/5 [DOI] [PMC free article] [PubMed] [Google Scholar]
- Bairoch A, Apweiler R, Wu CH, Barker WC, Boeckmann B, Ferro S, Gasteiger E, Huang H, Lopez R, Magrane M, Martin MJ, Natale DA, O'Donovan C, Redaschi N, Yeh LSL. The Universal Protein Resource (UniProt) Nucleic Acids Res. 2005:D154–9. doi: 10.1093/nar/gki070. [DOI] [PMC free article] [PubMed] [Google Scholar]
- Becker RA, Chambers JM, Wilks AR. The New S Language. London: Chapman & Hall; 1988. [Google Scholar]
- Samuelsson J, Dalevi D, Levander F, Rognvaldsson T. Modular, Scriptable, and Automated Analysis Tools for High-Throughput Peptide Mass Fingerprinting. Bioinformatics. 2004 doi: 10.1093/bioinformatics/bth460. [DOI] [PubMed] [Google Scholar]
- Venables WN, Ripley BD. Modern Applied Statistics with S. Fourth. Springer; 2002. http://www.stats.ox.ac.uk/pub/MASS4/ [ISBN 0-387-95457-0] [Google Scholar]
- Bruker Daltonics – enabling life science tools based on mass spectrometry. 2004. http://www.bdal.com
- Giavalisco P, Nordhoff E, Kreitler T, Kloeppel KD, Lehrach H, Klose J, Gobom J. Proteome Analysis of Arabidopsis Thaliana by 2-D Electrophoresis and Matrix Assisted Laser Desorption/Ionization Time of Flight Mass Spectrometry. [To appear in Proteomics] [DOI] [PubMed]
- Klose J, Kobalz U. Two-dimensional electrophoresis of proteins: an updated protocol and implications for a functional analysis of the genome. Electrophoresis. 1995;16:1034–59. doi: 10.1002/elps.11501601175. [DOI] [PubMed] [Google Scholar]
- Pruitt KD, Tatusova T, Maglott DR. NCBI Reference Sequence project: update and current status. Nucleic Acids Res. 2003;31:34–7. doi: 10.1093/nar/gkg111. [DOI] [PMC free article] [PubMed] [Google Scholar]
- Emde AK. Protein Sequence Digester. 2004. http://www.inf.fu-berlin.de/~emde/
- Mascot. 2005. http://www.matrixscience.com
- Glockner FO, Kube M, Bauer M, Teeling H, Lombardot T, Ludwig W, Gade D, Beck A, Borzym K, Heitmann K, Rabus R, Schlesner H, Amann R, Reinhardt R. Complete genome sequence of the marine planctomycete Pirellula sp. strain 1. Proc Natl Acad Sci USA. 2003;100:8298–303. doi: 10.1073/pnas.1431443100. [DOI] [PMC free article] [PubMed] [Google Scholar]


