

Abstract
Recent syntheses indicate that global warming affects diverse biological processes, but also highlight the potential for some species to adapt behaviourally or evolutionarily to rapid climate change. Far less attention has addressed the alternative, that organisms lacking this ability may face extinction, a fate projected to befall one-quarter of global biodiversity. This conclusion is controversial, in part because there exist few mechanistic studies that show how climate change could precipitate extinction. We provide a concrete, mechanistic example of warming as a stressor of organisms that are closely adapted to cool climates from a comparative analysis of organismal tolerance among clinally varying populations along a natural thermal gradient. We found that two montane salamanders exhibit significant metabolic depression at temperatures within the natural thermal range experienced by low and middle elevation populations. Moreover, the magnitude of depression was inversely related to native elevation, suggesting that low elevation populations are already living near the limit of their physiological tolerances. If this finding generally applies to other montane specialists, the prognosis for biodiversity loss in typically diverse montane systems is sobering. We propose that indices of warming-induced stress tolerance may provide a critical new tool for quantitative assessments of endangerment due to anthropogenic climate change across diverse species.
Keywords: metabolic depression, climate change, salamander, life history, environmental stress, conservation assessment
1. Introduction
Compelling indications of global warming have emerged from documentation of adaptive organismal responses as varied as poleward shifts in range and phenological changes in breeding (Walther et al. 2002; Parmesan & Yohe 2003; Root et al. 2003). These effects have been modelled (Peterson et al. 2002; Williams et al. 2003; Thomas et al. 2004), and impacts upon some emergent ecological properties (population size, range size, breeding timing) have been documented (Gitay et al. 2002; Walther et al. 2002; Parmesan & Yohe 2003; Root et al. 2003). While dynamic responses of diverse organisms provide statistical support for the hypothesis that global warming is occurring, they also show that many species have the capacity to respond adaptively, both behaviourally and evolutionarily, to rapid climate change (e.g. Parmesan 1996; Parmesan et al. 1999; Bradshaw & Holzapfel 2001).
Acute or chronic warming-induced stress is the most proximate avenue of effects of warming, and tolerance of it is a necessary antecedent of any further behavioural or evolutionary response to climate change. Implications of global warming for this proximate physiological response of organisms are poorly studied. Of particular concern are species specialized to cool microclimates, such as montane-adapted organisms. They probably lack the physiological capacity to tolerate warming-induced stress, the ability to disperse out of their native ranges, or both, and are thus especially vulnerable to population decline, genetic erosion and, ultimately, to extinction.
Analysis of physiological and adaptive responses of clinally varying populations to challenges that mimic anticipated warming trends can illuminate how organisms might respond physiologically or otherwise to subsequent climate change. For instance, selection experiments showed that a tropical drosophilid cannot evolve further desiccation resistance due to low genetic variation for the trait (Hoffmann et al. 2003). Other studies (e.g. Gaston & Chown 1999; Addo-Bediako et al. 2000; Zani et al. 2005; J. Bernardo, R. J. Ossola, J. R. Spotila and K. A. Crandall, unpublished work) have detected signals of clinal or interspecific variation in physiological tolerances, but in most cases, specific mechanisms underlying the patterns remain elusive.
Here, we use clinally varying populations of montane salamanders (genus Desmognathus) as a model system to examine the nature and extent of physiological tolerance for increasing temperatures. These populations experience dramatically different thermal and prey resource environments, and exhibit substantial phenotypic variation in most life-history traits (Bernardo 1994; Bernardo & Reagan-Wallin 2002; Bernardo & Agosta 2003). We studied resting metabolic rates as a function of temperatures experienced in the natural populations (figure 1). We asked (i) whether populations that inhabit different thermal environments show local differences in physiological tolerance, and (ii) if there is any evidence of metabolic stress in response to the natural range of temperatures they experience.
Figure 1.
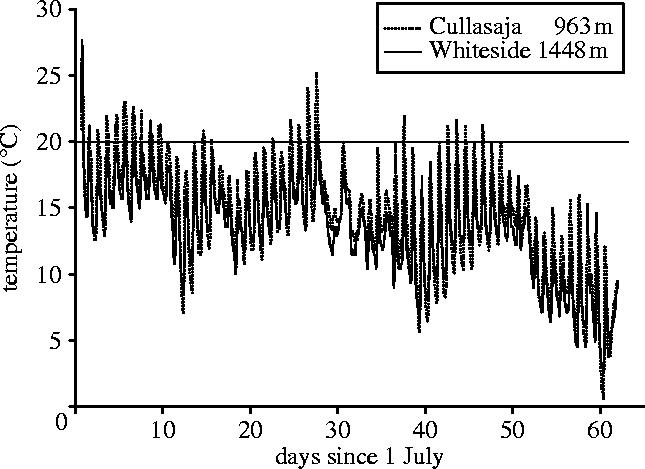
Representative summer rockface surface temperatures at low (Cullasaja, 963 m) and middle elevation (Whiteside, 1448 m) study sites. Data were obtained from micro-dataloggers (Onset Computer Corporation, Pocasset, MA, USA) deployed directly on surfaces where salamanders are active.
2. Material and methods
(a) Collection and maintenance of salamanders
We studied two species endemic to the topographically diverse Southern Appalachian Highlands of eastern North America because of our interest in their life-history variation in this region. These salamanders have restricted distributions from ca 900 m to the apex of the highest peaks (2037 m). The study populations spanned this range: Desmognathus carolinensis (Asheville Watershed, AW, 1737 m) along the Blue Ridge Parkway, Mt. Mitchell, Yancey County, North Carolina; Desmognathus ocoee: Whiteside Mountain (WS, 1448 m); Cullasaja Gorge (CUL, 963 m), Macon County, North Carolina. Salamanders were housed for at least 72 h without food in 250 ml plastic boxes containing moist moss and held in a room experiencing natural photo- and thermoperiods. Ambient temperatures (7–18.5 °C) paralleled field conditions (figure 1).
(b) Experimental design
We employed a full factorial design to estimate means and variances of resting metabolism as functions of body size (continuous covariate in analysis of covariance (ANCOVA)), temperature (5, 10, 15, 20 °C) and population. Individuals were used only within a single cell of this design, yielding statistically independent estimates of effects at each temperature level and meaningful estimates of within- and among-population variance in metabolic rate, an under-appreciated aspect of physiological traits (Garland & Adolph 1991). Importantly, we estimated O2 consumption at temperatures within the actual range normally experienced in a diel cycle in the field (figure 1; Bernardo 1994, 1998). Temperature was constant for a given trial (a constraint of the instrument), thus we included salamanders from all design cells within each trial. We conducted all trials for a given temperature sequentially, but order of temperature presentation was random. We assayed the metabolisms of 34–35 animals per population (7–9/temperature) for an experiment-wide total of 108.
(c) Oxygen consumption measurements
We used a Gilson Differential Respirometer to measure resting O2 consumption. For each individual, we used paired active and reference reaction vessels (15 ml flasks) containing 0.5 ml H2O to balance water vapour pressure and a soaked wick (20% KOH) in a centre well to absorb CO2. Test temperatures ±0.1 °C were achieved by submerging vessels in a circulating water bath with thermostatically controlled heating and refrigeration. Reaction vessels were lowered to the same depth after all salamanders were introduced. Trials were initiated after vessels were open-equilibrated for 30–60 min; both subjects (0.046–0.453 g) and vessels were small. Volumetric changes corresponding to decreases in P(O2) in the reaction vessel were noted at 30 min intervals. Gas volumes were converted to standard temperature and pressure (STP) for analysis. After each trial, salamanders were measured (snout-to-vent length, SVL, to posterior tip of vent, 0.01 mm precision) and weighed (0.001 g precision).
(d) Statistical analyses and estimation of metabolic depression
Exploratory analysis showed O2 consumption to be exponentially related to body mass, thus both variables were ln-transformed so that we could use ANCOVA to test for hypothesized effects. Least square means (LSM), which represent parametric estimates of population-specific O2 consumption levels adjusted for ANCOVA model effects, were employed to estimate the magnitude (percentage of reduction in basal O2 levels) of metabolic depression (MD) in each population. MD was estimated in two ways. The first is a minimum (conservative) estimate calculated as the ratio of LSM O2 consumption at 20 °C to that at 15 °C (MDmin=100×(1−(LSM VO2 20 °C/LSM VO2 15 °C)). This minimum estimate probably underestimates depression, because resting metabolism at 15 °C is expected to be lower than that at 20 °C if there were no depression. To obtain a more biologically reasonable estimate, MDbr, we computed the ratio of the observed value at 20 °C to the predicted value at 20 °C (from linear regression of LSMs from 5 to 15 °C shown in figure 2a) and the observed least squares mean at 20 °C: MDbr=100×(1−(LSM VO2 20 °C obs/VO2 20 °C pred)).
Figure 2.

(a) Temperature-dependent metabolic rates and metabolic depression in three populations along a natural thermal gradient. Symbols (circles: Cullasaja, 963 m; triangles: Whiteside, 1448 m; squares: Asheville Watershed, 1737 m) depict LSM (±1 s.e.) of seven to nine individuals assayed at each temperature, and adjusted for ANCOVA model effects (table 1; §2). Solid lines illustrate second-order regression encompassing all data within each plot, whereas dashed lines illustrate the linear regression of LSM O2 consumption at 5, 10 and 15 °C used to predict O2 consumption at 20 °C for one estimate of metabolic depression ((b); §2). (b) Two estimates of metabolic depression (MD) as a function of elevation among three salamander populations along a natural thermal gradient. For each population, solid symbols (as in (b)) depict MDmin=100×(1−(LSM VO2 20 °C/LSM VO2 15 °C). Fit statistics for MDmin are: r2>0.994, F1,2=170.009, p=0.0487. Open symbols depict MDbr (based on the ratio of observed to predicted O2 consumption at 20 °C (MDbr=100×(1−(LSM VO2 20 °C obs/VO2 20 °C pred)); see §2). Fit statistics for MDbr are: r2>0.999, F1,2=3651.5, p=0.0105). Dashed lines represent 95% confidence intervals about the these fits.
3. Results
We supposed that life-history clines (Bernardo 1994; Bernardo & Reagan-Wallin 2002; Bernardo & Agosta 2003) might reflect, in part, evolutionary adaptations of physiological tolerances of the populations (Garland & Adolph 1991; Feder et al. 2000). Instead, we found a highly conserved metabolic response to a range of field temperatures (5–15 °C; figure 1) across both species from all sites (figure 2a; table 1). Size-adjusted metabolic rates (i.e. LSMs from ANCOVA) increased linearly over this range and the population-specific slopes of the relationships were statistically indistinguishable (table 1). Moreover, all populations similarly showed significant MD between 15 and 20 °C (figure 2a, solid lines), well within the range of normal summer temperatures (figure 1) experienced in both the middle and low elevation populations (which occurs near the low elevational limit of the species' distribution; Bernardo 1994).
Table 1.
Analysis of covariance (ANCOVA) in oxygen consumption of two species of salamanders as a function of body mass (covariate), temperature and site of origin. (Model F12,103=22.298, p<0.0001; SS, sum of squares.)
| source of variation | d.f. | type III SS | F-ratio | prob>F |
|---|---|---|---|---|
| ln (mass) | 1 | 6.005 | 25.102 | <0.0001 |
| temperature | 3 | 15.342 | 21.376 | <0.0001 |
| site | 2 | 0.053 | 0.293 | 0.747 |
| site×temperature | 6 | 0.581 | 0.405 | 0.874 |
| error | 73 | 21.771 | ||
| corrected total | 103 | 44.069 |
The magnitude of MD varied inversely with native elevation (figure 2b). Salamanders from the lowest elevation suffered 42.8–55.5% depression in resting metabolic rates (depending on method; figure 2b), greater depression than has been reported for any other amphibian (Guppy & Withers 1999) except aestivating sirenid salamanders (Etheridge 1990).
4. Discussion
Our finding that low elevation Desmognathus populations exhibit one of the highest levels of MD yet discovered for an amphibian, and the highest for a non-aestivating species, suggests that these organisms are living at or near the limit of their physiological tolerances. Moreover, this physiological constraint apparently already restricts their ability to disperse through warmer, drier valleys (J. Bernardo, R. J. Ossola, J. R. Spotila and K. A. Crandall, unpublished work).
This intrinsic constraint portends a cascade of negative biological responses by physiologically specialized, cold-adapted organisms to global warming mediated through metabolic stress. First, upslope movement of the lower downslope limit of tolerance will cause range contraction (e.g. Wilson et al. 2005), because concomitant range expansion beyond the upper range margin (as observed in many other organisms; e.g. Parmesan et al. 1999; Davis & Shaw 2001) is impossible.
An insidious consequence of range contraction that has received little attention is that it will precipitate population genetic changes via two mechanisms: erosion of in situ genetic variability due to smaller effective population sizes and reduced dispersal due to warming and drying of intermontane corridors (Still et al. 1999; Williams et al. 2003), and by up-mountain range expansion of more xeric-adapted competitors and predators (Pounds et al. 1999). These underappreciated effects of range contraction will exacerbate genetic fragmentation of semi-isolated populations (Tilley 1997), which may be further amplified by anthropogenic habitat alteration (Lawton et al. 2001).
Warming-induced stress will also precipitate or exacerbate extrinsic biotic stressors. Upslope migration of downslope predators and competitors with higher thermal tolerance may alter the nature and intensity of interspecific interactions (e.g. Pounds et al. 1999). In this particular system, already structured by strong interspecific interactions (Hairston 1986), the negative effects of increased densities of other salamanders that act as intraguild predators (Bernardo 2002) may further undermine the stability of populations of montane specialists. Warming and drying of high elevation forests (Still et al. 1999; Lawton et al. 2001; Williams et al. 2003) may also reduce suitable habitat and prey resources for montane species.
Our findings of dramatic MD in montane-adapted salamanders exemplify how physiological constraints can impede or preclude adaptive (behavioural or evolutionary) responses to warming, and provide a mechanistic basis for predictions of genetic erosion and possible extinction. We propose that comparative surveys of species differences in the magnitude of metabolic stress could provide a meaningful, mechanistic index of susceptibility to warming and climate change (e.g. J. Bernardo, R. J. Ossola, J. R. Spotila and K. A. Crandall, unpublished work). Thus, such analyses may serve as an objective criterion useful in conservation assessments, which currently rely exclusively upon ecological indicators, such as population size, life-history growth potential and range size (IUCN 2001).
Finally, our results suggest that global warming will cause disproportionately higher extinction rates in organisms that are physiologically specialized to cool habitats. This is sobering because global diversity in montane systems is comparatively higher per unit area than in most other biomes (Körner & Spehn 2002), implying that extinction forecasts based largely upon non-montane flora and fauna (e.g. Peterson et al. 2002; Thomas et al. 2004; but see Williams et al. 2003) may underestimate the true extent of biodiversity loss due to anthropogenic climate change.
Acknowledgments
Research was supported by NSF (BSR/PBPE 9001587; DEB 94-07844; BIR-94-11048) and the Cocos Foundation (J.B.). This is contribution No. 3 from the Southern Appalachian Biodiversity Institute. Permits were obtained from the National Park Service and the state of North Carolina. We thank two anonymous reviewers for helpful suggestions.
References
- Addo-Bediako A, Chown S.L, Gaston K.J. Thermal tolerance, climatic variability and latitude. Proc. R. Soc. B. 2000;267:739–745. doi: 10.1098/rspb.2000.1065. doi:10.1098/rspb.2000.1065 [DOI] [PMC free article] [PubMed] [Google Scholar]
- Bernardo J. Experimental analysis of allocation in two divergent, natural salamander populations. Am. Nat. 1994;143:14–38. doi:10.1086/285594 [Google Scholar]
- Bernardo J. The logic, value and necessity of grounding experiments in quantitative field data: an essential link in the inferential chain back to nature. In: Resetarits W.J, Bernardo J, editors. Experimental ecology: issues and perspectives. Oxford University Press; New York: 1998. pp. 370–393. [Google Scholar]
- Bernardo J. Natural history notes: Desmognathus carolinenesis and Plethodon welleri; Desmognathus monticola and Desmognathus wrighti; Gyrinophilus porphyriticus and Desmognathus ocoee (Ocoee salamander). Intraguild predation. Herpetol. Rev. 2002;33:121. [Google Scholar]
- Bernardo J, Agosta S. Determinants of clinal variation in life history of dusky salamanders (Desmognathus ocoee): prey abundance and ecological limits on foraging time restrict opportunities for larval growth. J. Zool. Lond. 2003;259:411–421. [Google Scholar]
- Bernardo J, Reagan-Wallin N.L. Plethodontid salamanders do not conform to “general rules” for ectotherm life histories: insights from allocation models about why simple models do not make accurate predictions. Oikos. 2002;97:398–414. doi:10.1034/j.1600-0706.2002.970310.x [Google Scholar]
- Bradshaw W.E, Holzapfel C.M. Genetic shift in photoperiodic response correlated with global warming. Proc. Natl Acad. Sci. 2001;98:14 509–14 511. doi: 10.1073/pnas.241391498. doi:10.1073/pnas.241391498 [DOI] [PMC free article] [PubMed] [Google Scholar]
- Davis M.B, Shaw R.G. Range shifts and adaptive responses to quaternary climate change. Science. 2001;292:673–679. doi: 10.1126/science.292.5517.673. doi:10.1126/science.292.5517.673 [DOI] [PubMed] [Google Scholar]
- Etheridge K. The energetics of estivating sirenid salamanders (Siren lacertina and Pseudobranchus striatus) Herpetologica. 1990;46:407–414. [Google Scholar]
- Feder M.E, Bennett A.F, Huey R.B. Evolutionary physiology. Annu. Rev. Ecol. Syst. 2000;31:315–341. doi:10.1146/annurev.ecolsys.31.1.315 [Google Scholar]
- Garland T, Adolph S.C. Physiological differentiation of vertebrate populations. Annu. Rev. Ecol. Syst. 1991;22:193–228. doi:10.1146/annurev.es.22.110191.001205 [Google Scholar]
- Gaston K.J, Chown S.L. Elevation and climatic tolerance: a test using dung beetles. Oikos. 1999;86:584–590. [Google Scholar]
- Gitay H, Suarez A, Dokken D.J, Watson R.T, editors. Climate change and biodiversity. Inter-governmental Panel on Climate Change, Technical Paper V. Geneva, Switzerland. 2002. [Google Scholar]
- Guppy M, Withers P. Metabolic depression in animals: physiological perspectives and biochemical generalizations. Biol. Rev. 1999;74:1–40. doi: 10.1017/s0006323198005258. doi:10.1017/S0006323198005258 [DOI] [PubMed] [Google Scholar]
- Hairston N.G. Species packing in Desmognathus salamanders: experimental demonstration of predation and competition. Am. Nat. 1986;127:266–291. doi:10.1086/284485 [Google Scholar]
- Hoffmann A.A, Hallas R, Deans J, Schiffer M. Low potential for climate stress adaptation in a rainforest Drosophila species. Science. 2003;301:100–102. doi: 10.1126/science.1084296. doi:10.1126/science.1084296 [DOI] [PubMed] [Google Scholar]
- IUCN. 2001 The IUCN Red List of Threatened species. 2001 Categories & Criteria (version 3.1). (http://www.iucnredlist.org/info/categories_criteria2001.html).
- Körner C, Spehn E.M, editors. Mountain biodiversity: a global assessment. CRC Press; New York: 2002. [Google Scholar]
- Lawton R.O, Nair U.S, Pielke R.A, Welch R.M. Climatic impact of tropical lowland deforestation on nearby montane cloud forests. Science. 2001;294:584–587. doi: 10.1126/science.1062459. [DOI] [PubMed] [Google Scholar]
- Parmesan C. Climate and species range. Nature. 1996;382:765–766. doi:10.1038/382765a0 [Google Scholar]
- Parmesan C, Yohe G. A globally coherent fingerprint of climate change impacts across natural systems. Nature. 2003;421:37–42. doi: 10.1038/nature01286. doi:10.1038/nature01286 [DOI] [PubMed] [Google Scholar]
- Parmesan C, et al. Poleward shift of butterfly species' ranges associated with regional warming. Nature. 1999;399:579–583. doi:10.1038/21181 [Google Scholar]
- Peterson A.T, Ortega-Huerta M.A, Bartley J, Sanchez-Cordero V, Soberon J, Buddemeier R.H, Stockwell D.R.B. Future projections for Mexican faunas under global climate change scenarios. Nature. 2002;416:626–629. doi: 10.1038/416626a. doi:10.1038/416626a [DOI] [PubMed] [Google Scholar]
- Pounds J.A, Fogden M.P.L, Campbell J.H. Biological response to climate change on a tropical mountain. Nature. 1999;398:611–615. doi:10.1038/19297 [Google Scholar]
- Root T.L, Price J.T, Hall K.R, Schneider S.H, Rosenzweig C, Pounds J.A. Fingerprints of global warming on wild animals and plants. Nature. 2003;421:57–60. doi: 10.1038/nature01333. doi:10.1038/nature01333 [DOI] [PubMed] [Google Scholar]
- Still C.J, Foster P.N, Schneider S.H. Simulating the effects of climate change on tropical montane cloud forests. Nature. 1999;398:608–610. doi:10.1038/19293 [Google Scholar]
- Thomas C.D, et al. Extinction risk from climate change. Nature. 2004;427:145–148. doi: 10.1038/nature02121. doi:10.1038/nature02121 [DOI] [PubMed] [Google Scholar]
- Tilley S.G. Patterns of genetic differentiation in Appalachian desmognathine salamanders. J. Hered. 1997;88:305–315. [Google Scholar]
- Walther G.-R, Post E, Convey P, Menzel A, Parmesan C, Beebee T.J.C, Fromentin J.-M, Hoegh-Guldberg O, Bairlein F. Ecological responses to recent climate change. Nature. 2002;416:389–395. doi: 10.1038/416389a. doi:10.1038/416389a [DOI] [PubMed] [Google Scholar]
- Williams S.E, Bolitho E.E, Fox S. Climate change in Australian tropical rainforests: an impending environmental catastrophe. Proc. R. Soc. B. 2003;270:1887–1892. doi: 10.1098/rspb.2003.2464. doi:10.1098/rspb.2003.2464 [DOI] [PMC free article] [PubMed] [Google Scholar]
- Wilson R.J, Gutierrez D, Gutierrez J, Martinez D, Agudo R, Monserrat V.J. Changes to the elevational limits and extent of species ranges associated with climate change. Ecol. Lett. 2005;8:1138–1146. doi: 10.1111/j.1461-0248.2005.00824.x. doi:10.1111/j.1461-0248.2005.00824.x [DOI] [PubMed] [Google Scholar]
- Zani P.A, Swanson S.E.T, Corbin D, Cohnstaedt L.W, Agotsch M.D, Bradshaw W.E, Holzapfel C.M. Geographic variation in thermal tolerance of transient thermal stress in the mosquito Wyeomyia smithii. Ecology. 2005;86:1206–1211. [Google Scholar]