

Abstract
Body size and temperature are primary determinants of metabolic rate, and the standard metabolic rate (SMR) of animals ranging in size from unicells to mammals has been thought to be proportional to body mass (M) raised to the power of three-quarters for over 40 years. However, recent evidence from rigorously selected datasets suggests that this is not the case for birds and mammals. To determine whether the influence of body mass on the metabolic rate of vertebrates is indeed universal, we compiled SMR measurements for 938 species spanning six orders of magnitude variation in mass. When normalized to a common temperature of 38 °C, the SMR scaling exponents of fish, amphibians, reptiles, birds and mammals are significantly heterogeneous. This suggests both that there is no universal metabolic allometry and that models that attempt to explain only quarter-power scaling of metabolic rate are unlikely to succeed.
Keywords: scaling, allometry, metabolic rate, body mass, body temperature
1. Introduction
The study of the allometric relationship between metabolic rate and body mass is currently in the midst of a renaissance (see Agutter & Wheatley 2004 for a recent review). Much of the impetus for this renewed interest can be attributed to the publication of models (Banavar et al. 1999, 2002; West et al. 1997, 1999) seeking to explain the widely accepted observation that metabolic rate is proportional to body mass raised to the three-quarter power (M0.75) in organisms ranging in size from unicells to large mammals (Hemmingsen 1960). However, it is now clear that the basal metabolic rate of endotherms scales with an exponent less than three-quarters (White & Seymour 2003; McKechnie & Wolf 2004), and the empirical and mathematical support for a universal metabolic allometry have been questioned (Dodds et al. 2001; Bokma 2004; Kozlowski & Konarzewski 2004). Although many physiological rates and time-scale with exponents that are close to simple multiples of one-quarter (Savage et al. 2004), many others do not, and recognition of this has led to attempts to link cellular and whole-animal metabolism in a phenomenological description of scaling exponent heterogeneity (Darveau et al. 2002; Hochachka et al. 2003). However, before the non-isometric scaling of metabolic rate can be adequately explained, it must first be characterized.
2. Material and methods
We compiled values for body mass (M) and standard metabolic rate (SMR) from the peer-reviewed literature and located measurements for species ranging in mass from 154 mg to 138 kg (see Electronic Appendix). Data were separated into five groups for analysis: fish, amphibians, reptiles, birds and mammals. All available data were used for determination of the temperature dependence of metabolism, and species' averages of temperature-normalized data were used for determination of scaling exponents. This was necessary to avoid over-representation of frequently studied species in the scaling relationships. The temperature normalization was undertaken according to both van't Hoff (Q10) and Boltzmann–Arrhenius principles (UTD normalization: Gillooly et al. 2001). The van't Hoff principle has long been the mainstay for the description of the temperature dependence of metabolism and, at least for mammals (which have the largest dataset), accounts for more of the temperature-associated variation in metabolism than does UTD normalization (White & Seymour 2003). However, for the poikilothermic species in the present dataset, ln(SMR) is not linearly related to temperature; temperature is not a significant factor in a model that described ln(SMR) in terms of the following fixed factors: group (fish, reptile, amphibian)+temperature+1000/temperature+ln(M)+group×temperature+group×1000/temperature+group ln(M) and a random factor: species; all other factors and interactions were significant (p<0.05). Thus, while there is no theoretical justification for preferring either van't Hoff or UTD normalization (Clarke 2004), UTD normalization provides a better description of the temperature dependence of metabolism for the poikilothermic species, and both van't Hoff and UTD normalization were undertaken.
The data were not ‘binned’ (Savage et al. 2004) to account for a perceived over-representation of small species; the distribution of vertebrate body sizes is considered to represent an important component of diversity, rather than a bias that must be accounted for. Furthermore, the body mass composition of the most well-represented group in the dataset (mammals) closely matches that of extant species (Blackburn & Gaston 1998): when divided into size classes spanning 0.5 log units of body mass, species weighing less than 32 g are under-represented by 0.7–6.3% (mean: 2.6%), species in the range 32 g to 10 kg are over-represented by 1.7–6.8% (mean: 3.5%), and species >10 kg are under-represented by 0.2–2.8% (mean: 1.3%). The distribution of body masses of the sample of birds is similarly close to that of extant species (Blackburn & Gaston 1994), with differences of −2.8% to 6.2%, but comparable body mass distribution data are not available for fish, reptiles and amphibians. Pough's (1980) body mass data, estimated from snout–vent length measurements of 5339 species, suggest that body mass classes within the present amphibian dataset are appropriately distributed (differences of −3.3 to 2.7%), while large (>100 g) reptiles are over-represented by 14% and small ones (<100 g) are under-represented by 1.6–5.7%.
SMRs for endotherms were included only if measured under basal conditions (McNab 1997; Frappell & Butler 2004) and if body temperature was recorded. Data for lineages for which basal conditions are unlikely to be achieved (Artiodactyla, Lagomorpha, Macropodidae, Soricidae) were excluded for reasons discussed elsewhere (White & Seymour 2003, 2005). SMRs for poikilotherms were included only if measured under standard resting conditions at a known ambient temperature (Ta, range: 1–45 °C). However, the MR elevation that follows feeding for endotherms (White & Seymour 2005) is smaller and shorter in duration than that of reptiles (Secor & Diamond 1997), whose MR continues to decline following feeding: long-term fasted animals have MRs significantly lower than postabsorptive ones (Bedford & Christian 2001). Care was therefore taken to ensure, as far as possible, that data for poikilotherms were included only if animals were fasted for sufficiently long to ensure a postabsorptive state, but not so long that MR had declined significantly below postabsorptive levels.
Within each group, normalization to a common Ta (38 °C for endotherms; 38 °C and 20 °C for poikilotherms) was first accomplished by iteratively simultaneously solving for Q10 and the scaling exponent (White & Seymour 2005). The Q10 used for temperature normalization was calculated as the ordinary least squares (OLS) slope of the relationship between ln(mass-independent MR) and Ta; mass-independent MR was calculated using a scaling exponent derived from the OLS slope of the relationship between ln(Q10 normalized MR) and ln(M). This Q10 was then used to normalize to the common Ta, and species' mean SMR values were calculated. Scaling exponents were then calculated as the OLS slope of the relationship between species' mean log (SMR) and log(M). The process was then repeated using UTD principles, with Boltzmann–Arrhenius factors calculated as the OLS slope of the relationship between ln(mass-independent MR) and 1/Ta (Gillooly et al. 2001). An assumption inherent within these procedures is that the relationship between ln(mass-independent MR) and temperature (or 1/temperature) is strictly linear within each of the species considered. The relationship between ln(mass-independent MR) and Ta was therefore determined individually for each poikilothermic species for which more than three measurements at three or more temperatures were available (n=122). The majority (61%) of the significant relationships were linear (i.e. Ta p≤0.05, Ta2 p>0.05); only 28% were quadratic (i.e. Ta p≤0.05, Ta2 p≤0.05). Thus, although the relationship between ln(mass-independent MR) and Ta is nonlinear for some species, the majority of significant relationships are linear, and the proportion of all relationships (both significant and non-significant) that were nonlinear (8%) is similar to the 5% expected by chance alone. To minimize potential problems introduced by this limited nonlinearity, the data for poikilotherms are presented normalized to both 38 °C, for comparison with endotherms, and 20 °C, a round figure close to the mean Ta at which measurements were made (18.9±8.1 (s.d.)). Differences in allometric exponent between all groups were then assessed using species' average log-transformed data (comparison of regression slope confidence interval overlap) with α set at 0.05. The use of reduced major axis (RMA) regression produced a similar pattern, although RMA slopes tended to be higher than OLS ones (table 1).
Table 1.
Parameter estimates for the scaling relationship between standard metabolic rate (SMR, mL O2 h−1) and body mass (M, g) normalized to 38 °C; SMR=aMb. (n is the number of species (number of measurements used for Q10 determination in parentheses). Q10 values in parentheses are 95% confidence limits. Allometric coefficient (a) values are for 38 °C (and 20 °C in parentheses for poikilotherms). 95% CI values for the allometric exponents (b) are in parentheses. OLS is the ordinary least squares regression, RMA is the reduced major axis regression calculated by passing the RMA exponent (=bOLS/√[r2]) through the bivariate log–log mean.)
| OLS | RMA | ||||||
|---|---|---|---|---|---|---|---|
| n | Q10 | a | b | a | b | r2 | |
| fish | 82 (1107) | 1.65 (1.56–1.74) | 0.22 (0.09) | 0.88 (0.06) | 0.19 (0.08) | 0.91 (0.06) | 0.92 |
| amphibians | 158 (682) | 2.21 (2.05–2.37) | 0.34 (0.08) | 0.88 (0.05) | 0.30 (0.07) | 0.94 (0.05) | 0.88 |
| reptiles | 159 (483) | 2.44 (2.25–2.64) | 0.55 (0.11) | 0.76 (0.04) | 0.46 (0.09) | 0.80 (0.04) | 0.91 |
| birds | 83 (83) | 2.09 (1.45–3.05) | 6.07 | 0.64 (0.03) | 5.36 | 0.66 (0.03) | 0.95 |
| mammals | 456 (469) | 2.81 (2.44–3.24) | 4.98 | 0.676 (0.013) | 5.10 | 0.69 (0.013) | 0.96 |
3. Results and discussion
Our analysis of 2824 measurements of 938 species of vertebrate expands upon the 424 measurements presented by Gillooly et al. (2001) and reveals significant allometric exponent heterogeneity (figure 1). With the exception of fish, Q10 falls between 2 and 3 for all groups (table 1). The Q10 value for fish is significantly lower than that for all other groups except birds, despite being relatively uncertain. Mammals have the highest Q10 (2.8), which is significantly higher than fish and amphibians (table 1). The SMR scaling exponent for reptiles is not influenced by the overrepresentation of species weighing more than 100 g: the scaling exponent for small (<100 g) reptiles is not significantly different from that of large (>100 g) ones (ANOVA mass×size class interaction, p=0.67 for van't Hoff normalized SMR, p=0.65 for Boltzmann–Arrhenius normalized SMR). When normalized to a common temperature of 38 °C using van't Hoff (Q10) principles, fish and amphibians do not have significantly different SMRs and scale with exponents significantly higher than reptiles (table 1). The exponent for reptiles is significantly higher than that for birds and mammals. The normalization of poikilotherm data to 20 °C did not change any exponents, but influenced only the allometric coefficients (a, where SMR=aMb: table 1). Temperature normalization according to van't Hoff and Boltzmann–Arrhenius principles produced scaling exponents that differed by only ±0.03% (table 2). The largest difference between the two temperature normalization procedures was in the scaling coefficient of the poikilothermic groups at 38 °C, which were 2.2%, 4.5% and 1.9% lower for fish, amphibians and reptiles, respectively, when normalization was conducted according to Boltzmann–Arrhenius rather than van't Hoff principles (table 2). The finding of significant allometric exponent heterogeneity fails to support Hemmingsen's (1960) and Gillooly et al.'s (2001) suggestion that the relationship between metabolic rate and body mass is uniform across all organisms. The exponent heterogeneity observed between groups, and that observed between metabolic levels within groups (White & Seymour 2005), suggest that the search for an explanation for the non-isometric scaling of metabolic rate is unlikely to end with models that explain only quarter-power scaling.
Figure 1.
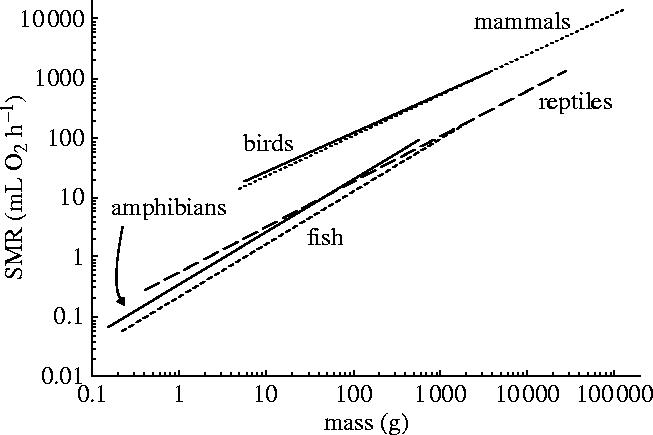
Scaling relationships between SMR normalized to a body temperature of 38 °C and body mass for mammals, birds, reptiles, amphibians and fish. Q10 values used for temperature normalization are presented in table 1, as are OLS (pictured) and RMA regression parameters.
Table 2.
Scaling relationship between standard metabolic rate (SMR, mL O2 h−1) and body mass (M, g) normalized to 38 °C (20 °C in parentheses) according to van't Hoff (Q10) and Boltzmann–Arrhenius (UTD: Gillooly et al. 2001) principles; SMR=aMb.
| group | Q10 | UTD |
|---|---|---|
| fish | 0.224 M0.879 (0.091 M0.879) | 0.213 M0.879 (0.092 M0.879) |
| amphibians | 0.335 M0.884 (0.081 M0.884) | 0.302 M0.884 (0.081 M0.884) |
| reptiles | 0.560 M0.768 (0.110 M0.768) | 0.536 M0.769 (0.111 M0.769) |
| birds | 5.773 M0.644 | 5.801 M0.644 |
| mammals | 4.648 M0.678 | 4.668 M0.678 |
Supplementary Material
References
- Agutter P.S, Wheatley D.N. Metabolic scaling: consensus or controversy? Theor. Biol. Med. Model. 2004;1 doi: 10.1186/1742-4682-1-13. Available from http://www.tbiomed.com/content/1/1/13. [DOI] [PMC free article] [PubMed] [Google Scholar]
- Banavar J.R, Maritan A, Rinaldo A. Size and form in efficient transportation networks. Nature. 1999;399:130–131. doi: 10.1038/20144. doi:10.1038/20144 [DOI] [PubMed] [Google Scholar]
- Banavar J.R, Damuth J, Maritan A, Rinaldo A. Supply–demand balance and metabolic scaling. Proc. Natl Acad. Sci. USA. 2002;99:10 506–10 509. doi: 10.1073/pnas.162216899. doi:10.1073/pnas.162216899 [DOI] [PMC free article] [PubMed] [Google Scholar]
- Bedford G.S, Christian K.A. Metabolic response to feeding and fasting in the water python (Liasis fuscus) Aust. J. Zool. 2001;49:379–387. doi:10.1071/ZO01017 [Google Scholar]
- Blackburn T.M, Gaston K.J. The distribution of body sizes of the world's bird species. Oikos. 1994;70:127–130. [Google Scholar]
- Blackburn T.M, Gaston K.J. The distribution of mammal body masses. Divers. Distrib. 1998;4:121–133. doi:10.1046/j.1365-2699.1998.00015.x [Google Scholar]
- Bokma F. Evidence against universal metabolic allometry. Funct. Ecol. 2004;18:184–187. doi:10.1111/j.0269-8463.2004.00817.x [Google Scholar]
- Clarke A. Is there a universal temperature dependence of metabolism? Funct. Ecol. 2004;18:252–256. doi:10.1111/j.0269-8463.2004.00842.x [Google Scholar]
- Darveau C.A, Suarez R.K, Andrews R.D, Hochachka P.W. Allometric cascade as a unifying principle of body mass effects on metabolism. Nature. 2002;417:166–170. doi: 10.1038/417166a. doi:10.1038/417166a [DOI] [PubMed] [Google Scholar]
- Dodds P.S, Rothman D.H, Weitz J.S. Re-examination of the ‘3/4-law’ of metabolism. J. Theor. Biol. 2001;209:9–27. doi: 10.1006/jtbi.2000.2238. doi:10.1006/jtbi.2000.2238 [DOI] [PubMed] [Google Scholar]
- Frappell P.B, Butler P.J. Minimal metabolic rate, what it is, its usefulness, and its relationship to the evolution of endothermy: a brief synopsis. Physiol. Biochem. Zool. 2004;77:865–868. doi: 10.1086/425191. doi:10.1086/425191 [DOI] [PubMed] [Google Scholar]
- Gillooly J.F, Brown J.H, West G.B, Savage V.M, Charnov E.L. Effects of size and temperature on metabolic rate. Science. 2001;293:2248–2251. doi: 10.1126/science.1061967. doi:10.1126/science.1061967 [DOI] [PubMed] [Google Scholar]
- Hemmingsen A.M. Energy metabolism as related to body size and respiratory surfaces, and its evolution. Rep. Steno Memorial Hospital Nordisk Insulinlaboratorium. 1960;9:1–110. [Google Scholar]
- Hochachka P.W, Darveau C.A, Andrews R.D, Suarez R.K. Allometric cascade: a model for resolving body mass effects on metabolism. Comp. Biochem. Physiol. A. 2003;134:675–691. doi: 10.1016/s1095-6433(02)00364-1. [DOI] [PubMed] [Google Scholar]
- Kozlowski J, Konarzewski M. Is West, Brown and Enquist's model of allometric scaling mathematically correct and biologically relevant? Funct. Ecol. 2004;18:283–289. doi:10.1111/j.0269-8463.2004.00830.x [Google Scholar]
- McKechnie A.E, Wolf B.O. The allometry of avian basal metabolic rate: good predictions need good data. Physiol. Biochem. Zool. 2004;77:502–521. doi: 10.1086/383511. doi:10.1086/383511 [DOI] [PubMed] [Google Scholar]
- McNab B.K. On the utility of uniformity in the definition of basal rate of metabolism. Physiol. Zool. 1997;70:718–720. doi: 10.1086/515881. [DOI] [PubMed] [Google Scholar]
- Pough F.H. The advantages of ectothermy for tetrapods. Am. Nat. 1980;115:92–112. doi:10.1086/283547 [Google Scholar]
- Savage V.M, Gillooly J.F, Woodruff W.H, West G.B, Allen A.P, Enquist B.J, Brown A.C. The predominance of quarter-power scaling in biology. Funct. Ecol. 2004;18:257–282. doi:10.1111/j.0269-8463.2004.00856.x [Google Scholar]
- Secor S.M, Diamond J. Determinants of the postfeeding metabolic response of Burmese pythons, Python molurus. Physiol. Zool. 1997;70:202–212. doi: 10.1086/639578. [DOI] [PubMed] [Google Scholar]
- West G.B, Brown J.H, Enquist B.J. A general model for the origin of allometric scaling laws in biology. Science. 1997;276:122–126. doi: 10.1126/science.276.5309.122. doi:10.1126/science.276.5309.122 [DOI] [PubMed] [Google Scholar]
- West G.B, Brown J.H, Enquist B.J. The fourth dimension of life: fractal geometry and allometric scaling of organisms. Science. 1999;284:1677–1679. doi: 10.1126/science.284.5420.1677. doi:10.1126/science.284.5420.1677 [DOI] [PubMed] [Google Scholar]
- White C.R, Seymour R.S. Mammalian basal metabolic rate is proportional to body mass2/3. Proc. Natl Acad. Sci. USA. 2003;100:4046–4049. doi: 10.1073/pnas.0436428100. doi:10.1073/pnas.0436428100 [DOI] [PMC free article] [PubMed] [Google Scholar]
- White C.R, Seymour R.S. Allometric scaling of mammalian metabolism. J. Exp. Biol. 2005;208:1611–1619. doi: 10.1242/jeb.01501. doi:10.1242/jeb.01501 [DOI] [PubMed] [Google Scholar]
Associated Data
This section collects any data citations, data availability statements, or supplementary materials included in this article.