

Abstract
We present an extensive ancient DNA analysis of mainly Neolithic cattle bones sampled from archaeological sites along the route of Neolithic expansion, from Turkey to North-Central Europe and Britain. We place this first reasonable population sample of Neolithic cattle mitochondrial DNA sequence diversity in context to illustrate the continuity of haplotype variation patterns from the first European domestic cattle to the present. Interestingly, the dominant Central European pattern, a starburst phylogeny around the modal sequence, T3, has a Neolithic origin, and the reduced diversity within this cluster in the ancient samples accords with their shorter history of post-domestic accumulation of mutation.
Keywords: ancient DNA, Bos taurus, Neolithic, domestication, mitochondrial haplotypes, starburst network
1. Introduction
During the Neolithic ca 10 000 BP, the crucial development of domestication of wild plants and animals accompanied substantial changes in human culture, and it was during this time that the foundation was laid for our way of life today. Archaeological evidence indicates that the Neolithic culture expanded out of the Near East into the Balkans, Greece and into Northern Central Europe after 6400 BP. It is known that the wild ancestor of cattle, the aurochs (Bos primigenius), ranged widely throughout Europe. However, inference from mtDNA data suggests that bovine maternal lineages (at least) have a Near Eastern rather than local origin.
Mitochondrial data from modern populations show a high diversity in Anatolia and the Middle East, supporting a Near-Eastern matrilineal centre of origin (Troy et al. 2001). Interestingly, partial control region sequence variation in Europe is strongly dominated by a single family of haplotypes that coalesce to a single, numerically predominant sequence, T3 (figure 1c). This T3-centred pattern is replicated in the Middle East, but only as a subset of the total variation in Bos taurus, which shows more phylogenetic complexity in this region (figure 1b). Arguably, the T3-centred and other starburst patterns with different geography are the result of single domesticated haplotypes that now exhibit derivatives resulting from post-domestic accumulation of mutation. This interpretation could be tested through an analysis of an ancient DNA population.
Figure 1.
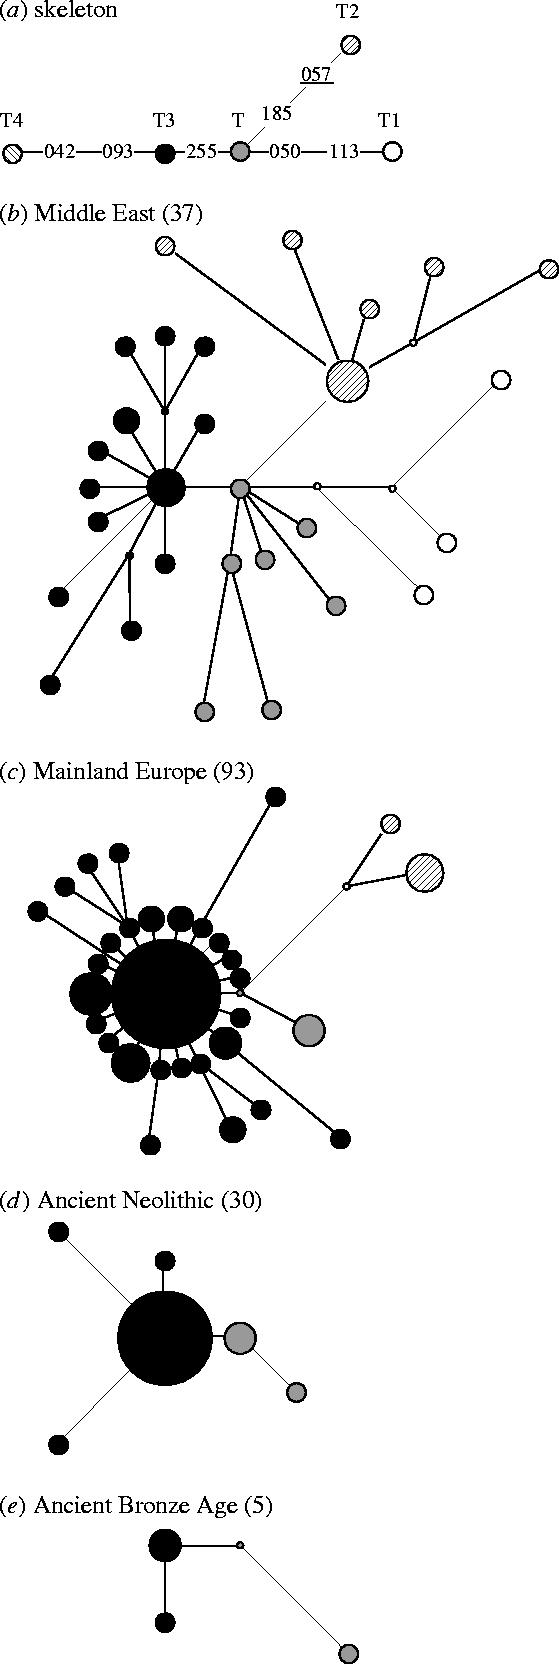
Reduced median phylogenetic networks constructed for B. taurus mtDNA sequences, using 240 bp of the control region (ancient populations include only 189 bp of sequence, but no changes are seen in the 50 bp covered by the primers in any modern samples; Troy et al. 2001). (a) The relationships between the five central, primary B. taurus haplotypes, T, T1, T2, T3 and T4 (Troy et al. 2001; Mannen et al. 2004). Two modern regional haplotype groups are represented: (b) the Middle East and (c) mainland Europe (Troy et al. 2001), as well as the two ancient populations, grouped into time regions of (d) Neolithic and (e) Bronze Age.
Here, we present mtDNA partial control region sequence from 33 Neolithic and six Bronze Age European B. taurus samples. This enables a population genetic approach partitioned by time, in addition to geography. We show that modern northern European phylogeography has Neolithic roots, rather than being a legacy of recent restricted breeding practices, and that calibrations of mtDNA mutation rates are consistent with a domestication scale of time depth for the origins of the dominant expansion signature.
2. Material and methods
(a) Samples
Archaeological bone and tooth material were collected from Central Europe, the Balkans and the Near East. The covered time periods were Late Mesolithic, all periods of Neolithic and Bronze Age. Details are given in the electronic supplementary information; morphometric classification undertaken by archaeologists was available for some bones. In this study, we present 38 samples that can be addressed genetically as domestic cattle, including extended sequences from three previously analysed samples (Edwards et al. 2004).
(b) Sample extraction and amplification
Extraction, contamination control and amplification reactions were as described previously by Burger et al. (2004), Mainz, and by Edwards et al. (2004), Dublin, and followed standard ancient DNA good practice, including the replication of five (ca 13%) analyses in both locations (including sample preparation, extraction and PCR).
(c) Data analyses
mtDNA sequences were aligned by eye, and reduced median networks constructed using the algorithm of Bandelt et al. (1995), using comparison of the 240 bp used by Troy et al. (2001). Analyses of inter-population genetic distances between extant and ancient populations were performed using published modern regional data (Cymbron et al. 1999; Troy et al. 2001; Mannen et al. 2004). Pairwise Fst values were generated according to Slatkin (1995), using the Arlequin computer program (v. 2.000; Schneider et al. 1997). Population affinities were visualized using multidimensional scaling (MDS) implemented by the SPSS package (v. 11.0.1). The ρ statistic (Forster et al. 1996) was used as an unbiased estimator of the coalescence time depth within each haplogroup and was calculated, along with 95% central credible region, using the program CRED (Macaulay 1998).
3. Results and discussion
(a) Authenticity of ancient sequences and success rate
Ancient DNA is affected by post-mortem alterations of bases, which may result in incorrect sequence determination. The data from Mainz were analysed for type 2 (G/C→A/T) transitions, which have been found to comprise the majority of base alterations (Hofreiter et al. 2001). Although 10 deamination hotspots were discovered (see table S4 of the electronic supplementary material), the low deamination rate (1.6% without using Uracil DNA glycosylase (UNG), which cleaves false incorporated deoxyuridines, or deaminated cytosines, to uracil) indicates that when sequences are reproduced, and UNG is used, post-mortem damage can be effectively discounted.
The strict system of contamination prevention in both Mainz and Dublin proved to be successful as all extraction- and PCR-blank controls were negative. Human contamination was excluded by specific primer design and was never observed in any amplification. In both laboratories, the extended reproduction of results underlines the feasibility of the sequences. Approximately 48% (39 out of 81) of all samples generated reproducible DNA.
(b) Sequence results
All data from archaeological finds recorded as B. taurus gave sequences similar to those encountered in modern European cattle, except for one sample from the Late Neolithic site of Svodin, Slovakia, which yielded a sequence identical to two of the six B. primigenius sequences previously described from British wild oxen remains (Bailey et al. 1996; Troy et al. 2001). This single outlier is unlikely to be the result of contamination (possessing a haplotype only encountered thus far in ancient material) and could be either the product of a local hybridization between a female aurochs and a male domestic bull, or might credibly be a consequence of the error associated with morphometric distinction. Distinguishing between these alternatives will require a wider description of the frequency of B. primigenius sequences across a range of morphologically and temporally variable samples; we note also that mtDNA is only a marker for maternal introgression and more extensive male-mediated input may have occurred.
Table 1 shows variable positions of aligned sequence haplotypes recovered from ancient samples. The dominant feature among ancient haplotypes is the numerical and topological predominance of the European modal sequence T3. Thirty samples show identity over at least the most variable 240 bp of the control region, four samples exhibit 1 bp difference and four samples two or more mismatches. T3, and its one or two base pair derivatives, has predominated in every modern European regional group studied thus far (Cymbron et al. 1999; Troy et al. 2001). Thus, this most basic element in the pattern of European bovine mtDNA diversity is one with a time depth stretching back at least to the Neolithic and cannot be ascribed to more recent aspects of breed or population history.
Table 1.
The variable positions in control region sequences of archaeological B. taurus samples aligned to the European consensus haplotype (T3). (Differences are indicated with a period denoting identity and only variable sites are shown. Haplotype codes are given in the first column (see table S3 of the electronic supplementary material for a detailed examination) and the number of Neolithic and Bronze Age samples described by each haplotype noted. The sequence positions from the BOVMT GenBank sequence are given above each column (NC_001567). Each haplotype has been assigned to be either P (aurochs), T or T3 by means of its relative position in the median network.)
 |
Whereas individual haplotypes may be shared between multiple populations and show limited geographical restriction, the affinities between regional samples may be illustrated by treating these as populations. Here, we calculated genetic distances (pairwise FST) among 10 B. taurus population groupings from European regions, Africa, the Near and Far East, plus the two ancient European sample groups. These were graphed in two dimensions using multidimensional scaling (figure 2). The Neolithic sequence sample, which comprises primarily northern European finds (30 samples with complete sequence over all 240 bp), is placed adjacent with modern British, mainland European and Scandinavian samples, suggesting regional continuity of mtDNA phylogeography within the continent. The positioning of the Bronze Age sample is insecure due to small sample size (5).
Figure 2.

A two-dimensional MDS plot, drawn using data from a 189 bp region of the control region, summarizing genetic distances among nine extant populations and the two ancient populations. The proportion of the data explaining the first two principal coordinates, the r2-value, is shown.
Figure 1 graphs detailed patterns of diversity within the Neolithic and Bronze Age populations using reduced median networks (Bandelt et al. 1995). Samples from mainland Europe and the Near East are added for reference (Troy et al. 2001). In the Neolithic, as with modern European samples, the great majority of sequences root back to the phylogeny through T3, in a classic starburst pattern (figure 1d). As described previously, this pattern is a subset of that observed in the Near East, the Far East and Africa, where the T3 cluster is one component of a more complex array of at least five, regionally distributed B. taurus mtDNA clusters (Troy et al. 2001; Mannen et al. 2004). Thus, the basic pattern of northern European diversity, with a predominance of the T3 cluster and a minority of T samples, is one with a time depth stretching to the initial establishment of domestic populations on the continent.
It has been argued that the five clusters within modern B. taurus mtDNA each represent a single domesticated sequence type, with derived haplotypes displaying mutations accumulated since domestication. The networks around these are starlike, suggesting that they are the products of population expansion, which is supported by significantly negative Tajima's (1996) D and Fu's (1996) Fs values (table 2); samples grouped by population display similar values (not shown). A reasonable hypothesis is that the population expansions recorded were induced by domestication. This would predict that the time to the common ancestor within each cluster should be of the order of 10 000 years. This may be calculated using the statistic ρ, the mean number of mutations from the central founder sequence to lineages within each cluster. This gives an unbiased estimate, and a central 95% credible interval may be calculated assuming a true starlike phylogeny and a Poisson distribution for the mutational process (Richards et al. 2000). Calibration of the control region mutation rate is difficult, but has previously been given as 38% per million years (Myr) for this region using a comparison with bison sequence (Troy et al. 2001). This accords well with a recent calibration of bison control region evolution (685 bp fragment, 32% Myr−1, 95% CI of 23–41%), which used a more informed Bayesian phylogenetic analysis of an extensive radiocarbon-dated dataset (Shapiro et al. 2004).
Table 2.
Expansion dates for the predominant B. taurus haplogroups. (*p-value≤0.02. 38% Myr−1=10964.91 years per transition; 32% Myr−1=13020.83 years per transition.)
| mtDNA haplogroup | number of mutation steps from central haplotype | total number of samples in haplogroupa | ρ value (average mutational distance from central haplotype) | 95% confidence interval range for rho value | time-depth estimate (38% Myr−1/32% Myr−1)b | Tajima's D | Fu's Fs |
|---|---|---|---|---|---|---|---|
| T | 50 | 36 | 1.39 | 1.0309–1.7995 | 15 229/18 084 | −2.00* | −19.99* |
| T1 | 289 | 271 | 1.07 | 0.9470–1.1928 | 11 693/13 886 | −2.23* | −27.08* |
| T2 | 52 | 43 | 1.21 | 0.9032–1.5594 | 13 260/15 746 | −1.94* | −22.46* |
| T3 | 352 | 352 | 1.00 | 0.8982–1.1071 | 10 965/13 021 | −2.30* | −26.99* |
| T4 | 26 | 32 | 0.81 | 0.5308–1.1533 | 8909/10 579 | −2.21* | −16.13* |
| Neolithic (T3) | 5 | 27 | 0.19 | 0.0601–0.3793 | 2031/2411 | −2.00* | −1.98* |
| Bronze Age (T3) | 1 | 4 | 0.25 | 0.0000–0.7489 | 2741/3255 | −0.61 | −4.46* |
Using 240 bp of sequence for comparison, hence reduced total number of samples.
Mutation rate estimate taken from Troy et al. (2001) and Shapiro et al. (2004), respectively.
The best-sampled modern clusters are the African T1 (271 chromosomes) and T3 (352 chromosomes). These yield time of most recent common ancestor (TMRCA) approximate estimates of 13 900 years before present (ybp) and 13 000 ybp (Shapiro et al. 2004, calibration) or 11 700 and 10 950 ybp (Troy et al. 2001, calibration), respectively (table 2); all of which are consistent (including error) with a domestication origin for the founder haplotypes. Examination of the diversity around the Neolithic sample supports this, with a markedly reduced T3 ρ value, indicating a time depth of roughly 2200 years. Given that these chromosomes were, in effect, sampled around 6000 years ago, this low value accords (within reasonable error) with a domestication event origin for T3 diversity. This perusal of 6000 years of missing mutational history allows a confirmation that the bulk of bovine mtDNA diversity today derives from only a few Neolithic founder chromosomes.
Acknowledgments
We thank Jill Bailey, Barbara Bramanti, Detlef Gronenborn, Vincent Macaulay and Christian Pitra for helpful discussions and scientific advice, and Petra Czerwinski and Sabine Möller-Rieker for assistance. We are also especially grateful to the following for provision of archaeological material: R.-M. Arbogast, B. Arndt, L. Bartosiewicz, M. Budja, A. Choyke, K. Dobney, H.-J. Döhle, H. Göldner, H. Hongo, N. Monaghan, B. Öksüz, M. Özdogan, G. Roth, S. Schade-Lindig, E. Stephan, A. Tresset, H.-P. Uerpmann, J.-D. Vigne and I. Vörös. The project in Mainz was funded by the Bundesministerium für Bildung und Forschung (03BUX1MZ). C.J.E. is supported by Irish Research Council for Science Engineering and Technology Basic Research Grant Scheme (project nos. SC/1999/409 and SC/2002/510). Both laboratories were part-funded from a Eurocores OMLL Programme grant via CNRS, France.
Footnotes
These authors contributed equally to this work.
Supplementary Material
References
- Bailey J.F, Richards M.B, Macaulay V.A, Colson I.B, James I.T, Bradley D.G, Hedges R.E.M, Sykes B.C. Ancient DNA suggests a recent expansion of European cattle from a diverse wild progenitor species. Proc. R. Soc. B. 1996;263:1467–1473. doi: 10.1098/rspb.1996.0214. [DOI] [PubMed] [Google Scholar]
- Bandelt H.-J, Forster P, Sykes B.C, Richards M.B. Mitochondrial portraits of human populations using median networks. Genetics. 1995;141:743–753. doi: 10.1093/genetics/141.2.743. [DOI] [PMC free article] [PubMed] [Google Scholar]
- Burger J, et al. Molecular phylogeny of the extinct cave lion Panthera leo spelaea. Mol. Phylogenet. Evol. 2004;30:841–849. doi: 10.1016/j.ympev.2003.07.020. doi:10.1016/j.ympev.2003.07.020 [DOI] [PubMed] [Google Scholar]
- Cymbron T, Loftus R.T, Malheiro M.I, Bradley D.G. Mitochondrial sequence variation suggests an African influence in Portuguese cattle. Proc. R. Soc. B. 1999;266:597–603. doi: 10.1098/rspb.1999.0678. doi:10.1098/rspb.1999.0678 [DOI] [PMC free article] [PubMed] [Google Scholar]
- Edwards C.J, et al. Ancient DNA analysis of 101 cattle remains: limits and prospects. J. Archaeol. Sci. 2004;31:695–710. doi:10.1016/j.jas.2003.11.001 [Google Scholar]
- Forster P, Harding R, Torroni A, Bandelt H.J. Origin and evolution of native American mtDNA variation: a reappraisal. Am. J. Hum. Genet. 1996;59:935–945. [PMC free article] [PubMed] [Google Scholar]
- Fu Y.X. Estimating the age of the common ancestor of a DNA sample using the number of segregating sites. Genetics. 1996;144:829–838. doi: 10.1093/genetics/144.2.829. [DOI] [PMC free article] [PubMed] [Google Scholar]
- Hofreiter M, Jaenicke V, Serre D, von Haeseler A, Pääbo S. DNA sequences from multiple amplifications reveal artefacts induced by cytosine deamination in ancient DNA. Nucleic Acids Res. 2001;29:4793–4799. doi: 10.1093/nar/29.23.4793. doi:10.1093/nar/29.23.4793 [DOI] [PMC free article] [PubMed] [Google Scholar]
- Macaulay V.A. University of Oxford; Oxford, UK: 1998. CRED: credible regions for coalescence times. [Google Scholar]
- Mannen H, et al. Independent mitochondrial origin and historical genetic differentiation in North Eastern Asian cattle. Mol. Phylogenet. Evol. 2004;32:539–544. doi: 10.1016/j.ympev.2004.01.010. doi:10.1016/j.ympev.2004.01.010 [DOI] [PubMed] [Google Scholar]
- Richards M, et al. Tracing European founder lineages in the Near Eastern mtDNA pool. Am. J. Hum. Genet. 2000;67:1251–1276. [PMC free article] [PubMed] [Google Scholar]
- Schneider S, Kueffer J.-M, Roessli D, Excoffier L. Genetics and Biometry Laboratory, University of Geneva; Switzerland: 1997. ARLEQUIN version 2.000, a software for population genetic data analysis. [Google Scholar]
- Shapiro B, et al. Rise and fall of the Beringian steppe bison. Science. 2004;306:1561–1565. doi: 10.1126/science.1101074. doi:10.1126/science.1101074 [DOI] [PubMed] [Google Scholar]
- Slatkin M. A measure of population subdivision based on microsatellite allele frequencies. Genetics. 1995;139:457–462. doi: 10.1093/genetics/139.1.457. [DOI] [PMC free article] [PubMed] [Google Scholar]
- Tajima F. The amount of DNA polymorphism maintained in a finite population when the neutral mutation rate varies among sites. Genetics. 1996;143:1457–1465. doi: 10.1093/genetics/143.3.1457. [DOI] [PMC free article] [PubMed] [Google Scholar]
- Troy C.S, MacHugh D.E, Bailey J.F, Magee D.A, Loftus R.T, Cunningham P, Chamberlain A.T, Sykes B.C, Bradley D.G. Genetic evidence for Near-Eastern origins of European cattle. Nature. 2001;410:1088–1091. doi: 10.1038/35074088. doi:10.1038/35074088 [DOI] [PubMed] [Google Scholar]
Associated Data
This section collects any data citations, data availability statements, or supplementary materials included in this article.