

Abstract
This study identifies novel mechanisms of Hes5 function in developmental myelination. We report here upregulation of myelin gene expression in Hes5−/− mice compared to wild-type siblings and downregulation in overexpressing progenitors. This effect was only partially explained by the ability to regulate the levels of Mash1 and bind to N boxes in myelin promoters, as deletion of the DNA-binding domain of Hes5 did not suppress its inhibitory role on myelin gene expression. Novel mechanisms of Hes5 function in the oligodendrocyte lineage include the regulation of feedback loops with the cell-specific transcriptional activator Sox10. In progenitors with low levels of Sox10, Hes5 further decreases the bioavailability of this protein by transcriptional inhibition and direct sequestration of this activator. Increasing levels of Sox10 in progenitors, in turn, bind to Hes5 and titrate out its inhibitory effect by sequestration and displacement of the repressive complexes from myelin promoters. Thus, Hes5-dependent modulation of myelin gene expression involves old players (i.e. Mash1) and novel mechanisms of transcriptional regulation that include cell-specific regulatory loops with transcriptional activators (i.e. Sox10).
Keywords: development, myelin, Notch, oligodendrocyte, progenitor, transcription
Introduction
The activation of Notch signaling pathway has been critically implicated in modulating cell fate decisions and neuronal differentiation during embryonic development (Ishibashi et al, 1995; Ohtsuka et al, 1999, 2001). A critical downstream effector of Notch signaling is Hes5, a member of the bHLH family of transcription factors (Ohtsuka et al, 1999).
Hes5 (Akazawa et al, 1992; Takebayashi et al, 1995) is part of a family of transcriptional inhibitors that are homologous to the Drosophila genes hairy and Enhancer of split, known to inhibit neural development (Nakao and Campos-Ortega, 1996; Fisher and Caudy, 1998). In mammalian cells, Hes family members (Hes1 and Hes5) have been implicated as critical downstream effectors of the Notch signaling pathway and several studies have focused on the functional role of Hes5 in neurogenesis during embryonic development (Ohtsuka et al, 1999; Cau et al, 2000; Hatakeyama et al, 2004). Like the other members of Hes family, Hes5 has a proline residue in the middle of the basic region and exhibits a higher binding affinity to the N-box (CACNAG) than to the E box (CANNTG) (Akazawa et al, 1992). After binding to the N-box, Hes factors interact with the corepressor TLE/Grg and recruit the histone deacetylase to repress gene expression (Paroush et al, 1994; Grbavec and Stifani, 1996) and this mechanism has been implicated in the regulation of promoter of pro-neural genes (Akazawa et al, 1992). Additional mechanisms of Hes5-dependent inhibition includes the formation of non-functional heterodimers with neurogenic bHLH proteins (Akazawa et al, 1992).
Hes5 is the only member of the Hes family whose expression is progressively downregulated during the differentiation of neonatal oligodendrocyte progenitors (Wang et al, 1998; Kondo and Raff, 2000). Besides its regulation during development, the expression levels of Hes5 are also elevated in demyelinated disorders associated with defective myelin repair (John et al, 2002). Despite its importance in both development and disease states, still relatively little is known about the molecular mechanisms of Hes5 function in the oligodendrocyte lineage and on the regulation of myelin gene products. Using a variety of experimental approaches, ranging from the phenotypic analysis of Hes5−/− mouse mutants to the characterization of myelin gene expression in immortalized oligodendrocyte progenitors overexpressing Hes5, from chromatin immunoprecipitation to the biochemical assessment of protein–protein interaction, this study defines novel and cell-context-specific mechanisms mediating the inhibitory role of Hes5 on gene expression.
Results
Increased myelin gene expression in the developing Hes5−/− mouse
Previous studies in cultured neonatal oligodendrocyte progenitors had reported that the levels of Hes5 were elevated in undifferentiated cells and progressively decreased as progenitors differentiated into oligodendrocytes (Kondo and Raff, 2000). Consistent with these studies, we detected high levels of Hes5 in developing white matter tracts of neonatal mice (Figure 1A) that progressively decreased over time and were followed by the progressive increase of myelin gene expression (Figure 1A). To address the functional significance of these findings, we asked whether myelin gene expression was altered in the brain of Hes5−/− mutant mice compared to Hes5+/+ control siblings. We addressed this question during the first 2 weeks of postnatal development, because this is the time when myelin is formed in the developing brain. The levels of transcripts for the lipid synthetic enzyme ceramide galactosyl transferase (CGT), 2′–3′ cyclic nucleotide 3′phosphodiesterase (CNPase) and of the myelin components proteolipid protein (PLP) and myelin basic protein (MBP) were determined at several time points of postnatal development (i.e. days 1, 5 and 11) using reverse transcription–polymerase chain reaction (RT–PCR). The temporal pattern of myelin gene expression was similar in wild type (wt) and Hes5−/− mice (Figure 1A). However, statistically significant higher levels of CGT, PLP, CNPase and MBP transcripts were detected in Hes5−/− mice at postnatal day 11 compared to wt littermates (Figure 1A). The increased expression of myelin gene products in Hes5 mutants compared to wild-type littermates was further confirmed by quantitative real-time PCR (Figure 1B) and by Western blot analysis (Figure 1C) followed by densitometric quantification (Figure 1D). Immunohistochemical analysis of coronal brain sections stained with antibodies against the major myelin protein components PLP, CNPase and MBP, confirmed greater levels of myelin gene products in postnatal day 11 Hes5−/− mice compared to Hes5+/+ wt littermates, as indicated by the stronger intensity of myelin staining and the more extensive distribution of myelinated tracts (Figure 2). This difference was particularly evident at the level of the anterior corpus callosum, but was detected also in several other myelinated regions, including the striatum and the anterior commissure. The higher levels of myelin proteins detected in Hes5−/− mice could also be attributed to increased number of differentiating oligodendrocytes. Using antibodies specific for the oligodendrocytic marker APC, (identified by the antibody CC1) and against the transcription factor Sox10 (Supplementary Figure 1), we performed double immunohistochemistry on coronal brain sections. Identical brain sections were analyzed and quantified in mice of both genotypes and revealed greater numbers of differentiated oligodendrocytes in postnatal Hes5−/− mice compared to wt siblings (Supplementary Figure 1).
Figure 1.
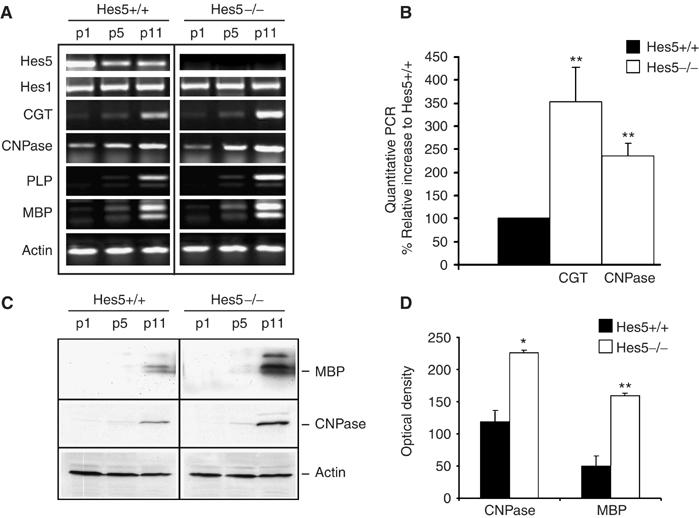
Increased myelin gene expression in the brain of developing Hes5−/− mice. RT–PCR (A) of RNA samples isolated from wt (Hes5+/+) and knockout (Hes5−/−) mice at postnatal day 1 (p1), 5 (p5) and 11 (p11) revealed increased myelin gene expression in mutants compared to wt siblings. Quantitative PCR for CGT and CNPase (B) of total RNA isolated from Hes5+/+ and Hes5−/− mice at p11. The CGT and CNPase transcript levels were normalized to the GAPDH values and expressed as percentage of the values detected in Hes5+/+. The bar graphs represent the average and standard deviation. (**P⩽0.005). Increased myelin protein expression was confirmed by Western blot analysis (C) and quantified by densitometry. The densitometric value of each myelin band was normalized by the actin content for each sample and the average and standard deviation of three independent experiments is shown as bar graph (D). (*P⩽0.05, **P⩽0.005).
Figure 2.
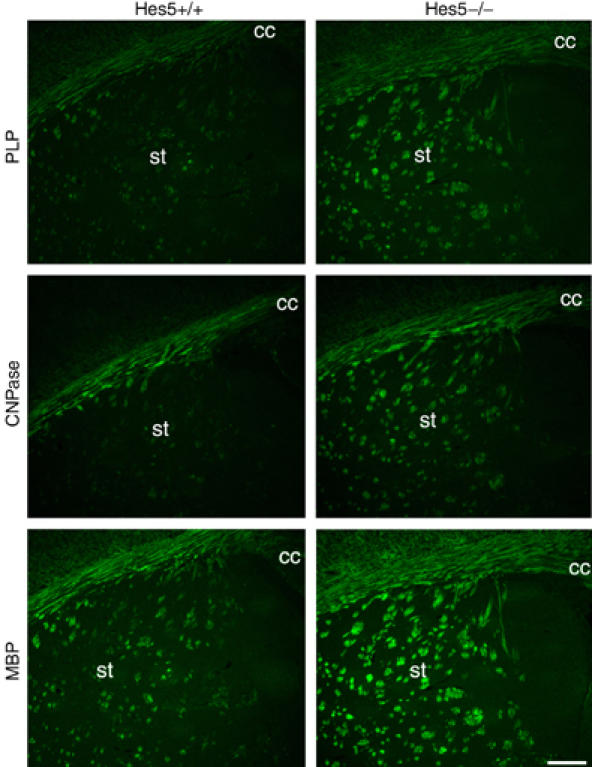
Myelination of the developing corpus callosum is more extensive in the Hes5−/− mutant mice. Immunohistochemistry of coronal cryosections from p11 mice stained with antibodies against PLP, CNPase or MBP showed increased intensity of myelin protein staining in white matter tracts of the striatum (st) and in the anterior corpus callosum (cc) of Hes5−/− mice compared to Hes5+/+ controls (Scale bar=100 μm).
Since the levels of Hes5 progressively decrease as myelination proceeds, we asked whether the phenotype observed during the first postnatal period was compensated over time. To address this question, the RNA and protein levels were determined in adult Hes5−/− mice and compared to wt siblings (Supplementary Figure 2). The results of RT–PCR, Western blot analysis and immunohistochemistry support the concept that the phenotype of Hes5−/− mice is transient and limited to the postnatal window of development. Together, these results are consistent with the previously described role for Hes5 as differentiation inhibitor and suggest that the increased levels of myelin proteins detected in Hes5−/− mice are the consequence of both, increased number of differentiated cells and increased myelin gene expression per cell.
Hes5 is recruited to myelin gene promoters in the chromatin of undifferentiated oligodendrocyte progenitors, but its inhibitory role can only partially be attributed to direct binding
To address whether the Hes5-dependent repression of myelin gene expression occurs at the transcriptional level, we adopted an overexpression approach in murine oligodendrocyte progenitors immortalized by neu (Jung et al, 1995). These cells, called Oli-neu, retain all the immunophenotypic and functional characteristics of primary progenitors including the ability, even after several passages, to differentiate into mature oligodendrocytes and express myelin genes (Gokhan et al, 2005). Similar to what reported for primary cultures of oligodendrocyte progenitors isolated from the neonatal optic nerve (Kondo and Raff, 2000), the expression of Hes5 in these cells was inversely correlated with the levels of myelin gene expression. Hes5 levels were elevated in undifferentiated progenitors and progressively decreased as the cells differentiated and started to express myelin genes (Supplementary Figure 3). Immortalized murine progenitors were transfected with either pcDNA, flag-tagged Hes1 (rat sequence) or myc-tagged Hes5 (rat sequence) in mitogen-containing medium and the effect on myelin gene expression was tested after 3 days in differentiation medium. The RNA was isolated and amplified using primers specific for rat Hes1 and rat Hes5 to verify overexpression, for CGT, CNPase and MBP to detect the effect of Hes1 and Hes5 on myelin genes and primers specific for YY1 and Id2, to address the effect of Hes family members on non myelin genes (Figure 3A). In the described experimental conditions, pcDNA-transfected cultures were characterized by moderate levels of Hes1, lack of Hes5 expression and high levels of myelin and nonmyelin genes. In contrast, Hes5-transfected cells showed 40% lower levels of myelin transcripts than pCDNA controls (Figure 3A). This effect was specific because Hes5 overexpression did not affect the expression of nonrelated genes (i.e. YY1 or Id2) and because overexpression of the related family member Hes1 had no effect on myelin gene expression. The repressive effect of Hes5 on myelin genes was further validated in cotransfection experiments with either Hes5 or pcDNA, together with a luciferase reporter gene driven by the myelin gene promoter for CGT or MBP (Figure 3B). Consistent with the repressive effect of Hes5 on endogenous myelin gene expression, the activity of CGT and MBP promoters was consistently lower in Hes5-transfected cells than in pcDNA-transfected controls (Figure 3B). Together these data indicated that Hes5 acts as a transcriptional repressor on myelin gene promoters, but did not reveal the mechanism behind this effect. As the MBP promoter sequence contains several consensus sequences for N boxes (Figure 3C), we reasoned that Hes5 could directly inhibit myelin gene expression by direct occupation of these promoter regions. To directly test this possibility in vivo, we used chromatin immunoprecipitation. Briefly, chromatin was isolated from myc-tag Hes5-transfected progenitors or untransfected controls and immunoprecipitated with antibodies against myc-tag, owing to lack of antibodies that specifically and reliably recognize the endogenous Hes5 (Figure 3D). Upon immunoprecipitation, the proteins were digested and the remaining DNA was amplified using several primer pairs, including those specific for the regions of the MBP promoter containing N box consensus sequences (nt 107–206 and 676–819) and those amplifying regions of the promoter close to the start site and devoid of N boxes (nt 1026–1191). Immunoprecipitation of the untransfected cultures with myc-tag antibody was used as negative control (Figure 3D). Using this approach, we detected the presence of repressive complexes containing Hes5 and HDAC1 in the regions of the MBP promoter containing N boxes, and only a very weak recruitment to the proximal region of the promoter that does not contain N boxes (Figure 3D). Incidentally, we noticed that the recruitment of HDAC1 to the proximal promoter did not match the presence of Hes5 in this region and suggested the possible recruitment of HDAC1 due to binding with other repressors. These results suggested that Hes5 binds to regions of the MBP promoter containing N boxes and forms repressive complexes containing HDAC1.
Figure 3.

Hes5 regulates myelin gene expression and directly binds to myelin gene promoters. Semiquantitative RT–PCR (A) analysis of RNA samples isolated from Oli-neu cells transfected with pcDNA3 (control), myc tag Hes5 or Hes1 plasmids and maintained for 3 days in differentiation conditions. Note that the endogenous murine Hes5 was not efficiently amplified in control and Hes1-transfected cultures because the primers used for the amplification were specific for the transfected rat Hes5 sequence. Cultures overexpressing Hes5 had significantly lower levels of myelin transcripts (CGT, CNP and MBP) than pcDNA or Hes1 transfected cultures. This result was specific as the expression levels of nonmyelin genes (Id2, YY1, actin) was not affected by Hes5 levels (A). Cotransfection of Hes5 (black bars) with luciferase reporter constructs (CGT and MBP driven luciferase) confirmed the repressive ability of Hes5 on exogenously transfected myelin gene promoters (B). The bar graphs indicate luciferase activity measured in Hes5 (black bars) or pcDNA (white bars) transfected cultures after 3 days in differentiation conditions (***P⩽0.0005). Schematic diagram of the MBP promoter (C) based on the murine sequence (gb_M24410). The predicted N box, E box and Sox10 consensus sequences are shown. The black arrows indicate the primers used for the chromatin immunoprecipitation (ChIP) experiment. (D) ChIP of untransfected (control) and myc-Hes5 transfected progenitors was performed using antibodies against myc-tag (Ab myc-Hes5) or against HDAC1 (AbHDAC1). The region of the promoter associated with myc-tagged Hes5 or HDAC1 was amplified using the primers indicated in (C). The detection of a band indicated the presence of complexes containing Hes5 or HDAC1 in the corresponding region of the MBP promoter in undifferentiated progenitors. Negative controls (no DNA control) and loading controls (input DNA) are shown. Note that the use of myc-tag antibodies was necessary because of the lack of antibodies against the endogenous Hes5 that were suitable for ChIP studies.
To test the functional relevance of Hes5 direct binding to the promoter, we deleted the first 28 amino-terminal amino acids of the molecule, containing the DNA-binding region (truncated form of Hes5 (tHes5)) (Figure 4A), and assessed the ability of tHes5 to bind to DNA. For this purpose, we used electrophoretic mobility assay using an oligonucleotide probe corresponding to nt 740–763 of the MBP promoter, containing the N box consensus sequence, and the 293T line lacking endogenous Hes5 expression (Espinosa et al, 2003). The choice of this cell line allowed us to avoid potential complications involving the heterodimerization of truncated Hes5 with the endogenous protein. Nuclear extracts from myc-tag Hes5-transfected 293T cells clearly showed a dose-dependent binding to the oligonucleotide probe, whereas extracts from tHes5-transfected cells failed to reveal binding to the same probe (Figure 4B). To determine whether the mutant tHes5 lost the ability to inhibit the activity of myelin gene promoters, we assessed the effect of overexpressing tHes5 together with CGT and MBP promoters driving luciferase reporter genes (Figure 4C). Remarkably, the tHes5, although unable to bind to DNA, still retained the ability to inhibit myelin promoters in Oli-neu cells (Figure 4C), thus suggesting that Hes5-mediated regulation of myelin gene expression is only partially dependent on its ability to directly bind to DNA.
Figure 4.
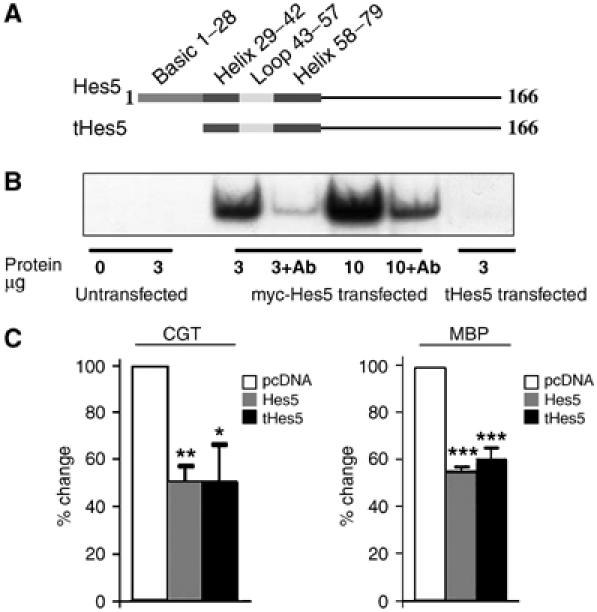
Deletion of the DNA-binding domain does not abolish the repressive activity of Hes5 on myelin gene promoters. (A) Schematic diagram of Hes5 protein indicating the amino-acid sequence, including the DNA-binding domain that was deleted in tHes5. (B) The ability of full-length and tHes5 to bind DNA was assayed by electrophoretic mobility shift assay in 293T cells transfected with myc-tagged Hes5 or tHes5, using a radioactive probe corresponding to the region 740–763 of the MBP promoter. Note that the binding activity was observed only in transfected cells. The identity of the band was confirmed by competition with anti-Myc tag antibodies, as the commercially available antibodies against the endogenous Hes5 could not be reliably used owing to lack of specificity. (C) Co-transfection of either full-length Hes5 (gray bars), tHes5 (black bars) or pcDNA (white bars) with luciferase reporter constructs driven by the myelin promoters CGT or MBP confirmed that tHes5 retained the ability to inhibit exogenously transfected myelin promoters. Statistical significance was assessed using Student's t-test (*P⩽0.05, **P⩽0.005, ***P⩽0.0005).
Hes5 regulates the levels of transcriptional activators of myelin genes
Because myelin gene expression is the result of a balance between positive and negative transcription factors (Wegner, 2001), and because Hes5 is known to affect the expression of the basic HLH transcription factor Mash1, we asked whether the inhibitory effect of Hes5 on myelin gene expression could be indirectly mediated by an effect on the expression levels of transcriptional activators of myelin genes. To explore this possibility, we compared the expression pattern of several well-characterized oligodendrocyte-specific transcription factors, known to affect myelin gene expression, in RNA samples extracted from the brain of Hes5−/− mice and wt controls (Figure 5A). Our data revealed no difference in the expression levels of the oligodendrocyte-specific basic helix-loop-helix (bHLH) proteins Olig1 and Olig2 or in the levels of the inhibitory HLH molecules Id1, 2, 3 and 4. The levels of other known modulators of myelin gene expression such as Nkx2.2 and YY1 were also similar in wt and mutant mice. Of all the tested molecules, only Mash 1 and Sox10 levels were higher in Hes5−/− mice compared to wt controls, as determined also by quantitative real-time PCR (Figure 5B). To define whether increased Sox10 levels reflected not only the increased number of differentiating oligodendrocytes, but also the increased expression of Sox10 per cell, we performed immunohistochemistry on coronal brain sections and analyzed the results by confocal microscopy (Figure 5C). It was evident that the levels of Sox10 intensity in individual cells in of Hes5−/− mice were higher than those detected in wt siblings and therefore supported the results of the RT–PCR (Figure 5C). To further confirm that Hes5 regulated the expression levels of Mash1 and Sox10, we overexpressed Hes5 or the control plasmid pcDNA in immortalized oligodendrocyte progenitors and assayed the endogenous levels of several transcription factors in samples harvested from the two groups of cultures (Figure 5D). Consistent with a role for Hes5 in modulating the transcriptional levels of Sox10 and Mash1, in three separate experiments we observed lower levels of Sox10 and Mash1 in Hes5-transfected cultures compared to pcDNA controls. This effect was specific, as the levels of several other transcription factors, including Olig1, Olig2 or Id family members did not differ between the two groups (Figure 5D). The repressive effect of Hes5 on Mash1 and Sox10 expression was dependent on its ability to bind to DNA, because overexpression of tHes5 did not affect the levels of these two activators (Figure 5E), even though it still inhibited myelin promoter activity (Figure 4C). Thus additional mechanisms, independent of the transcriptional regulation of Mash1 and Sox10, must account for the ability of tHes5 to repress myelin gene expression. Because Hes5 has the ability to bind to other members of the bHLH class of transcription factors, we asked whether a possible mechanism of tHes5-dependent inhibition was through binding to Mash1 and recruitment to E boxes. Chromatin immunoprecipitation with myc-tag antibodies of cells transfected with myc-tag tHes5, revealed the presence of tHes5 in regions of the MBP promoter containing E boxes (Figure 6A). Immunoprecipitation of protein lysates from these cells further revealed the ability of full-length Hes5 to bind to Mash 1. We excluded the possibility that co-immunoprecipitation was due to nonspecific binding of both proteins to contaminating DNA, because the two proteins were co-immunoprecipitated also when the experiments were performed in the presence of DNase I (Figure 6B). Using a similar protocol, we observed that also the tHes5 had the ability to bind to Mash1 (Figure 6C).
Figure 5.
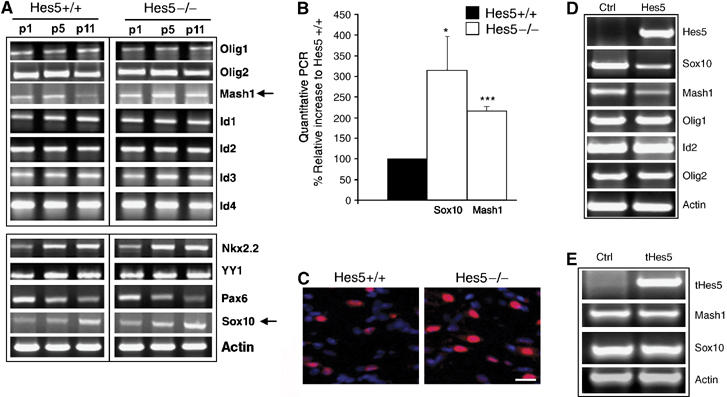
Hes5 regulates the expression of Mash1 and Sox10. RT–PCR of RNA isolated from Hes5−/−mice during the first 11 days of postnatal development revealed higher levels of Mash1 and Sox10 (arrows) compared to Hes5+/+ siblings (A). The increased levels of Mash1 and Sox10 transcripts were confirmed by quantitative PCR. The levels were normalized to GAPDH and expressed as percentage of the values detected in Hes5+/+ (B). The bar graphs represent the average and standard deviation (*P⩽0.05, ***P⩽0.0005). Immunohistochemistry confirmed the higher level of Sox10 expression in the corpus callosum of p11 Hes5−/− mice (scale bar=25 μm) (C). RT–PCR of samples isolated from transfected progenitors supported the inhibitory effect of Hes5 levels on Sox10 and Mash1 expression (D). Note that the levels of other transcription factors (i.e. Olig1, Olig2, Id2) was similar in Hes5 and pcDNA-transected controls (D). The deletion of the DNA-binding domain of Hes5 (tHes5) abolished the ability of this molecule to inhibit Sox10 and Mash1 (E).
Figure 6.

Hes5 interacts with Mash1. ChIP of untransfected (untra) and myc-tagged truncated Hes5 (tHes5) transfected progenitors performed using antibodies against myc-tag (A). The immunoprecipitated products were amplified with primers specific for the regions containing N-boxes and E-boxes in the mouse MBP promoter. Bands detected in the myc-tHes5 transfected progenitors indicated the recruitment of tHes5 to the regions of the MBP promoter, containing E boxes. Whole-cell lysates (wcl) from oligodendrocyte progenitor cultures transfected with myc-tag Hes5 with or without Mash1 were used for co-immunoprecipitation studies, using antibodies against myc-tag (B). The identity of the interacting proteins was defined by Western blot analysis, using antibodies specific for Mash1, or for myc-tagged Hes5. To avoid possible contamination from DNA, the experiments were performed in the presence of DNaseI (B). To assess whether tHes5 retained the ability to bind to Mash1, the experiments were repeated in cultures transfected with myc-tHes5 with or without Mash1 and yielded similar results (C).
In the case of Sox10, however, it was not likely that Hes5 could be recruited by this molecule as part of a repressive complex, because Hes5 was barely recruited to the proximal region of the promoter containing Sox10 regulatory sites (Figure 3D). An alternative possibility was to hypothesize the existence of a mechanism of repression owing to Hes5-dependent sequestration of Sox10. This model implied the ability of Hes5 to directly bind Sox10 and possibly the titration of the inhibitory effect of Hes5 by increasing concentrations of Sox10. In agreement with this prediction, co-immunoprecipitation studies revealed that both full-length Hes5 (Figure 7A) and tHes5 (Figure 7B) had the ability to directly bind to Sox10. To further define the functional consequences of this complex formation on myelin gene expression, we transfected Oli-neu cells with constant amounts of Hes5 DNA (i.e. 0.5 μg) and progressively increasing amounts of Sox10 DNA (i.e. 0.5, 1.0 and 1.5 μg) and tested the effects on the activity of luciferase reporters driven by myelin promoters (Figure 7C). In agreement with the predicted ‘sequestration' model, Hes5 was able to repress myelin promoter activity in cultures transfected with lower amounts of Sox10 DNA, but not in cultures transfected with the higher amounts (Figure 7C). To exclude the possibility that this functional effect was due to decreased Hes5 protein levels in cultures transfected with high amounts of Sox10 DNA, we performed Western blot analysis (Figure 7D). Consistent with the protein-sequestration model, the results of the Western blot analysis correlated with the amounts of transfected DNA. The protein levels of Hes5 were constant whereas the protein levels of Sox10 were higher in the cells transfected with higher amounts of plasmids (Figure 7D).
Figure 7.
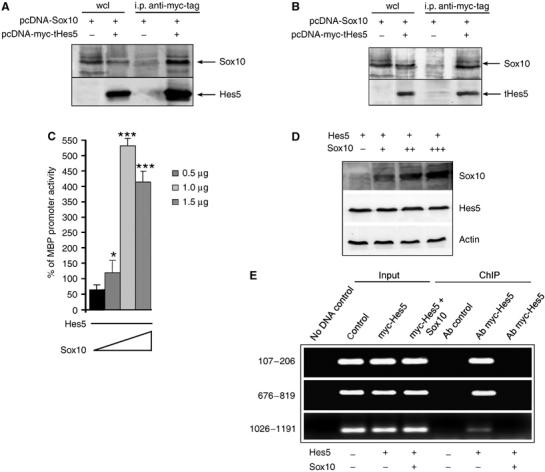
Functional interaction between Hes5 and Sox10 in the regulation of the MBP promoter. (A) Whole-cell lysates (wcl) from oligodendrocyte progenitors transfected with myc-tag Hes5 with or without Sox10 were used for co-immunoprecipitation studies, using antibodies against myc-tag for immunoprecipitation. The identity of the interacting proteins was defined by Western blot analysis, using antibodies specific for Sox10 or for myc-tagged Hes5. (B) Also, tHes5 retained the ability to bind to Sox10 as demonstrated by immunoprecipitation. (C) Luciferase reporter assay of cells cotransfected with MBP promoter driving reporter together with constant amounts of myc-tagged Hes5 plasmid (0.5 μg) and increasing amounts of Sox10 DNA (0.5, 1 and 1.5 μg) indicated that the inhibitory effect of Hes5 on the MBP promoter could be reversed by increasing concentrations of Sox10 (*P⩽0.05, ***P⩽0.0005). (D) To confirm that increasing amounts of transfected Sox10 DNA corresponded to increased protein levels, we performed a Western blot analysis of protein extracts from cultures transfected with 0.5 μg of myc-tagged Hes5 plasmid together with 0.5 μg (+), 1 μg (++) and 1.5 μg (+++) of Sox10 plasmid. (E) ChIP was performed on samples isolated from untransfected (control), Hes5 transfected or Hes5 and Sox10 cotransfected progenitors, using antibodies against myc-tag. The immunoprecipitated products were amplified using the indicated primers. Note that in the absence of Sox10, Hes5 was recruited to the regions of the MBP promoter containing N- and E-boxes. However, in the presence of high levels of Sox10, Hes5 was displaced from the promoter.
These data imply a novel and previously unexplored function for Sox10 in activating myelin gene expression by competition with the formation of repressive complexes containing Hes5. Thus, chromatin immunoprecipitation was performed on cells expressing Hes5 alone or Hes5 and excess Sox10 (Figure 7E). In agreement with the proposed model, the increased levels of Sox10 bind progressively to Hes5 thereby displacing it from the occupation of the promoter (Figure 7E).
In summary, using Hes5 null mice and in vitro overexpression, we have defined the molecular mechanisms underlying the inhibitory role of Hes5 in myelin gene expression. Together, the data presented in this study define not only the occurrence of Hes5-dependent mechanisms and partners similar to those described in neurogenesis but also reveal the existence of novel mechanisms of transcriptional de-repression owing to sequestration of Hes5 by new players (i.e. Sox10).
Discussion
Our results provide direct evidence that the mechanism of Hes5-dependent regulation of gene expression is dependent on the developmental stage and cellular context and therefore extend our understanding on the mechanism of action of this important transcription factor. In mammalian cells, Hes family members (Hes1, Hes3 and Hes5) have been implicated as modulators of neural (Ohtsuka et al, 1999; Cau et al, 2000; Hatakeyama et al, 2004) and astrocytic (Wu et al, 2003) differentiation during embryonic development. A previous study in embryonic neuroepithelial cells isolated from the murine spinal cord, suggested that Hes5 expression was transient and confined to precursors or very early progenitors and thereby questioned its possible role as direct regulator of myelin gene expression (Wu et al, 2003). Our results in immortalized murine cortical neonatal progenitors are in agreement with several other studies reporting the expression of Hes5 in the postnatal brain (Stump et al, 2002) and in neonatal oligodendrocyte progenitors isolated from the optic nerve (Kondo and Raff, 2000) and revealed high levels of Hes5 in undifferentiated progenitors and the progressive decline during oligodendrocyte differentiation, concomitant with the gradual increase of myelin gene expression. A similar pattern was observed in vivo, in developing white matter tracts, where the decline of Hes5 levels was coincident with the activation of myelin gene expression. As the synthesis of myelin by oligodendrocyte is the predominant event in the postnatal brain, we attributed the discrepancy between our results and the previous report in embryonic cells (Wu et al, 2003), to the developmental stage and region of the central nervous system that was analyzed.
Given the relevance of the Notch-Hes5 pathway in inhibiting oligodendrocyte differentiation (Wang et al, 1998; Kondo and Raff, 2000), the inverse correlation of Hes5 and myelin gene expression observed in vitro and in vivo, and the postulated importance of Hes5 levels in remyelination failure (John et al, 2002), in this paper we sought to define the molecular mechanisms responsible for Hes5-dependent regulation of myelin gene expression in the postnatal brain.
In agreement with a role for Hes5 as transcriptional inhibitor of myelin gene expression, the phenotypic characterization of Hes5−/− mice revealed consistently higher levels of myelin gene products in neonatal Hes5−/− mice compared to wt siblings. The effect of Hes5 loss on myelin gene expression was not associated with any overt behavioral abnormality and thereby differed from the severe neurological phenotype observed in mice with altered expression levels of a single myelin gene (Kagawa et al, 1994; Readhead et al, 1994; Inoue et al, 1996). The fact that Hes5−/− mice appeared normal despite the increased myelin gene expression was probably related to the global effect that the loss of this inhibitory molecule had on both the oligodendrocyte number and on several myelin genes. The role of Hes5 as global inhibitor of myelin gene expression was substantiated by the reduced levels of endogenous myelin genes and the reduced activity of exogenous myelin gene promoters in oligodendrocyte progenitors overexpressing this molecule. The inhibition of myelin gene expression was only partially because of mechanisms of repression similar to the ones described in embryonic neural precursors. In progenitor cells, Hes5 bound to the N-boxes of myelin gene promoters in vivo, and recruited repressive complexes containing histone deacetylases. However, this mechanism did not significantly contribute to inhibition of myelin gene expression, as a mutant form of Hes5, lacking the DNA-binding domain (tHes5), was still able to repress myelin gene expression. Together, these data supported the interpretation that direct binding of Hes5 to N-boxes was not the major mechanism of regulation of myelin gene expression.
An alternative possibility was that Hes5 interfered with the combinatorial transcriptional code responsible for the activation of myelin gene expression, by affecting the expression of other transcription factors (Gokhan et al, 2005). Members of the bHLH family of transcription factors (i.e. Olig1, Olig2, Id2, Id4, E12, E47 and Mash1), homeodomain (Nkx2.2) and high-mobility-group protein (i.e. Sox10) have all been shown to play critical roles in regulating myelin gene promoters (Stolt et al, 2002; Parras et al, 2004; Samanta and Kessler, 2004; Wei et al, 2004; Gokhan et al, 2005; Marin-Husstege et al, 2006). Of all these factors, the levels of Hes5 selectively modulated the expression of Sox10 and Mash1, as only the expression of these transcription factors was upregulated in the brain of Hes5−/− mice and downregulated in progenitors overexpressing Hes5. These results were in agreement with previous reports (Kondo and Raff, 2000) and suggested that Hes5 regulation of myelin gene expression was dependent on its ability to modulate the levels of specific activators. However, the fact that tHes5 was still effective in inhibiting the activity of myelin promoters, despite its inability to affect the levels of Sox10 or Mash1, suggested the existence of additional mechanisms of regulation. Another possibility was that tHes5 retained the ability to indirectly recruit repressive complexes to the myelin promoters, by binding with Mash1, as suggested by the chromatin immunoprecipitation results and by the detection of tHes5/Mash1 protein complexes. Alternatively, Hes5 could sequester transcriptional activators into nonfunctional protein complexes. Co-immunoprecipitation studies in oligodendrocyte progenitors revealed that Hes5 or tHes5 were both able to bind to Sox10, thereby competing for the bioavailability of this critical activator of myelin gene expression and disrupting the equilibrium of the transcriptional combinatorial code. These findings predicted that the phenotype of Hes5−/− mice should be compensated at later developmental stages, when the progressive increase of the levels of transcriptional activators renders myelin gene expression less responsive to the function of the inhibitors.
Thus, we propose a model of myelin gene regulation that is dependent on the developmental stage of the cell. In undifferentiated progenitors, myelin gene expression is inhibited because of the lack of specific activators (Wegner, 2000) and because of the presence of inhibitors with the ability to recruit repressive complexes. In this respect, we and others have shown that Sox10 (Stolt et al, 2002; Wei et al, 2004) and combinatorial codes of bHLH proteins, containing Mash1 and E47 (Gokhan et al, 2005), have the ability to induce myelin gene expression. However, in undifferentiated oligodendrocyte progenitors, the myelin gene promoters are inhibited, owing to the presence of transcriptional inhibitors, including Id family members (Samanta and Kessler, 2004; Marin-Husstege et al, 2006) and homeobox molecules, such as Nkx2.2 (Wei et al, 2005). Although Id family members have been shown to affect transcription by forming inactive transcriptional complexes with activating bHLH, Nkx2.2 has been shown to bind to Sin3a and proposed to recruit repressive complexes containing HDAC1 to the proximal region of the MBP promoter (Wei et al, 2005). It was also proposed that the repressive function of Nkx2.2 was competed by the presence of Sox10 (Wei et al, 2005). Our chromatin immunoprecipitation data indicate that the recruitment of HDAC1 to the proximal region of the MBP promoter is independent of Hes5, and competed by Sox10 thus providing indirect support to the previous studies. In contrast, the mechanism of regulation of myelin gene expression by Hes5 encompasses a wide variety of mechanisms including: recruitment of repressive complexes to the promoter region, transcriptional inhibition of Sox10 and Mash1, and sequestration of Sox10 into functionally inactive complexes. This multitude of repressive mechanisms renders Hes5 a very powerful inhibitor of myelin gene expression and therefore a critical potential therapeutic target for remyelination strategies.
Materials and methods
Antibodies
Antibodies against actin and CNPase were from Sigma, anti-Sox10 was a gift from Dr Wegner (U Erlangen-Nürnberg, Germany). Commercially available anti-Sox10 antibodies were purchased from Chemicon, anti-MBP from Sternberg Monoclonals Incorporated and anti-Myc Tag from Upstate. Secondary antibodies for Western blots were obtained from Amersham Biosciences. Secondary antibodies conjugated to Fluorescein or Texas Red were obtained from Southern Biotechnologies, Amersham Biosciences Jackson ImmunoResearch and Vector Laboratories.
Animals. Hes5−/− mice were previously generated in a mixed 129Sv × ICR genetic background (Ohtsuka et al, 1999) and bred as heterozygote pairs. They were maintained and handled according to protocols approved by the Institutional IACUC committee.
Cell culture, transfections and luciferase assays
Oligodendrocyte progenitors immortalized with the neu antigen (Jung et al, 1995) were a gift from Dr Trotter (University of Mainz, Germany). Cells were grown on poly-L-lysine or poly-ornithine-coated culture dishes and maintained proliferating in growth medium (Dulbecco's modified Eagle's medium (DMEM) supplemented with 2 mM L-glutamine, 1 mM sodium pyruvate, 10 ng/ml biotin, 100 μg/ml apotransferrin, 100 μM putrescine, 20 nM progesterone, 30 nM sodium selenite, 5 μg/ml insulin, 1% horse serum, 100 U/ml penicillin and 100 μg/ml streptomycin). Differentiation was induced by switching the cells to medium with 1 mM dibutyril-cAMP (Sigma), as described (Jung et al, 1995). For luciferase assays, proliferating progenitors were transfected with Myc-tagged rat Hes5 (Ohtsuka et al, 2001), Flag-tagged rat Hes1 (McLarren et al, 2000) provided by Dr Stifani (McGill University, Canada) or pcDNA empty vector, using FuGENE 6 (Roche) according to the manufacturer's manual. The 1.3 kb MBP promoter upstream of the luciferase coding in pGL3Basic was a gift from Dr Miskimin (University of South Dakota, Vermillion) (Miskimins et al, 2002). The CGT gene promoter, corresponding to the region −5800 to +49 (Yonemasu et al, 1998) was provided by Dr Nakahira (National Research Institute, Okazaki, Japan). For the transfection studies, cells were transfected in growth medium and differentiated by removal of mitogens and inclusion of cAMP in the medium (DMEM, 100 μg/ml albumin, 100 μg/ml apo-transferrin, 16 μg/ml putrescine, 0.06 ng/ml progesterone, 40 ng/ml selenium, 5 μg/ml insulin, 1 mM sodium pyruvate, 2 mM L-glutamine, 100 U/ml penicillin, 100 μg/ml streptomycin plus 1 mM dybutiril cAMP). Three days later, cells were harvested and assayed for luciferase activity using the Steady-Glo™ luciferase assay kit (Promega,). Luciferase activity was measured in a Packard Top Count NXT microplate luminometer.
Protein extraction, co-immunoprecipitation and Western blot analysis
Proteins from the brain were extracted using a buffer containing 50 mM Tris, pH 7.4, 250 mM NaCl, 1% sodium dodecyl sulfate (SDS), 1 mM dithiothreitol (DTT), 1 mM ethylene diaminetetra acetic acid (EDTA), 0.01% phenylmethylsulfonyl fluoride (PMSF), 1 mM aprotinin and 1 mM leupeptin for 15 min on ice. Whole-cell extracts were prepared in cell lysis buffer (50 mM Tris–HCl, pH 7.4 containing 1 mM KCl, 1 mM MgCl2, 1 mM EDTA, 1 mM DTT, 150 mM NaCl, 10% glycerol, 0.5% NP-40, and proteinase inhibitors) for 15 min on ice. Cell lysates were further disrupted by sonication on ice at the highest output (three times, 20 s each, cells were kept on ice for 1 min between each pulse). For co-immunoprecipitation studies, 500 μg of proteins were incubated for overnight at 4°C in 400 μl of IP buffer (50 mM Tris–HCl, pH 7.4 containing 1 mM KCl, 1 mM MgCl2, 1 mM EDTA, 1 mM DTT, 10% glycerol and proteinase inhibitors) with mouse monoclonal anti-myc antibodies (clone 4A6, Upstate) directly coupled to 30 μl of sucrose beads. After centrifugation, the beads were washed 3 times with IP buffer. To avoid the possible contamination with DNA and proteins sticking to it, in some experiments the beads were treated with 50 U DNase I in 100 mM Tris buffer (pH 7.5, plus 25 mM MgCl2 and 5 mM CaCl2) at room temperature for 15 min. After several washes, the immunoprecipitated proteins were eluted using 30 μl 2 × Laemmli sample buffer. Proteins were separated on a 15% sodium dodecyl sulfate–polyacrylamide gel electrophoresis and transferred, at 30 V for 16–18 h onto a 0.22 μm nitrocellulose membrane using a buffer containing 25 mM Tris base, 192 mM glycine, 20% v/v methanol, and 0.04% SDS, pH 8.3. Western blot analysis was performed using the appropriate dilutions of primary and secondary antibodies. Equal protein loading was guaranteed by probing the blots with anti-actin antibodies. Immunoreactive bands were visualized using horseradish peroxidase-conjugated secondary antibodies, followed by chemiluminescence.
Quantitative real-time PCR and RT–PCR
Total RNA was isolated using Trizol (Invitrogen) and cleaned up with RNeasy Mini kit (Qiagen); 9 μg of total RNA was used in 40 μl of reverse transcription (RT) reaction, using a RT–PCR kit (Gibco Invitrogen). The RT–PCR was carried out in a 20-μl reaction mixture containing 2 μl cDNA as template, 0.1 μM of the specific oligonucleotide primer pair. Cycle parameters were 30 s at 94°C, 30 s at 55°C and 1.0 min at 72°C for 25 cycles. The DNA primers used were listed in Supplementary Table 1 (see Supplementary data). Quantitative PCR was performed on total RNA isolated from postnatal day 11 wt and Hes5 knockout mice. Stratagene SYBR Green PCR master mix was used for all quantitative real-time PCR with CGT 5′ primer 5′-CGTTTTGGCAGGAATTTGGA-3′ and 3′ primer 5′-GCTCAATCTGTCTGTGGTTGTAAGAG-3′; CNPase 5′ primer 5′-TTCTGGAGATGAACCCAAGG-3′ and 3′ primer 5′-TCTCTTCACCACCTCCTGCT-3′; glyceraldehyde-3-phosphate dehydrogenase (GAPDH) 5′ primer 5′-ACCCAGAAGACTGTGGATGG-3′ and 3′ primer 5′- CACATTGGGGGTAGGAACAC-3′; Mash1 5′ primer 5′-TTGAACTCTATGGCGGGTTC-3′ and 3′ primer 5′- CAAAGTCCATTCCCAGGAGA-3′; Sox10 5′ primer 5′-AGCCCAGGTGAAGACAGAGA-3′ and 3′ primer 5′-AGTCAAACTGGGGTCGTGAG-3′. Data were normalized to the internal control GAPDH and statistical significance was evaluated by Student's t-test.
Immunohistochemistry
Animals were anesthetized and perfused with 4% paraformaldehyde in 0.1 M phosphate buffer, pH 7.2. The brains were removed, post-fixed and cryoprotected in 30% sucrose. Twenty-micrometer frozen sections were cut and those corresponding to the levels +0.5 mm to +0.26 mm of bregma in the adult according to Franklin and Paxinos mouse brain atlas (Franklin and Paxinos, 1997) were selected for the immunohistochemical analysis, upon adjustment to the growing bregma-to-lambda distance in the developing mice. For myelin protein and Sox10 staining, sections were first incubated in −20°C methanol for 10 min. After rinsing in 0.1 M phosphate-buffered saline, sections were blocked with blocking solution (0.1 M phosphate buffer, 0.1% gelatin, 1% bovine serum albumin and 0.002% sodium azide) with 10% normal goat serum (Vector Laboratories) for 30 min and then incubated overnight in primary antibodies. Immunofluorescent cells were identified after incubation in fluorescein or texas red-conjugated secondary antibodies for 1 h. Sections were analyzed using a fluorescence microscope (Leica DM-RA) and images were captured using a Hamamatsu CCD camera interfaced with a G4 computer. Confocal images were acquired using a Zeiss LSM 510 microscope.
Electrophoretic mobility shift assay
Transfected 293T cells were counted, spun down by centrifugation, washed with buffer A (10 mM HEPES, pH 7.9, 1.5 mM MgCl2, 10 mM KCl, 0.5 mM DTT, 25 μg/ml leupeptin, 2 μg/ml Aprotinin, 0.1 M NaF, 0.2 mM PMSF), and incubated in buffer A containing 0.1% NP-40. The released nuclei were pelleted and then resuspended at a density of 200 000 nuclei/μl in buffer C (20 mM HEPES, pH 7.9, 25% glycerol, 0.42 M NaCl, 1.5 mM MgCl2, 0.2 mM EDTA, 0.5 mM DTT, 25 μg/ml leupeptin, 2 μg/ml Aprotinin, 0.1 M NaF, 0.2 mM PMSF). Nuclear extracts were cleared by centrifugation and then stored at −70°C until use.
The oligonucleotide probe corresponding to the putative Hes5 binding sites in the MBP promoter (gb: M24410) from 740 to 763 nt (5′-TGGGGCTTGTGCACTGGTGGCCTT-3′) was kindly provided by Dr Miskimins (University of South Dakota) and was labeled with 32P by T4 polynucleotide kinase according to the manufacturer's protocol. Adenosine 5′-[g-32P]triphosphate, triethylammonium was obtained from Amersham Biosciences. The labeled probes were further purified using mini Quick Spin DNA Columns (Roche).
Nuclear extracts were diluted in 20 mM HEPES, pH 7.9, 0.25 M sucrose, 50 mM KCl, 0.2 mM EDTA, 0.5 mM DTT, 0.5 mM PMSF, 5 mM MgCl2 0.1 mM ZnCl2, the end labeled probe was added and the complexes were resolved on a nondenaturing polyacrylamide gel and then visualized by autoradiography.
Chromatin immunoprecipitation
Chromatin was isolated from transfected oligodendrocyte progenitors, immunoprecipitated with the appropriate antibody and reverse crosslinked. Proteins were digested with proteinase K and the recovered DNA was used for PCR amplification using primer sets specific for 107–206 nt (5′-GGAACGGCAGTGCGTAGTAG3-′ and 5′-CACTTCTTTATCCACCCCCA-3′), 676–819 nt (5′-TGGGAAGTCCTGTTCTCCAC-3′ and 5′-TCACTGTACCAGAGAGCCCC-3′) and 1026–1191 nt (5′-TTCAAGACCCCAGGAAGAAA-3′ and 5′- TTCTTTGGGTCTGCTGTGTG-3′) of the MBP promoter. DNA recovered from chromatin that was not immunoprecipitated was used as control for loading.
Densitometric analysis
This was performed using Scion Image beta 4.0.2 Software (Scion Corporation), a PC version of the NIH Image program. The density of each immunoreactive band was determined for each sample and normalized to the densitometric value of the actin band in the corresponding sample. The calculation was repeated for three distinct experiments and the average value and standard deviation were obtained for each band. Significance was calculated using Student's t-test.
Supplementary Material
Supplementary material
Acknowledgments
This study was supported in part by a postdoctoral fellowship from the National Multiple Sclerosis Society FA1534A1 (to AL) and by the grant NIH-NINDS (RO142925) to PCB.
References
- Akazawa C, Sasai Y, Nakanishi S, Kageyama R (1992) Molecular characterization of a rat negative regulator with a basic helix-loop-helix structure predominantly expressed in the developing nervous system. J Biol Chem 267: 21879–21885 [PubMed] [Google Scholar]
- Cau E, Gradwohl G, Casarosa S, Kageyama R, Guillemot F (2000) Hes genes regulate sequential stages of neurogenesis in the olfactory epithelium. Development 127: 2323–2332 [DOI] [PubMed] [Google Scholar]
- Espinosa L, Ingles-Esteve J, Robert-Moreno A, Bigas A (2003) IkappaBalpha and p65 regulate the cytoplasmic shuttling of nuclear corepressors: cross-talk between Notch and NFkappaB pathways. Mol Biol Cell 14: 491–502 [DOI] [PMC free article] [PubMed] [Google Scholar]
- Fisher A, Caudy M (1998) The function of hairy-related bHLH repressor proteins in cell fate decisions. Bioessays 20: 298–306 [DOI] [PubMed] [Google Scholar]
- Franklin KBJ, Paxinos G (1997) The Mouse Brain in Stereotaxic Coordinates. San Diego: Academic [Google Scholar]
- Gokhan S, Marin-Husstege M, Yung SY, Fontanez D, Casaccia-Bonnefil P, Mehler MF (2005) Combinatorial profiles of oligodendrocyte-selective classes of transcriptional regulators differentially modulate myelin basic protein gene expression. J Neurosci 25: 8311–8321 [DOI] [PMC free article] [PubMed] [Google Scholar]
- Grbavec D, Stifani S (1996) Molecular interaction between TLE1 and the carboxyl-terminal domain of HES-1 containing the WRPW motif. Biochem Biophys Res Commun 223: 701–705 [DOI] [PubMed] [Google Scholar]
- Hatakeyama J, Bessho Y, Katoh K, Ookawara S, Fujioka M, Guillemot F, Kageyama R (2004) Hes genes regulate size, shape and histogenesis of the nervous system by control of the timing of neural stem cell differentiation. Development 131: 5539–5550 [DOI] [PubMed] [Google Scholar]
- Inoue Y, Kagawa T, Matsumura Y, Ikenaka K, Mikoshiba K (1996) Cell death of oligodendrocytes or demyelination induced by overexpression of proteolipid protein depending on expressed gene dosage. Neurosci Res 25: 161–172 [DOI] [PubMed] [Google Scholar]
- Ishibashi M, Ang SL, Shiota K, Nakanishi S, Kageyama R, Guillemot F (1995) Targeted disruption of mammalian hairy and Enhancer of split homolog-1 (HES-1) leads to up-regulation of neural helix-loop-helix factors, premature neurogenesis, and severe neural tube defects. Genes Dev 9: 3136–3148 [DOI] [PubMed] [Google Scholar]
- John GR, Shankar SL, Shafit-Zagardo B, Massimi A, Lee SC, Raine CS, Brosnan CF (2002) Multiple sclerosis: re-expression of a developmental pathway that restricts oligodendrocyte maturation. Nat Med 8: 1115–1121 [DOI] [PubMed] [Google Scholar]
- Jung M, Kramer E, Grzenkowski M, Tang K, Blakemore W, Aguzzi A, Khazaie K, Chlichlia K, von Blankenfeld G, Kettenmann H, Trotter J̇ (1995) Lines of murine oligodendroglial precursor cells immortalized by an activated neu tyrosine kinase show distinct degrees of interaction with axons in vitro and in vivo. Eur J Neurosci 7: 1245–1265 [DOI] [PubMed] [Google Scholar]
- Kagawa T, Ikenaka K, Inoue Y, Kuriyama S, Tsujii T, Nakao J, Nakajima K, Aruga J, Okano H, Mikoshiba K (1994) Glial cell degeneration and hypomyelination caused by overexpression of myelin proteolipid protein gene. Neuron 13: 427–442 [DOI] [PubMed] [Google Scholar]
- Kondo T, Raff M (2000) Basic helix-loop-helix proteins and the timing of oligodendrocyte differentiation. Development 127: 2989–2998 [DOI] [PubMed] [Google Scholar]
- Marin-Husstege M, He Y, Li J, Kondo T, Sablitzky F, Casaccia-Bonnefil P (2006) Multiple roles of Id4 in developmental myelination: predicted outcomes and unexpected findings. Glia 54: 285–296 [DOI] [PubMed] [Google Scholar]
- McLarren KW, Lo R, Grbavec D, Thirunavukkarasu K, Karsenty G, Stifani S (2000) The mammalian basic helix loop helix protein HES-1 binds to and modulates the transactivating function of the runt-related factor Cbfa1. J Biol Chem 275: 530–538 [DOI] [PubMed] [Google Scholar]
- Miskimins R, Srinivasan R, Marin-Husstege M, Miskimins WK, Casaccia-Bonnefil P (2002) p27(Kip1) enhances myelin basic protein gene promoter activity. J Neurosci Res 67: 100–105 [DOI] [PubMed] [Google Scholar]
- Nakao K, Campos-Ortega JA (1996) Persistent expression of genes of the enhancer of split complex suppresses neural development in Drosophila. Neuron 16: 275–286 [DOI] [PubMed] [Google Scholar]
- Ohtsuka T, Ishibashi M, Gradwohl G, Nakanishi S, Guillemot F, Kageyama R (1999) Hes1 and Hes5 as notch effectors in mammalian neuronal differentiation. EMBO J 18: 2196–2207 [DOI] [PMC free article] [PubMed] [Google Scholar]
- Ohtsuka T, Sakamoto M, Guillemot F, Kageyama R (2001) Roles of the basic helix-loop-helix genes Hes1 and Hes5 in expansion of neural stem cells of the developing brain. J Biol Chem 276: 30467–30474 [DOI] [PubMed] [Google Scholar]
- Paroush Z, Finley RL Jr, Kidd T, Wainwright SM, Ingham PW, Brent R, Ish-Horowicz D (1994) Groucho is required for Drosophila neurogenesis, segmentation, and sex determination and interacts directly with hairy-related bHLH proteins. Cell 79: 805–815 [DOI] [PubMed] [Google Scholar]
- Parras CM, Galli R, Britz O, Soares S, Galichet C, Battiste J, Johnson JE, Nakafuku M, Vescovi A, Guillemot F (2004) Mash1 specifies neurons and oligodendrocytes in the postnatal brain. EMBO J 23: 4495–4505 [DOI] [PMC free article] [PubMed] [Google Scholar]
- Readhead C, Schneider A, Griffiths I, Nave KA (1994) Premature arrest of myelin formation in transgenic mice with increased proteolipid protein gene dosage. Neuron 12: 583–595 [DOI] [PubMed] [Google Scholar]
- Samanta J, Kessler JA (2004) Interactions between ID and OLIG proteins mediate the inhibitory effects of BMP4 on oligodendroglial differentiation. Development 131: 4131–4142 [DOI] [PubMed] [Google Scholar]
- Stolt CC, Rehberg S, Ader M, Lommes P, Riethmacher D, Schachner M, Bartsch U, Wegner M (2002) Terminal differentiation of myelin-forming oligodendrocytes depends on the transcription factor Sox10. Genes Dev 16: 165–170 [DOI] [PMC free article] [PubMed] [Google Scholar]
- Stump G, Durrer A, Klein AL, Lutolf S, Suter U, Taylor V (2002) Notch1 and its ligands Delta-like and Jagged are expressed and active in distinct cell populations in the postnatal mouse brain. Mech Dev 114: 153–159 [DOI] [PubMed] [Google Scholar]
- Takebayashi K, Akazawa C, Nakanishi S, Kageyama R (1995) Structure and promoter analysis of the gene encoding the mouse helix-loop-helix factor HES-5. Identification of the neural precursor cell-specific promoter element. J Biol Chem 270: 1342–1349 [DOI] [PubMed] [Google Scholar]
- Wang S, Sdrulla AD, diSibio G, Bush G, Nofziger D, Hicks C, Weinmaster G, Barres BA (1998) Notch receptor activation inhibits oligodendrocyte differentiation. Neuron 21: 63–75 [DOI] [PubMed] [Google Scholar]
- Wegner M (2001) Expression of transcription factors during oligodendroglial development. Microsc Res Tech 52: 746–752 [DOI] [PubMed] [Google Scholar]
- Wegner M (2000) Transcriptional control in myelinating glia: the basic recipe. Glia 29: 118–123 [PubMed] [Google Scholar]
- Wei Q, Miskimins WK, Miskimins R (2004) Sox10 acts as a tissue-specific transcription factor enhancing activation of the myelin basic protein gene promoter by p27Kip1 and Sp1. J Neurosci Res 78: 796–802 [DOI] [PubMed] [Google Scholar]
- Wei Q, Miskimins WK, Miskimins R (2005) Stage-specific expression of myelin basic protein in oligodendrocytes involves Nkx2.2-mediated repression that is relieved by the Sp1 transcription factor. J Biol Chem 280: 16284–16294 [DOI] [PubMed] [Google Scholar]
- Wu Y, Liu Y, Levine EM, Rao MS (2003) Hes1 but not Hes5 regulates an astrocyte versus oligodendrocyte fate choice in glial restricted precursors. Dev Dyn 226: 675–689 [DOI] [PubMed] [Google Scholar]
- Yonemasu T, Nakahira K, Okumura S, Kagawa T, Espinosa de los Monteros A, de Vellis J, Ikenaka K (1998) Proximal promoter region is sufficient to regulate tissue-specific expression of UDP-galactose: ceramide galactosyltransferase gene. J Neurosci Res 52: 757–765 [DOI] [PubMed] [Google Scholar]
Associated Data
This section collects any data citations, data availability statements, or supplementary materials included in this article.
Supplementary Materials
Supplementary material