Abstract
Limited information exists on the pharmacokinetic (PK)-pharmacodynamic (PD) relationships of drugs against Mycobacterium tuberculosis. Our aim was to identify the PK-PD parameter that best describes the efficacy of rifampin on the basis of in vitro and PK properties. Consistent with 83.8% protein binding by equilibrium dialysis, the rifampin MIC for M. tuberculosis strain H37Rv rose from 0.1 in a serum-free system to 1.0 mg/ml when it was tested in the presence of 50% serum. In time-kill studies, rifampin exhibited area under the concentration-time curve (AUC)-dependent killing in vitro, with maximal killing seen on all days and with the potency increasing steadily over a 9-day exposure period. MIC and time-kill studies performed with intracellular organisms in a macrophage monolayer model yielded similar results. By use of a murine aerosol infection model with dose ranging and dose fractionation over 6 days, the PD parameter that best correlated with a reduction in bacterial counts was found to be AUC/MIC (r2 = 0.95), whereas the maximum concentration in serum/MIC (r2 = 0.86) and the time that the concentration remained above the MIC (r2 = 0.44) showed lesser degrees of correlation.
Despite the availability of effective chemotherapies, tuberculosis (TB) is annually responsible for 3 million deaths and 8 million new cases worldwide and worldwide is the leading cause of death due to a single infectious agent (15). The cure rate is poor in most countries due to compliance issues that are reflective of the long duration of therapy. The requirement for the prolonged duration of therapy to completely eradicate the tubercle bacilli from the host is not clearly understood. The situation is further complicated by the rapid emergence of multidrug-resistant Mycobacterium tuberculosis strains (29). There is an urgent medical need to identify new drugs with significant therapeutic activities against single- or multiple-drug-resistant strains of M. tuberculosis with properties that permit a reduced duration of treatment, which will enable better coverage by directly observed therapy. However, the discovery of new anti-M. tuberculosis drugs is hampered by the lack of an understanding of the pharmacokinetic (PK)-pharmacodynamic (PD) basis of effective cure, which includes early bactericidal activity and eventual sterilization.
One way to both improve the use of the present drugs and possibly also assist with the search for new agents would be to understand better the PDs of these agents. As an example, it is not known why the first-line anti-M. tuberculosis drugs are active when they are given as infrequently as twice weekly, even though they have PK parameters that would predict the need for multiple daily doses (5). Most investigations in this area have used the broth MIC and, to a limited extent, the intracellular MIC as in vitro parameters as correlations with efficacy (5, 6, 13). Some attempts have been made to link the postantibiotic effect to in vivo efficacy (14). Reliably predictive in vitro parameters are not available for sterilization, the key end point in TB chemotherapy. For example, pyrazinamide has a very low or no MIC for M. tuberculosis at neutral pH, penetrates rapidly into macrophages (1) but shows no activity against intracellular bacteria (31), yet has an excellent sterilization ability in vivo (27). Likewise, isoniazid is extremely potent in vitro, with an MIC of <0.05 mg/liter, but has a poor sterilization ability in vivo (27).
The lack of understanding of PD predictors in this area also confounds the search for new agents. In vivo models of TB require lengthy study periods, and knowledge of meaningful in vivo predictors of the PD response would be valuable. We have thus sought to identify the PD parameter(s) for rifampin that describes its bactericidal efficacy in an aerosol infection model of TB in mice. We studied the following aspects to determine bactericidal efficacy: protein binding, MIC in serum, killing kinetics under extracellular growth conditions, killing kinetics in a macrophage infection model, PK parameters in uninfected BALB/c mice, and dose fractionation in aerogenically infected BALB/c mice.
MATERIALS AND METHODS
Chemicals.
Rifampin (lot 304324/1) was purchased from Fluka Biochemika, Bucks, Switzerland. Carboxymethyl cellulose (lot 77H1077) was purchased from Sigma, St. Louis, Mo. EDTA (lot 5-4514) was purchased from Hi-Media Labs, Mumbai, India. Acetonitrile (high-pressure liquid chromatography [HPLC] grade) was obtained from Spectrochem Pvt. Ltd., Mumbai, India.
M. tuberculosis H37Rv.
The inocula used for in vitro, macrophage, and animal infection studies was prepared by methods reported earlier (35). The inocula used for all the experiments were derived from a single seed lot that has been maintained at −70°C and that was made from infected mouse lungs, followed by a single round of amplification in broth. Briefly, M. tuberculosis H37Rv ATCC 27294, a strain sensitive to all standard anti-TB drugs, was grown in roller bottles in Middlebrook 7H9 broth supplemented with 0.2% glycerol, 0.25% Tween 80 (Sigma), and 10% albumin dextrose catalase (Difco Laboratories, Detroit, Mich.) at 37°C for 7 to 10 days. The cells were harvested by centrifugation, washed twice in 7H9 broth, and resuspended in fresh 7H9 broth. Aliquots of 0.5 ml were dispensed, and the seed-lot suspensions were stored at −70°C.
Macrophages and culture conditions.
The J774A.1 mouse macrophage-like cell line, obtained from the American Type Culture Collection (ATCC; TIB-67), was grown in Dulbecco's modified Eagle's medium (DMEM; Gibco-BRL Life Technologies, Gaithersburg, Md.) in 75-cm2 flasks (Corning Costar Corp., Cambridge, Mass.). DMEM was supplemented with 100 mM sodium pyruvate, 200 mM l-glutamine, 3.7 g of sodium bicarbonate (Sigma) per liter, and 10% fetal calf serum (Gibco-BRL Life Technologies) without any antibiotics. The macrophages were harvested by trypsinization and counted in a hemocytometer, viability was determined by trypan blue exclusion, and the macrophages were seeded in 9-cm2 slide flasks (Nunc, Roskilde, Denmark) with complete DMEM containing 10% fetal calf serum at a density of approximately 5 × 10⁵ cells/flask and incubated overnight. The macrophages were incubated at 37°C in a 5% CO2 atmosphere.
Animals.
The Institutional Animal Ethics Committee, registered with the Government of India (registration no. CPCSEA 1999/5), approved all animal experimental protocols and animal use. Ethical practices recommend the use of equal numbers of animals of both sexes wherever possible, and since preliminary studies indicated that sex did not influence the outcome of either the PKs or efficacy of rifampin, male and female BALB/c mice were used for the PK and efficacy studies, respectively. Six- to 8-week-old mice purchased from National Institute of Nutrition, Hyderabad, India, were randomly assigned to cages, with the restriction that the weights of all cage members were within 1 to 2 g of each other. They were allowed 1 week of acclimation before intake into experiments. Feed and water were given ad libitum.
Protein binding by equilibrium dialysis.
An equilibrium microvolume dialyzer with cellulose acetate membranes (12-14K NMWL; Hoefer Scientific) was used for equilibrium dialysis. The dialyzer was loaded with 0.1 ml of sodium phosphate buffer (0.1 mM; pH 7.4) on one side and 0.1 ml of BALB/c mouse plasma with the drug at a concentration of 0.1 mM on the other side. Dialysis was carried out at 19 rpm for 20 h at room temperature. Following dialysis, 0.075 ml of plasma was precipitated with acetonitrile and centrifuged. The supernatant from the precipitated plasma fraction and the buffer fraction were analyzed by reversed-phase HPLC, and percent binding was calculated.
MICs in broth and serum.
The MICs of rifampin for M. tuberculosis were determined in broth and serum by a standard microdilution method according to the guidelines of NCCLS. The assay was performed in a 96-well microtiter plate (catalog no. 900196; Tarsons, Kolkata, India), in which all the peripheral wells were filled with sterile distilled water. Serial twofold dilutions of rifampin were placed in the remaining wells, with the concentrations ranging from 32 to 0.06 mg/liter. For determination of the MIC in broth, BACTEC 7H12B medium was used as the diluent, while for determination of the MIC in serum, equal quantities of 7H12B broth and fetal calf serum (Sigma-Aldrich, St. Louis, Mo.) were used. Each well was inoculated with a final inoculum of approximately 5 × 10⁵ CFU/ml. The plates were incubated at 37°C for 16 to 18 days, and the wells were assessed for visible turbidity. The lowest concentration at which there was no visible turbidity was defined as the MIC.
Killing kinetics in vitro.
The killing kinetics of rifampin were determined in BACTEC 7H12B medium, followed by plating on Middlebrook 7H11 agar plates to obtain colony counts. The M. tuberculosis culture was inoculated into BACTEC vials, and the vials were monitored daily with the BACTEC TB 460 system (32). When the growth indices of the cultures reached 999, twofold dilutions of rifampin ranging from 256 to 0.0039 mg/liter were added to the vials. The day of drug addition was defined as day 0. Before addition of the drug, plating was carried out on day 0 to estimate the initial bacterial count. After drug addition, samples from the cultures with each concentration along with a drug-free control were washed, serially diluted, and plated on alternate days for 9 days to determine the numbers of CFU per milliliter. Time-kill curves were plotted and analyzed for the rate and extent of bacterial killing. Analysis of antimycobacterial activity was performed by comparing the rates of bacterial killing determined by nonlinear regression analysis with 95% confidence limits. The rate of killing was determined from the start of the experiment to the time of maximal reduction in the log10 CFU per milliliter. In vitro dose-response curves for rifampin were obtained by plotting the log10 CFU against the ratio of the concentration to its MIC in broth (Cbroth/MIC ratio). Each concentration of rifampin was multiplied by the time of exposure (C × T product) and then divided by the MIC in broth to give the in vitro area under the concentration-time curve (AUC)/MIC (18, 19).
Intracellular killing kinetics.
Macrophage infection assays were adapted from previously described methods (3). The approximately 5 × 10⁵ J774A.1 macrophages seeded in the 9-cm2 slide flasks were infected with M. tuberculosis from a seed lot (109 CFU/ml) that had been frozen at −70°C at a macrophage:organism multiplicity of infection of 1:7. The macrophage infection was allowed to take place for 2 h at 37°C with 5% CO2. The medium containing the mycobacteria was discarded, macrophage monolayers were washed twice with 3 ml of phosphate-buffered saline containing Ca2+ and Mg2+ to remove the free bacteria, and the flasks were fed fresh complete DMEM containing 4% fetal bovine serum. Sets of duplicate flasks were lysed to estimate the numbers of intracellular M. tuberculosis 2 h after infection. The monolayers that had been washed with phosphate-buffered saline were lysed by adding 1 ml of water plus 0.05% sodium dodecyl sulfate for 5 min. The 1 ml of lysate was serially diluted, and 0.1 ml was plated onto Middlebrook 7H11 agar plates (Difco Laboratories). The numbers of CFU were read after 3 to 4 weeks. For the remaining flasks, either the flasks were kept as infection controls or at 2 h postinfection rifampin was added to sets of duplicate flasks at concentrations ranging from 0.1 to 50 mg/liter. The final concentration of dimethyl sulfoxide in the medium was 1% for all conditions. Sets of duplicate flasks from the infection control flasks and flasks with each drug concentration were sampled every 24 h for 3 to 4 days. The flasks were washed to remove the extracellular bacteria, if any were present, released after lysis of macrophages. The cell lysates were serially diluted and plated onto Middlebrook 7H11 agar plates to estimate the numbers of intracellular viable mycobacteria. The intracellular mycobacterial killing rates of rifampin were determined by nonlinear regression analysis with 95% confidence limits, and inhibitory sigmoidal curves were prepared by plotting the log10 CFU per milliliter against the Cbroth/MIC ratio and the AUC/MIC ratio, as described above.
PK measurements.
The concentration of rifampin in mouse plasma was determined by HPLC assay following acetonitrile precipitation. Fifty microliters of plasma containing various concentrations of rifampin was extracted with 75 μl of acetonitrile for 10 min on a microtube mixer (TOMY, MT-360; Tomy Seiko Co. Ltd., Tokyo, Japan) at a mixing speed set at 7 and centrifuged at 14,000 rpm for 10 min in tabletop centrifuge (5415C; Eppendorf). A total of 100 μl of supernatant was then mixed with 50 μl of MilliQ water, and 75 μl of this mixture was injected into the HPLC column. A Shimadzu high-pressure liquid chromatograph (class VP) with an SCL-10AVP system controller, LC10-AT-VP pumps, and an SPD-10A VP UV detector connected to a SIL-10AD VP autoinjector was used. The mobile phase consisted of acetonitrile and ammonium acetate (10 mM; pH 4.5), and linear gradient runs were used. The flow rate was 1 ml/min, and the run time was 25 min. Under these conditions rifampin eluted at 13.8 to 14.2 min. Rifampin was monitored at 254 nm. A KROMASIL C18 column (250 by 4.6 mm, 5 μm; Flexit Jour Laboratories Pvt. Ltd., Pune, India) was used. Calibration standards for rifampin were prepared in duplicate in normal plasma by using serial twofold dilutions. The calibration curves were linear in the concentration range between 0.02 and 256 mg/liter (r2 = 0.99).
PKs of rifampin in uninfected mice.
Dose-ranging studies were conducted to determine the PKs of rifampin when it was administered orally by gavage as a single dose at a dose volume of 10 ml/kg of body weight. The doses used were 0.33, 10, 90, 270, and 810 mg of rifampin/kg in 0.25% (wt/vol) carboxymethyl cellulose. Blood was collected at various time points ranging from 0.5 to 72 h postdosing by retro-orbital sinus puncture while the mice were under anesthesia with ether in 0.025 ml of 5% EDTA and placed in heparinized capillary tubes, and the plasma was harvested by centrifugation (5415C; Eppendorf) at 10,000 rpm for 2 min and stored at −70°C until analysis. Three animals were used per time point. The concentration of rifampin in plasma was determined by HPLC assay, as mentioned above.
PK analysis.
PK analyses of the plasma rifampin concentration-time relationship were performed with WinNonLin software (version 1.5; Scientific Consulting, Inc.). A noncompartmental analysis program (model 200; noncompartmental analysis for extravascular administration) was used to calculate the PK parameters, such as the maximum concentration of drug in serum (Cmax), time to Cmax (Tmax), elimination rate constant, elimination half-life, and AUC from time zero to infinity (AUC0-∞).
Calculation of PK-PD parameters.
The MIC of rifampin for M. tuberculosis in serum (1 mg/liter) was used to calculate PK-PD parameters. The Cmax/MIC was defined as the ratio of the Cmax to the MIC in serum, the AUC/MIC was defined as the ratio of AUC0-∞ to the MIC in serum for the period of 144 h divided by 6 to yield the AUC at 24 h (AUC24)/MIC, and the time that the concentration remained above the MIC (T > MIC) was defined as the percentage of the time that the rifampin concentration exceeded the MIC in serum in 144 h. The T > MIC was estimated by the first-order kinetics equation C = C0e−kt, where C is the rifampin concentration, C0 is the concentration at time zero, k is a constant, and t is time.
Aerosol infection in mice.
We have used an aerosol infection model in which the effects of drugs are evaluated following a respiratory infection with small numbers of tubercle bacilli (4, 20, 33). Mice were infected in a biosafety level 3 facility via the inhalation route in an aerosol infection chamber designed and constructed in the Mechanical Engineering Shop, University of Wisconsin—Madison (35). In preliminary experiments, the concentration of bacilli in a Collison nebulizer required to yield 100 CFU/lung 24 h after infection was determined. After infection, the animals were housed for the duration of the study in a biosafety level 3 facility. By using microbial enumeration as the dependent variable, the number of animals required per treatment group was as low as three in experiments for drug evaluation. In the aerosol infection model, it was sufficient to dose the mice for as few as 6 days to achieve a satisfactory dose-response with rifampin and a 4-log10 CFU/lung difference between treated mice and untreated controls.
In vivo dose-response studies.
At 4 weeks postinfection, the mice were dosed once per day orally with rifampin over a dose range of 1 to 270 mg/kg of body weight, with therapy given 6 days a week for 1 or 2 weeks. At the onset and 24 h after the completion of treatment, groups of mice were killed by exposure to CO2, and the lungs were aseptically removed for homogenization in a final volume of 3 ml by using Wheaton Teflon-Glass tissue grinders (catalogue no. W012576). Each suspension was serially diluted in 10-fold steps, and at least 3 dilutions were plated onto Middlebrook 7H11 agar supplemented with 10% albumin dextrose catalase (Difco Laboratories) and incubated at 37°C with 5% CO2 for 3 weeks.
Dose-fractionation studies.
Dose-fractionation studies were conducted to determine the PD parameter that best predicts bactericidal efficacy in the mouse aerosol infection model. Total doses of 2, 6, 18, 60, 180, 540, 1,080, 1,620, 3,240, and 4,860 mg/kg were fractionated either one, three, or six times in 144 h. The groups receiving one and three doses in 144 h, yielding a total dose of either 4,860 or 3,240 mg/kg, were eliminated from the design since the doses exceeded the reported 50% lethal dose (26). Likewise, the groups receiving one dose in 144 h that yielded a total dose of either 1,620 or 1,080 mg/kg were also eliminated from the design. Three mice were used for each regimen, with the control mice receiving saline. Treatment was given for 6 days; the mice were killed posttreatment by CO2 inhalation; and the lungs were harvested, homogenized in 3 ml of saline, and plated for determination of the numbers of CFU.
Statistical analysis.
The colony counts obtained from plating were transformed to log10(x + 1), where x equals the total number of viable tubercle bacilli calculated to be present in a given sample. Nonlinear regression (curve-fitting) analysis was performed with an inhibitory sigmoid maximum-effect (Emax) response model with or without constants for the data from the in vitro killing, macrophage, and in vivo killing studies. Prism software (version 3; GraphPad Software, Inc., San Diego, Calif.) was used for all the calculations described above. EC50 was defined as the concentration of the drug to achieve 50% of the Emax. A 1-log10 CFU killing effect (E) was calculated from the dose-response curves by use of the following equation (17): E0 − {Emax (X)N /[(EC50)N + (X)N]}, where E is the log10 CFU at any given concentration, E0 is the log10 CFU with no drug, Emax is the lowest log10 CFU achieved following treatment, N is the Hill slope, and X is the Cmax/MIC ratio or the AUC/MIC ratio.
RESULTS
Protein binding and MIC in serum.
The MIC in broth in the absence of serum was 0.1 mg/liter, while that in the presence of 50% serum was 1.0 mg/liter. Consistent with this, the mean level of plasma protein binding by equilibrium dialysis was 83.8%.
In vitro killing kinetics.
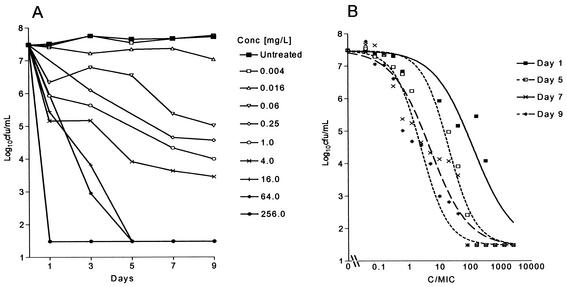
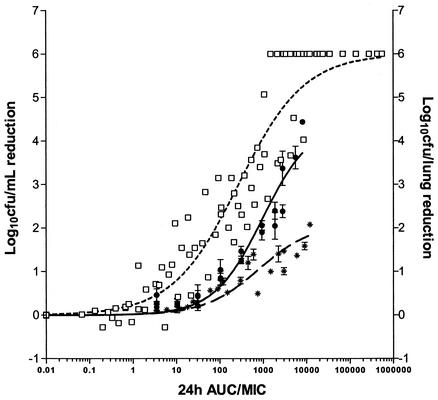
The bacilli were in the stationary phase of growth during the 9-day study period (Fig. 1A). Rifampin exhibited exposure-dependent killing kinetics against extracellular M. tuberculosis under standard broth conditions. The Emax of rifampin was 6 log10 CFU/ml on all days, but the EC50 decreased from day 1 to day 9 (Fig. 1B). When bactericidal activity was plotted against exposure (AUC/MIC), a correlation of 0.88 was obtained, with an EC50 of 297 determined from the AUC24/MIC curve (Fig. 2). The AUC24/MIC required for a reduction of 1 log10 CFU/ml was 30, and the correlation is described by the equation E = 7.48 log10 CFU/ml − [6 log10 CFU/ml (AUC/MIC)0.7/(296.9)0.7 + (AUC/MIC)0.7].
FIG. 1.
(A) Growth of M. tuberculosis in BACTEC 7H12B broth following exposure to increasing concentrations of rifampin. (B) Effect of increasing Cmax/MIC ratios on the bactericidal activity of rifampin on days 1 (r2 = 0.899), 5 (r2 = 0.963), 7 (r2 = 0.946), and 9 (r2 = 0.898) after the addition of drug. Each point represents the mean of duplicate values. The bactericidal effect is calculated on the basis of the initial inoculum prior to the addition of rifampin.
FIG. 2.
Comparison of the magnitude of AUC24/MIC for the bactericidal effect of rifampin in vitro (□), in infected macrophage monolayers (∗), or in vivo (•) following 4 to 6 days of exposure. AUC/MIC is defined as follows: (C × T)/MIC in broth for the in vitro and macrophage studies and AUC24/MIC in serum for the in vivo studies.
Intracellular killing kinetics.
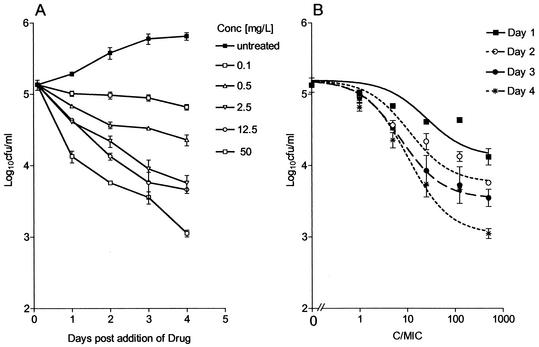
During the course of investigation, the numbers of tubercle bacilli doubled approximately every 24 h (Fig. 3A). Rifampin exhibited exposure-dependent killing kinetics (Fig. 3B), and the intracellular MIC was the same as the extracellular MIC in broth. A sigmoidal response was seen on day 2 to day 4 with increasing concentrations. In this assay a maximum reduction of 2.3 log10 CFU was achieved at a Cbroth/MIC of 500 on day 4. When the log10 CFU was plotted against AUC/MIC, a correlation of 0.83 was obtained, with an AUC24/MIC EC50 of 810 (Fig. 2). The AUC24/MIC ratio that was required for 1-log10 CFU/ml reduction was 665, as described by the equation E = 5.1 log10 CFU/ml − [2.1 log10 CFU/ml (AUC/MIC)0.48/(810)0.48 + (AUC/MIC)0.48].
FIG. 3.
(A) Course of infection in the J774A.1 murine macrophage cell line following exposure to increasing concentrations of rifampin. Drug was added at 2 h postinfection. (B) Effects of increasing Cmax/MIC ratios on the intracellular bactericidal activity of rifampin against M. tuberculosis in the J774A.1 murine macrophage cell line on days 1 (r2 = 0.898), 2 (r2 = 0.969), 3 (r2 = 0.998), and 4 (r2 = 0.973) after the addition of drug. Each point represents the mean ± standard deviation of triplicate values. The bactericidal effect is calculated on the basis of the initial inoculum prior to addition of rifampin.
Single-dose PKs of rifampin in uninfected mice.
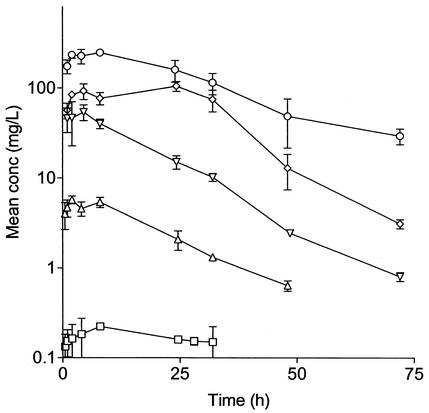
The Tmax of rifampin ranged between 2 and 24 h. The Cmax, AUC0-∞, and T > MIC increased in proportion to the dose of rifampin administered (Fig. 4). The noncompartmental model with a terminal elimination half-life of approximately 12 h best described the PKs of rifampin. From the linear equations for log10 dose versus log10 (Cmax/MIC), log10 (AUC/MIC), and log10 (T > MIC), we calculated AUC24/MIC, Cmax/MIC, and percent T > MIC for each dose and regimen.
FIG. 4.
Single-dose concentration-versus-time PK profiles for incremental oral rifampin doses of 0.33 (□), 10 (▵), 90 (▿), 270 (⋄), and 810 (○) mg/kg in uninfected male BALB/c mice. Error bars indicate standard deviations.
Dose-response studies.
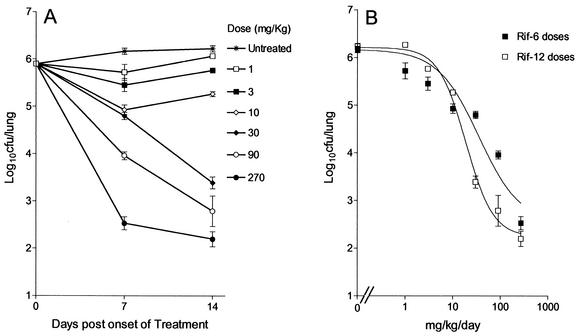
Preliminary studies indicated that 4 weeks postinfection was best suited for the onset of dosing, since it was after the onset of the stationary phase in vivo, in which the bacterial load was approximately 106 CFU/lung (Fig. 5A). Figure 5B shows that there was a linear increase in the effect observed over the entire dose range. The maximum effects observed were reductions of 3.6 and 4.07 log10 CFU/lung after the administration of 6 and 12 doses at 270 mg/kg, respectively. Whereas the Cmax/MIC ratios remained the same irrespective of whether 6 or 12 doses were administered, the AUC/MIC ratios were different, which accounted for the differences in effects observed with doses of 30 and 90 mg/kg. This was a preliminary indication that AUC/MIC may be the predictor of the bactericidal effect of rifampin in vivo.
FIG. 5.
(A) Course of infection from the onset of treatment with increasing doses of rifampin; (B) relationship between the total dose and the log10 CFU per lung (mean ± standard deviation). Mice were dosed once daily for either 6 days (Rif-6; r2 = 0.949) or 12 days (Rif-12; r2 = 0.985).
Dose-fractionation studies
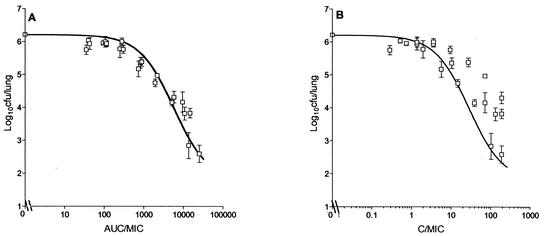
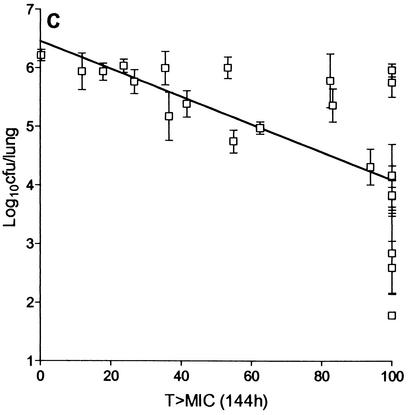
The duration of the dose-fractionation experiment was fixed at 6 days, since it gave an acceptable Emax. Figure 6 shows the relationship between log10 CFU per lung and AUC24/MIC, which is described by the equation E = 6.21 log10 CFU − [4.44 log10 CFU (AUC24/MIC)/933 + AUC24/MIC]; Cmax/MIC, which is described by the equation E = 6.21 log10 CFU − [4.44 log10 CFU (Cmax/MIC)/28.6 + Cmax/MIC]; and percent T > MIC. AUC/MIC showed the highest correlation with bactericidal activity (r2 = 0.95, Fig. 6A), followed by Cmax/MIC (r2 = 0.86; Fig. 6B) and percent T > MIC, which showed the lowest correlation (r2 = 0.44; Fig. 6C). The maximum bactericidal effect of rifampin against M. tuberculosis observed in this model was 4.44 log10 CFU/lung. The AUC24/MIC ratios required for a 1-log10 CFU reduction in vivo and inside macrophages were 271 and 665, respectively, while that required in vitro was 30 (Fig. 2).
FIG. 6.
Relationship between AUC24/MIC (A), Cmax/MIC (B), and T > MIC (C) of rifampin and log10 CFU per lung of M. tuberculosis (mean ± standard deviation) when the total dose was given as one, three, or six equally divided doses over 144 h.
DISCUSSION
On the basis of their in vitro antimicrobial properties, antibacterial agents can be said to show either concentration-dependent killing or time-dependent killing (9, 10). Fluoroquinolones, aminoglycosides, and metronidazole exhibit concentration-dependent killing against a variety of bacteria (22, 24, 25, 28, 36), whereas β-lactams, macrolides, and tetracyclines show time-dependent killing (2, 7, 23, 34). Moreover, it has been shown for fluoroquinolones, aminoglycosides, and β-lactams that their modes of killing are the same in vitro and in vivo. In the case of anti-TB drugs, at best there are only speculations about such relationships that describe the efficacies of rifampin (6) and fluoroquinolones (30). Several studies have been conducted with rifampin to evaluate its bactericidal and sterilizing efficacies in mice (11, 16, 21) and guinea pigs (13, 33). However, from all these studies it is difficult to identify the PD parameter that best describes the efficacy of rifampin.
Our objectives were to identify the PD parameter(s) for rifampin that describes the bactericidal efficacy in an aerosol infection model of TB in mice. Subsequently, the in vitro-in vivo PK-PD relationships that govern sterilization can be unraveled by extending the period of observation following the completion of treatment in vivo by monitoring groups of animals for relapses. This, we believe, will provide a platform for determination of the PK-PD relationships for other anti-TB drugs, thereby enabling a basis for efficient, rapid, and rational progression of compounds in the drug discovery cascade starting from determination of in vitro MICs to eventual sterilization in the animal model.
Dickinson and Mitchison (14) showed that rifampin at 1 mg/liter resulted in a 2.5-log10 CFU/ml reduction in 7 days, thereby concluding that it is a concentration-dependent drug. In our studies, rifampin exhibited an Emax that resulted in a 6-log10 CFU/ml reduction on day 1 to day 7. The EC50 decreased from a Cmax/MIC of 158.5 on day 1 to a Cmax/MIC of 4.89 on day 7, suggesting that rifampin showed a clear exposure (concentration × time)-dependent killing. Thus, the concentration required to achieve a 6-log10 CFU/ml reduction on day 1 was higher than the concentration required to achieve the same reduction on day 7. This is in line with the observation made by Jenne and Beggs (19), who they demonstrated that the 25% inhibition of M. tuberculosis by rifampin was dependent on the product of time and concentration, which is a measure of exposure. It is pertinent that rifampin can rapidly kill 6 log10 CFU of nonreplicating bacilli within a single day, provided that a Cbroth/MIC of >1,000 is achieved.
Rifampin rapidly penetrates mammalian cells and accumulates to four- to fivefold higher levels in the intracellular environment than in the extracellular environment (5). One might argue that this may be an apparent accumulation, since it is difficult to separate that which entered the cell and that which remained adherent to the cell surface due to the high lipophilicity of rifampin. On the contrary, Dhillon and Mitchison (12) showed that the level of intracellular killing by rifampin is lower in macrophages than it is in vitro under cell-free conditions. This is consistent with our observation that the Emax obtained in the macrophage infection model is much lower than that observed under extracellular conditions. Carryn et al. (8) point out that intracellular accumulation and intracellular activity are not necessarily the same. There may be several factors that separate the two, one of which could be the location of the bacilli within the mammalian cell. On the other hand, protein binding does not explain this difference, since under both the broth and macrophage culture conditions, the amount of albumin is less than or equal to 10%.
We were able to demonstrate that AUC/MIC showed the best correlation with the bactericidal efficacy of rifampin. It is pertinent that this bactericidal effect was exerted against nonreplicating organisms, since the onset of treatment in mice was delayed until after the onset of the stationary phase. The AUC24/MIC ratios required for a 1-log10 CFU reduction in vivo and inside macrophages were higher than those required in vitro. The difference in the level of exposure needed could be explained by the presence of barriers within the mammalian host, either at the level of intracellular compartments or at the level of impermeable granulomas, where the bacilli are sequestered from the drug.
Mitchison (27) argues that if the rifampin 600-mg dose recommended at present was increased to 900 mg, it would significantly accelerate the sterilization process. We have provided in our studies a PD basis to support this hypothesis, since we were able to achieve a culture-negative state (<30 CFU/lung) within 6 days of treatment when AUC/MIC ratios of approximately 50,000 were achieved following administration of a 810-mg/kg dose. However, it is not practical to achieve similar levels of exposure (AUC/MIC ratios) in humans without compromising safety. In our experiments a modest increase in the dose from 10 to 15 mg/kg reduces the duration of treatment by one-third to achieve comparable AUC/MIC ratios. While it has long been recognized that rifampin is one of the best drugs in the directly observed therapeutic regimen used at present, there is still room for improvement if one were to achieve an Emax in vivo which is as much as it is in vitro, if only with a better therapeutic window.
In conclusion, the search for new antimycobacterial drugs is hampered by the almost complete lack of PK-PD information that would guide the early discovery stages, in which it is not practical to perform studies with elaborate dosing regimens over long periods for each and every compound. From the experience with the PKs-PDs of broad-spectrum antibacterial agents, it is conceivable that compounds that have made an early progression can proceed through a drug discovery program if one understands the PK-PD basis of efficacy, thereby allowing compounds to progress on the basis of their PKs and in vitro killing properties. The methodologies and the systematic approaches elaborated in this report set the stage for the application of PK-PD principles even in the early stages of an anti-TB drug discovery program.
REFERENCES
- 1.Acocella, G., N. A. Carlone, A. M. Cuffini, and G. Cavallo. 1985. The penetration of rifampicin, pyrazinamide, and pyrazinoic acid into mouse macrophages. Am. Rev. Respir. Dis. 132:1268-1273. [DOI] [PubMed] [Google Scholar]
- 2.Andes, D., and W. A. Craig. 1998. In vivo activities of amoxicillin and amoxicillin-clavulanate against Streptococcus pneumoniae: application to breakpoint determination. Antimicrob. Agents Chemother. 42:2375-2379. [DOI] [PMC free article] [PubMed] [Google Scholar]
- 3.Armitige, L. Y., C. Jagannath, A. R. Wanger, and S. J. Norris. 2000. Disruption of the genes encoding antigen 85A and antigen 85B of Mycobacterium tuberculosis H37Rv: effect on growth in culture and in macrophages. Infect. Immun. 68:767-778. [DOI] [PMC free article] [PubMed] [Google Scholar]
- 4.Brooks, J. V., and I. M. Orme. 1998. Evaluation of once-weekly therapy for tuberculosis using isoniazid plus rifamycins in the mouse aerosol infection model. Antimicrob. Agents Chemother. 42:3047-3048. [DOI] [PMC free article] [PubMed] [Google Scholar]
- 5.Burman, W. J. 1997. The value of in vitro drug activity and pharmacokinetics in predicting the effectiveness of antimycobacterial therapy: a critical review. Am. J. Med. Sci. 31:355-363. [DOI] [PubMed] [Google Scholar]
- 6.Burman, W. J., K. Gallicano, and C. Peloquin. 2001. Comparative pharmacokinetics and pharmacodynamics of the rifamycin antibacterials. Clin. Pharmacokinet. 40:327-341. [DOI] [PubMed] [Google Scholar]
- 7.Carbon, C. 1998. Pharmacodynamics of macrolides, azalides, and streptogramins: effect on extracellular pathogens. Clin. Infect. Dis. 27:28-32. [DOI] [PubMed] [Google Scholar]
- 8.Carryn, S., F. Van Bambeke, M. P. Mingeot-Leclercq, and P. M. Tulkens. 2002. Comparative intracellular (THP-1 macrophage) and extracellular activities of beta-lactams, azithromycin, gentamicin, and fluoroquinolones against Listeria monocytogenes at clinically relevant concentrations. Antimicrob. Agents Chemother. 46:2095-2103. [DOI] [PMC free article] [PubMed] [Google Scholar]
- 9.Craig, W. A. 1998. Pharmacokinetic/pharmacodynamic parameters: rationale for antibacterial dosing of mice and men. Clin. Infect. Dis. 26:1-12. [DOI] [PubMed] [Google Scholar]
- 10.Craig, W. A. 2001. Does the dose matter? Clin. Infect. Dis. 33:S233-S237. [DOI] [PubMed] [Google Scholar]
- 11.Cynamon, M. H., S. P. Klemens, C. A. Sharpe, and S. Chase. 1999. Activities of several novel oxazolidinones against Mycobacterium tuberculosis in a murine model. Antimicrob. Agents Chemother. 43:1189-1191. [DOI] [PMC free article] [PubMed] [Google Scholar]
- 12.Dhillon, J., and D. A. Mitchison. 1992. Activity in vitro of rifabutin, FCE 22807, rifapentine, and rifampin against Mycobacterium microti and M. tuberculosis and their penetration into mouse peritoneal macrophages. Am. Rev. Respir. Dis. 145:212-214. [DOI] [PubMed] [Google Scholar]
- 13.Dickinson, J. M., and D. A. Mitchison. 1976. Bactericidal activity in vitro and in the guinea pig of isoniazid, rifampicin and ethambutol. Tubercle 57:251-258. [DOI] [PubMed] [Google Scholar]
- 14.Dickinson, J. M., and D. A. Mitchison. 1987. In vitro observations on the suitability of new rifamycins for the intermittent chemotherapy of tuberculosis. Tubercle 68:183-193. [DOI] [PubMed] [Google Scholar]
- 15.Dye, C., S. Scheele, P. Dolin, V. Pathiana, and M. C. Raviglione. 1999. Global burden of tuberculosis: estimated incidence, prevalence and mortality by country. JAMA 282:677-686. [DOI] [PubMed] [Google Scholar]
- 16.Grosset, J., C. Truffot-Pernot, C. Lacroix, and B. Ji. 1992. Antagonism between isoniazid and the combination pyrazinamide-rifampicin against tuberculosis infection in mice. Antimicrob. Agents Chemother. 36:548-551. [DOI] [PMC free article] [PubMed] [Google Scholar]
- 17.Holford, N. H. G., and L. B. Sheiner. 1981. Understanding the dose-effect relationship: clinical application of pharmacokinetic-pharmacodynamic models. Clin. Pharmacokinet. 6:429-453. [DOI] [PubMed] [Google Scholar]
- 18.Hyatt, J. M., P. S. McKinnon, G. S. Zimmer, and J. J. Schentag. 1995. The importance of pharmacokinetic/pharmacodynamic surrogate markers to outcome: focus on antibacterial agents. Clin. Pharmacokinet. 28:143-160. [DOI] [PubMed] [Google Scholar]
- 19.Jenne, J. W., and W. H. Beggs. 1973. Correlation of in vitro and in vivo kinetics with clinical use of isoniazid, ethambutol, and rifampin. Am. Rev. Respir. Dis. 107:1013-1021. [DOI] [PubMed] [Google Scholar]
- 20.Kelly, B. P., S. K. Furney, M. T. Jessen, and I. M. Orme. 1996. Low-dose aerosol infection model for testing drugs for efficacy against Mycobacterium tuberculosis. Antimicrob. Agents Chemother. 40:2809-2812. [DOI] [PMC free article] [PubMed] [Google Scholar]
- 21.Kradolfer, F., and R. Schnell. 1971. The combination of rifampicin and other antituberculosis agents in chronic murine tuberculosis. Chemotherapy 16:173-182. [DOI] [PubMed] [Google Scholar]
- 22.Lacy, M. K., D. P. Nicolau, C. H. Nightingale, and R. Quintillani. 1998. The pharmacodynamics of aminoglycosides. Clin. Infect. Dis. 27:23-27. [DOI] [PubMed] [Google Scholar]
- 23.Leggett, J. E., B. Fantin, S. Ebert, K. Totsuka, B. Vogelman, W. Calame, H. Mattie, and W. A. Craig. 1989. Comparative antibiotic dose-effect relations at several dosing intervals in murine pneumonitis and thigh-infection models. J. Infect. Dis. 159:281-292. [DOI] [PubMed] [Google Scholar]
- 24.Lode, H., K. Borner, and P. Koeppe. 1998. Pharmacodynamics of fluoroquinolones. Clin. Infect. Dis. 27:33-39. [DOI] [PubMed] [Google Scholar]
- 25.Mattoes, H. M., M. Banevicius, D. Li, C. Turley, D. Xuan, C. H. Nightingale, and D. P. Nicolau. 2001. Pharmacodynamic assessment of gatifloxacin against Streptococcus pneumoniae. Antimicrob. Agents Chemother. 45:2092-2097. [DOI] [PMC free article] [PubMed] [Google Scholar]
- 26. Merck & Co., Inc. 1997. Merck index, 9th ed., p. 1068. Merck & Co., Inc., Whitehouse Station, N.J.
- 27.Mitchison, D. A. 2000. Role of individual drugs in the chemotherapy of tuberculosis. Int. J. Tuberc. Lung Dis. 4:796-806. [PubMed] [Google Scholar]
- 28.Odenholdt, I., T. Cars, and E. Lowdin. 2000. Pharmacodynamic studies of trovafloxacin and grepafloxacin in vitro against gram-positive and gram-negative bacteria. J. Antimicrob. Chemother. 46:35-43. [DOI] [PubMed] [Google Scholar]
- 29.Pablos-Mendez, A., M. C. Raviglione, A. Laszlo, N. Binkin, H. L. Rieder, F. Bustreo, D. L. Cohn, C. S. Lambregts-van Weezenbeek, S. J. Kim, P. Chaulet, P. Nunn, et al. 1998. Global surveillance for antituberculosis-drug resistance, 1994-1997. N. Engl. J. Med. 339:1641-1649. [DOI] [PubMed] [Google Scholar]
- 30.Peloquin, C. A. 2001. Pharmacological issues in the treatment of tuberculosis Ann. N. Y. Acad. Sci. 953:157-164. [DOI] [PubMed] [Google Scholar]
- 31.Rastogi, N., M. Potar, and H. L. David. 1987. Intracellular growth of pathogenic mycobacteria in the murine macrophage cell line J-774: ultrastructure and drug susceptibility studies. Curr. Microbiol. 16:79-82. [Google Scholar]
- 32.Siddiqi, S. H. 1989. BACTEC TB system, product and procedure manual. Becton Dickinson Diagnostic Instrument Systems, Towson, Md.
- 33.Smith, D. W., V. Balasubramanian, and E. H. Wiegeshaus. 1991. A guinea pig model of experimental airborne tuberculosis for evaluation of the response to chemotherapy: the effect on bacilli in the initial phase of treatment. Tubercle 72:223-231. [DOI] [PubMed] [Google Scholar]
- 34.Tunridge, J. D. 1998. The pharmacodynamics of β-lactams. Clin. Infect. Dis. 27:10-22. [DOI] [PubMed] [Google Scholar]
- 35.Wiegeshaus, E. H., D. N. McMurray, A. A. Grover, G. E. Harding, and D. W. Smith. 1970. Host-parasite relationships in experimental airborne tuberculosis. 3. Relevance of microbial enumeration to acquired resistance in guinea pigs. Am. Rev. Respir. Dis. 102:422-429. [DOI] [PubMed] [Google Scholar]
- 36.Zhanel, G. G., and A. M. Noreddin. 2001. Pharmacokinetics and pharmacodynamics of the new fluoroquinolones: focus on respiratory infections. Curr. Opin. Pharmacol. 1:459-463. [DOI] [PubMed] [Google Scholar]


