Abstract
To investigate the local effects of angiotensin II on the heart, we created a mouse model with 100-fold normal cardiac angiotensin-converting enzyme (ACE), but no ACE expression in kidney or vascular endothelium. This was achieved by placing the endogenous ACE gene under the control of the α-myosin heavy chain promoter using targeted homologous recombination. These mice, called ACE 8/8, have cardiac angiotensin II levels that are 4.3-fold those of wild-type mice. Despite near normal blood pressure and a normal renal function, ACE 8/8 mice have a high incidence of sudden death. Both histological analysis and in vivo catheterization of the heart showed normal ventricular size and function. In contrast, both the left and right atria were three times normal size. ECG analysis showed atrial fibrillation and cardiac block. In conclusion, increased local production of angiotensin II in the heart is not sufficient to induce ventricular hypertrophy or fibrosis. Instead, it leads to atrial morphological changes, cardiac arrhythmia, and sudden death.
The renin-angiotensin system (RAS) is a key regulator of blood pressure and electrolyte homeostasis. A critical component of this system is angiotensin-converting enzyme (ACE), which produces the eight amino acid peptide angiotensin II, the effector molecule of the RAS.1 ACE is a zinc metallopeptidase located on the cell surface of endothelium. In this location, ACE produces angiotensin II adjacent to vascular smooth muscle, a critical target organ for this vasoconstrictor. ACE is also produced by a variety of other tissues including renal tubular epithelium, activated macrophages, proximal gut epithelium, and areas of the brain. Endothelium and these other tissues make the isozyme of ACE, termed somatic ACE, which consists of two catalytic domains that are independently capable of producing angiotensin II. Studies of knockout mice established that somatic ACE influences blood pressure and other cardiovascular functions.2,3 In contrast, within the testis, developing male germ cells produce a different ACE isozyme called testis ACE, which plays an important role in normal male reproduction.4
In addition to regulating normal physiology, substantial evidence suggests that the RAS plays an important role in disease, including heart disease.5 Genetic studies reported a link between somatic ACE polymorphisms and the incidence of cardiac hypertrophy, sudden cardiac death, and acute coronary events.6 This is consistent with the clinical effectiveness of ACE inhibitors in treating heart failure.7 The beneficial effects of ACE inhibitors may not be solely the result of blood pressure reduction since other antihypertensive drugs do not produce the same effect. Rather, ACE may directly influence heart function through the local production of angiotensin II. Studies have found that angiotensinogen, renin, and ACE exist in the heart, implying that local generation of angiotensin II may affect cardiac functions including pathological formation of cardiac hypertrophy and fibrosis.8–10
To investigate the local, cardiac effects of angiotensin II, several investigators created transgenic models with overexpression of angiotensinogen,11 ACE,12,13 angiotensin II receptors,14–16 or even angiotensin II peptide17 in the heart. These studies generated controversy in that some models presented with cardiac hypertrophy and fibrosis, while other animal models lacked a cardiac phenotype in the absence of external stimuli.
Here we report a new mouse model, called ACE 8/8, created using targeted homologous recombination in mouse ES cells. These mice overexpress ACE in the heart, but differ from transgenic models in that they lack ACE expression in such traditional ACE expressing tissues as vascular endothelium, kidney, gut, and brain. Thus, rather than adding cardiac ACE expression to endogenous ACE, our model substitutes cardiac ACE expression for the disseminated presence of ACE in a wild-type mouse. As a result, angiotensin II levels in cardiac tissue are greater than four times that of control mice. Surprisingly, ACE 8/8 mice have normal ventricular size and function. The blood pressure of the mice is near normal. However, these mice have very marked enlargement of the left and right atria. This is associated with cardiac arrhythmia and a marked incidence of sudden death. We conclude that increased angiotensin II within the heart is not associated, a priori, with ventricular fibrosis, enlargement, or dysfunction. In contrast, atrial enlargement develops as a result of abnormal amounts of cardiac ACE and angiotensin II, and this appears independent of blood pressure elevation.
Materials and Methods
Creation of ACE.8 Homozygous Mutant Mice
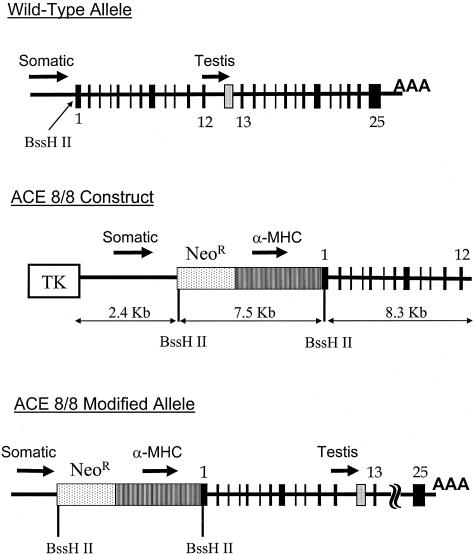
A 10.7-kb fragment of mouse genomic DNA was cloned from a mouse CC1.2 ES cell library. This contained 2.4 kb of the somatic ACE promoter, the somatic ACE transcription start site, and 8.3 kb of genomic sequence encompassing somatic ACE exons 1 through 12. A neomycin cassette (called KT3NP4) was inserted into a unique BssH II restriction site located within the 5′ untranslated region of somatic ACE.18 A 4.4-kb α-myosin heavy chain (α-MHC) promoter was cloned by PCR amplification from an α-MHC plasmid construct sent to us by Dr. Jim Gulick, Cincinnati Children’s Hospital Medical Center. The α-MHC promoter was placed immediately 3′ to the neomycin cassette.
The ACE.8 targeting construct was linearized and electroporated into R1 ES cells derived from a 129/SVx129/SvJ F1 embryo. Individual ES cell clones were screened for targeted homologous recombination using a combination of PCR and genomic Southern blot analysis. The generation of chimeric mutant mice was performed as previously described.3 Chimeric mice were mated to C57BL/6 mice to generate F1 mice. Heterozygous F1 mice were bred to create F2 offspring of wild-type (WT), heterozygous (HZ), and homozygous ACE.8 (8/8) mice. All studies were performed on F2 or F3 generation litters generated from the breeding of heterozygous animals. Age and gender matched littermate controls were used in all studies. Animal procedures were approved by Institutional Animal Care and Use Committee and were supervised by the Emory University Division of Animal Research.
Genotyping of Mice
Genomic DNA was obtained through tail clipping. Three primers were used for PCR genotyping: a reverse primer located in the first exon of the ACE gene (5′-CCACCTCGGCACTCGAGTTATAGCTTCAG-3′); a forward wild-type primer located in the 5′ untranslated region of the ACE gene, (5′-TCTAGCTTCCTCTGAGAGAGCCCGATCTAG-3′); and a forward mutant primer located on the 3′ end of the α-MHC promoter (5′-CCACCTCGGCACTCGAGTTATAGCTTCAG-3′). A 450-bp fragment was amplified for the wild-type allele and a 742-bp fragment was amplified for the mutant allele.
ACE Activity Assay
Cardiac puncture was performed on anesthetized mice to collect blood in heparinized tubes. Plasma was obtained by centrifugation of blood samples at 4°C for 10 minutes at 2000 × g. Animals were then sacrificed and tissue samples were collected. Individual tissues were briefly homogenized at low speed in ACE homogenization buffer (50 mmol/L HEPES, pH 7.4, 150 mmol/L NaCl, 25 mol/L ZnCl2, and 1 mmol/L PMSF). These homogenates were centrifuged at 10,000 × g and the supernatant discarded. The pellets were then resuspended in ACE homogenization buffer containing 0.5% Triton X-100 and vigorously re-homogenized. The tissue homogenates were again spun at 10,000 × g and supernatants were used for ACE activity measurement. Due to the small size of atrial tissues, a small hand-held motorized glass-pestle homogenizer was used following the same procedure. ACE activity was measured using the ACE-REA kit from American Laboratory Products Company, Ltd. (Alpco, Windham, NH). ACE activity assay was performed following the kit instructions and activity was defined as that inhibited by captopril. Protein concentration was measured using BCA Protein Assay Reagent kit (Pierce, Rockford, IL). Tissue ACE activity was calculated as ACE units per μg protein.
Western Blotting, Collagen Staining, and Immunohistochemistry
For Western blot, tissue homogenates were prepared as described for the ACE activity assay. Protein samples (20 μg per lane) were separated on an 8% SDS gel and transferred to a nitrocellulose membrane. The membrane was blotted using a rabbit polyclonal anti-mouse ACE antibody19 and exposed to X-ray film using the enhanced chemiluminescence method.
For histological analysis, tissue samples were taken at euthanasia and preserved in 10% neutral-buffered formalin. Lung tissues were infused with formalin through the trachea. Tissues were then embedded in paraffin using standard procedures. Sections were stained for hematoxylin and eosin, or picro-sirius red using standard techniques. For immunohistochemistry, both ACE 8/8 and wild-type tissues were placed on a single slide. Immunohistochemical detection of ACE was performed as previously described.19
Blood and Tissue Angiotensin and Bradykinin Levels
ACE 8/8 and wild-type mice were anesthetized with a mixture of ketamine (125 mg/kg) and xylazine (12.5 mg/kg) administered by IP injection. Blood was collected from the inferior vena cava directly into a syringe containing 5 ml 4 mol/L guanidine thiocyanate (GTC) using a 25-gauge needle. Tissues were then rapidly removed and immediately rinsed briefly in cold isotonic saline, weighed, and homogenized in 5 ml GTC. The GTC blood and tissue homogenates were then frozen at −80°C and shipped on dry ice to St. Vincent’s Institute of Medical Research where peptide measurements were performed. Angiotensin I, angiotensin II, and bradykinin peptides were measured using HPLC-based radioimmunoasays as previously described.20 The method allows analysis of both angiotensin I and angiotensin II peptides in the same sample during a single HPLC run thus reducing the variance of the peptide ratio. Data from one outlier ACE 8/8 mouse was eliminated from both the angiotensin and bradykinin calculations because the data were greater than 3 standard deviations removed from the means.
Blood Pressure and Urine Osmolality
Systolic blood pressure was measured in conscious mice using a Visitech Systems BP2000 automated tail cuff system (Apex, NC) as previously described.3 Mice were trained in the apparatus for 5 days before data were collected. The blood pressure of an animal was the average of 80 measurements over an additional 4 days.
Spot urine samples were collected before and after 24 hours of water deprivation. Urine samples were spun at 5500 × g to precipitate particulates. Urine osmolality was determined using a Wescat 5500 Vapor Pressure Osmometer (Wescor Inc., Logan, UT).
Heart Weight
Mice were euthanized and the hearts were isolated. The whole hearts were briefly rinsed in 0.9% saline to remove blood. Both atria were carefully removed from the ventricles at the atrial-ventricular septum. The atria and ventricles were then blotted dry and weighed separately.
Echocardiography
Mice ages 7 to 11 weeks were anesthetized with tribromoethanol (0.25 mg/g body weight). M-mode echocardiogram studies were performed as described.21 M-mode measurements of end-diastolic dimension (EDD), end-systolic dimension (ESD), intraventricular wall septum thickness (IVS) and end-diastolic posterior wall thickness (PW) were made from original tracings. Calculated variables included the following: left ventricular fractional shortening (FS = (EDD − ESD)/EDD), relative wall thickness (RWT = (IVS+PW)/EDD), LV mass = 1.06 × ((EDD + PW + IVS)3 − (EDD)3, and LV mass normalized by body weight (LV/BW). Echocardiography was analyzed by B.D.H. who was blinded to genotype of the mice.
In Vivo Hemodynamic Measurements
Mice ages 8 to 12 weeks were anesthetized with a mixture of ketamine (125 mg/kg) and xylazine (12.5 mg/kg) administered by IP injection. The mice were placed on a heated pad during the surgery. A 1.4 French Millar high fidelity pressure catheter (SPR-671, AD Instruments, CO) was inserted into the right carotid artery and then advanced into the left ventricle. The catheter was calibrated using an external analog manometer. Data were recorded using a Powerlab system and Chart 5 software (AD Instruments, CO) with a sample speed of 1 k/s. Heart rate, left ventricular (LV) systolic pressure, and LV end-diastolic pressure were calculated directly from LV pressure wave forms. LV dP/dt max and LV dP/dt min were obtained as the first-degree differential of the LV pressure. The time constant of isovolumic LV relaxation, t, was estimated by an unweighted non-linear least squares method from 42 individual wave forms.
ECG Monitoring
ECG recordings of awake, free-moving mice were obtained using a telemetry method. After mice were sedated with an IP injection of ketamine and xylazine mix (125 mg/kg and 12.5 mg/kg), an EA-F20 ECG transmitter (Data Sciences, MN) was implanted in the intraperitoneal cavity. The positive lead of the transmitter was tunneled subcutaneously to the left anterior chest wall above the apex of the heart and the negative lead to the right shoulder. This configuration approximates lead II on the surface ECG. After 24 hours for recovery from the surgery, the ECG was recorded digitally for 2 minutes at the beginning of each hour using a 500 Hz A/D converter. ECG data were analyzed using Dataquest ART Software, version 2.3 (Data Sciences, MN). For data presentation, recordings were filtered with 100 Hz low-pass filter to reduce noise levels.
Signal averaging was used before interval and waveform analysis (ECG Analysis Software 4.0, Data Sciences, MN). For this analysis, a 2-minute stretch of ECG recording was used and complexes were identified by the T-end fit method with a filter cut-off of 100 Hz and a T-end threshold of 30%. Interval correction for heart rate was calculated using Bazett’s formula.22
Statistical Analysis
All data were expressed as means ± SE. The significance of the difference between two groups was obtained by an unpaired Student’s t-test. The significance of the difference among multiple groups was obtained using analysis of variance and the Tukey HSD test.
Results
Creation of ACE.8 Homozygous Mutant (ACE 8/8) Mice
Homologous recombination was used to modify the ACE gene so that ACE was produced specifically by cardiac tissue. For this purpose, a targeting vector was made in which a neomycin resistance cassette and a 4.4-kb portion of the α-MHC promoter were inserted into a BssH II restriction site, positioned between the start of somatic ACE transcription and translation (Figure 1). This strategy positions the neomycin resistance cassette to block any influence of the endogenous somatic ACE promoter on ACE gene transcription. It also positions the mouse α-MHC promoter, a well-known cardiac-specific promoter, to control the transcription of somatic ACE. This strategy does not alter the testis ACE promoter and the resulting mice were predicted to be fully fertile. We refer to this new line of mice as ACE.8 since it was the eighth modification of the ACE gene prepared in our laboratory.
Figure 1.
ACE 8/8 targeting construct. The top of the figure shows the wild-type organization of the ACE locus. Both the somatic ACE promoter and the testis ACE promoter are indicated with arrows. A unique BssH II restriction site is located between the transcription start site and the translation start site of somatic ACE. The start site for testis ACE transcription is indicated by a gray box between the 12th and 13th exons of somatic ACE. The targeting construct used for homologous recombination (middle) contained 10.7 kb of homologous genomic DNA organized into left and right arms of 2.4 and 8.3 kb. Between these arms, we incorporated the 3.1-kb KT3NP4 neomycin resistance cassette (NeoR) and the 4.4-kb α-MHC promoter such that the structural portion of the ACE gene would now be under the control of the α-MHC promoter. The effects of the somatic ACE promoter were minimized by positioning the neomycin cassette such that any transcripts generated by this ACE promoter would terminate within the neomycin cassette. A thymidine kinase (TK) cassette was positioned 5′ to the 2.4-kb homology arm. With proper homologous recombination, this will not be incorporated within the modified ACE allele (bottom).
Targeted homologous recombination in embryonic stem cells was performed as previously described.18 Proper homologous targeting was verified by both genomic Southern blot analysis and by PCR. Chimeric mice were bred to produce agouti F1 offspring; male and female heterozygous F1 mice were used to produce F2 mice. Of 368 F2 mice genotyped, 96 (26%) were wild-type, 177 (48%) were heterozygous, and 95 (26%) were ACE 8/8 mice. This Mendelian ratio indicates that the ACE 8/8 mutation does not significantly increase mortality before weaning at 3 weeks of age. ACE 8/8 mice appeared grossly normal. Body weight, as determined weekly between 3 and 8 weeks of age, showed no difference between ACE 8/8 mice and wild-type littermates (data not shown).
Tissue Distribution of ACE in ACE 8/8 Mice
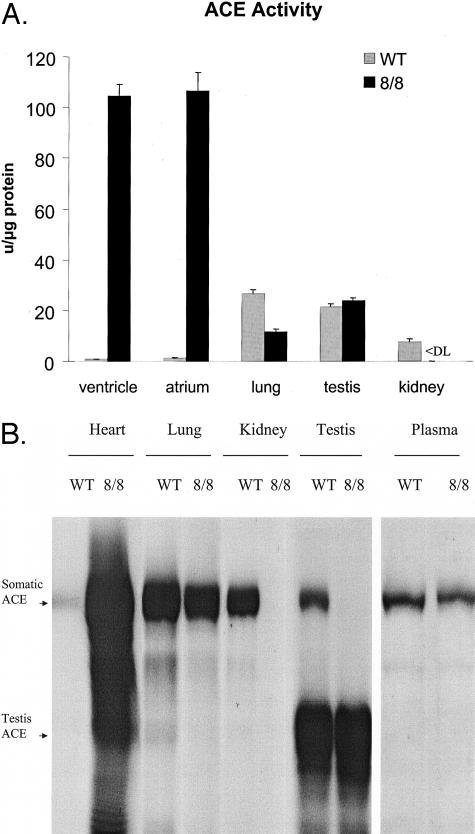
To evaluate the tissue distribution of ACE, wild-type and ACE 8/8 mice were sacrificed and tissue extracts of individual organs were tested for ACE activity (Figure 2A). ACE 8/8 mice had a marked increase in cardiac ACE activity. Specifically, wild-type mice had ACE activity levels in atria and ventricles of 1.2 ± 0.2 U/μg protein and 0.8 ± 0.1 U/μg protein, while ACE activity in ACE 8/8 mice increased about 100-fold to 106.4 ± 7.3 U/μg protein in the atria and 104.5 ± 4.5 U/μg protein in ventricles. Significant ACE activity was also detected in lung and plasma where ACE 8/8 mice had 43% and 56%, respectively, of the activity found in wild-type mice. ACE levels in the testis were similar to those of wild-type. In contrast, kidney (Figure 2A), intestine, spleen, brain, muscle, fat, and liver had virtually undetectable ACE activity in ACE 8/8 mice. In particular, the kidney represents a major change from wild-type mice as this organ normally expresses a substantial amount of ACE activity in both vascular endothelium and proximal tubular epithelium. ACE activity in the heart, plasma, and kidney of heterozygous mice was intermediate that of wild-type and ACE 8/8 mice (data not shown).
Figure 2.
ACE distribution and activity. A: Littermate wild-type (gray bars) and ACE 8/8 mice (black bars) were sacrificed and ACE activity was measured in organ homogenates. ACE activity is expressed as units per microgram total solubilized protein. ACE 8/8 mice have about 100-fold increased ACE activity in cardiac tissues. Significant activity is also seen in lung, testis, and plasma. In contrast, no ACE activity was detected in kidney homogenates of ACE 8/8 mice. The data are the average of 6 to 10 individual mice. All data presented are the group means ± SEM. <DL indicates less than detection limit. B: Tissue homogenates from wild-type (WT) and ACE 8/8 mice were studied by Western blot analysis after separation by SDS-PAGE. Somatic ACE is a band of about 170 kd while testis ACE is a band at about 95 kd. ACE 8/8 mice have substantially more somatic ACE in the whole heart as compared to wild-type mice. In contrast, these mice have somewhat less ACE in the lung and plasma than wild-type mice. ACE 8/8 mice have no ACE in the kidney. They also lack somatic ACE expression in the testis but do express typical levels of testis ACE.
To confirm the results obtained with ACE activity assays, we also performed Western blot analysis of tissue extracts from wild-type and ACE 8/8 mice (Figure 2B). This analysis confirmed the ACE activity data in that a large amount of ACE protein was detected in the whole heart of ACE 8/8 mice. Also, significant ACE protein was observed in lung and plasma. In contrast, no ACE protein was detected in tissue extracts of the kidney in ACE 8/8 mice. Testis ACE protein expression was not altered. In agreement with the ACE activity assay results, ACE protein was also undetectable in the intestine, brain, muscle, liver, and fat of the ACE 8/8 mice by Western blot (data not shown).
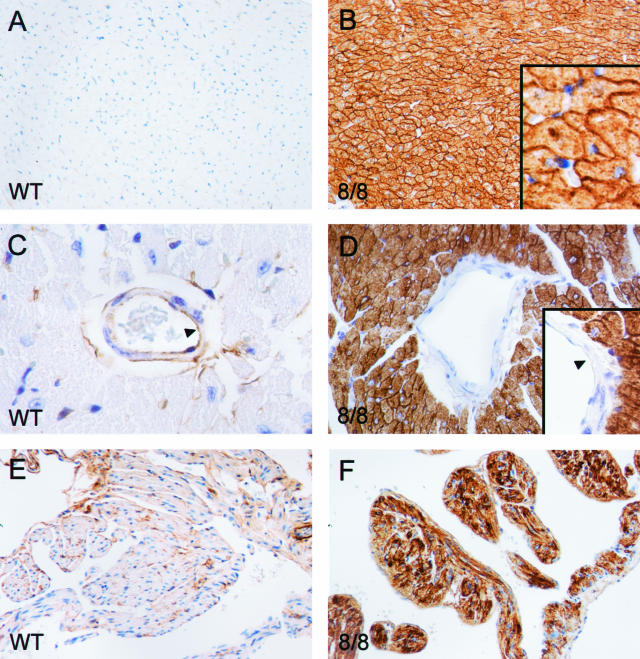
To understand ACE expression patterns in more detail, we performed immunohistochemistry using an anti-ACE antibody (Figure 3). These data were consistent with both the enzyme activity assay and the Western blot analysis. In wild-type mice, cardiac myocytes produced little amount of ACE. In the ACE 8/8 heart, high levels of ACE were found in both ventricles and atria. The ACE was identified on the cell surface of cardiac myocytes. This tissue pattern of distribution is expected as ACE is a membrane-anchored protein normally localized on the surface of cells. Interestingly, there was one tissue within the heart that underexpressed ACE. This tissue was vascular endothelium, which produced ACE in wild-type animals but not in ACE 8/8 mice (Figure 3D).
Figure 3.
ACE immunohistochemistry of heart. Tissues from wild-type (WT) and ACE 8/8 mice were prepared and stained with an anti-ACE antibody. A and B: Sections of cardiac ventricles. The high-power inset in B shows abundant ACE within the cell membranes of myocytes. Despite this, the overall histological appearance of the ACE 8/8 ventricular myocardium was unchanged from that of wild-type tissue. C and D: High-power sections of the heart showing ventricular blood vessels. Wild-type mice have both endothelial and adventitial expression of ACE. In contrast, blood vessels in the hearts of ACE 8/8 mice have no endothelial expression of ACE. E and F: Sections of atria. As in the ventricles, the atria of ACE 8/8 mice make abundant ACE.
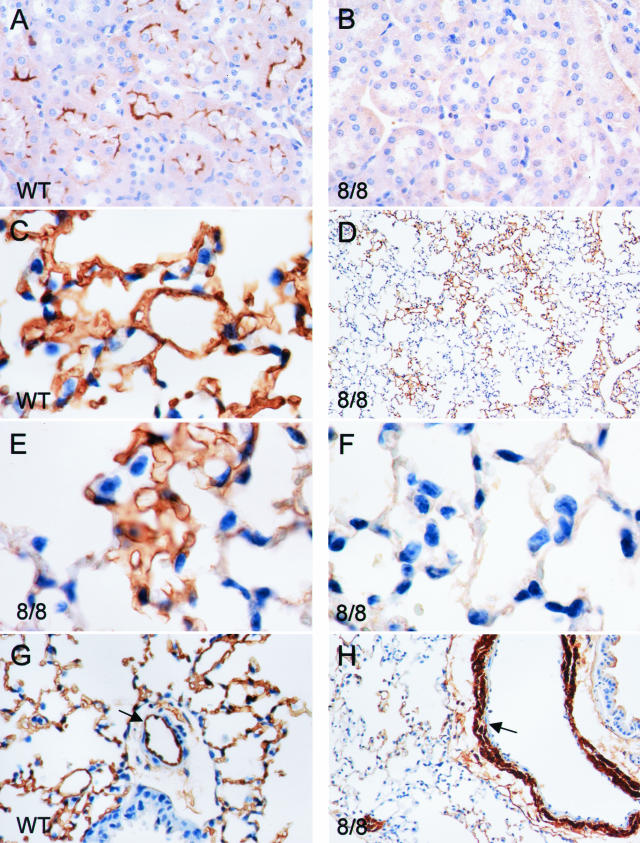
A similar situation was observed in the kidney where wild-type mice expressed ACE in proximal tubular epithelium and vascular endothelium (Figure 4). The kidneys from ACE 8/8 mice had no such expression. In mice that are null for all ACE expression (ACE knockout mice), the kidney shows a phenotype characterized by under-development of the renal medulla and papilla, expansion of the renal calyx and vascular smooth muscle hyperplasia resulting in vascular wall thickening.3 Such a phenotype was not observed in the ACE 8/8 mice where renal medullary development was normal, and vascular wall thickness was equivalent to that of wild-type mice.
Figure 4.
ACE immunohistochemistry of kidney and lung. Tissues from wild-type (WT) and ACE 8/8 mice were prepared and stained with an anti-ACE antibody. A and B: Sections of kidney. Wild-type mice express ACE in proximal tubular epithelium. No ACE was produced by the kidney of ACE 8/8 mice. C: Lung from a wild-type mouse and shows homogeneous and extensive ACE expression. In contrast, D–F: Lung from an ACE 8/8 mouse. Here ACE expression is patchy with portions of the lung expressing ACE (E), found immediately adjacent to areas with no ACE expression (F). In the arterioles of wild-type lung (G), ACE is expressed by vascular endothelium (arrow) and not by vascular smooth muscle. In contrast, arterioles from the lung of ACE 8/8 mice (H) have no endothelial ACE expression but do express abundant ACE in vascular smooth muscle.
In contrast to the heart and the kidney, the pattern of ACE expression in the lung was complex (Figure 4). In wild-type animals, lung endothelium produced abundant ACE, which was distributed homogeneously throughout the lung parenchyma. In the ACE 8/8 mice, however, lung parenchymal expression of ACE was patchy, with microscopic areas of tissue producing the enzyme immediately juxtaposed to similar-sized areas lacking discernable immunoreactive ACE (Figure 4D). It was difficult to determine which cell types in the lung parenchyma were responsible for the ACE expression (smooth muscle, type 1 epithelial cells, or endothelium). A more consistent pattern of ACE expression was observed in the pulmonary artery branches accompanying the bronchial tree. Here, high level ACE expression was observed in vascular smooth muscle (Figure 4H). In contrast, blood vessel endothelium appeared to produce little, if any, ACE. The expression of ACE in pulmonary tissues of ACE 8/8 mice was not a complete surprise. The original characterization of the α-MHC promoter in transgenic mice documented promoter activity in pulmonary vascular smooth muscle.23 As to why lung parenchyma expressed ACE in a patchy pattern, this must reflect heterogeneity of the lung tissue and differential recognition of the α-MHC promoter.
Angiotensin and Bradykinin Peptide Levels in the ACE 8/8 Mice
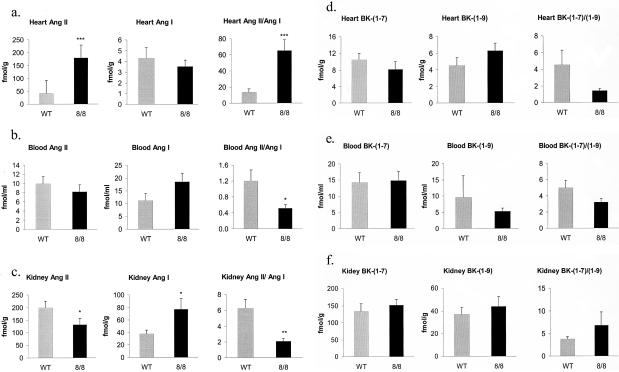
Our hypothesis was that mice with ACE expression shifted to cardiac tissue would generate high levels of cardiac angiotensin II. To measure this, wild-type and ACE 8/8 mice were sacrificed, and ventricles, kidney, and plasma were prepared for HPLC determination of angiotensin peptide levels (Figure 5, a to c). In the ventricles, there was a marked difference in the tissue content of angiotensin II, with ACE 8/8 mice having 4.3-fold the angiotensin II concentration of ventricles from wild-type mice (8/8: 179.7 ± 24.6; WT: 41.5 ± 12.1 fmol/g, P < 0.001). In contrast, the angiotensin I levels were not significantly different between ACE 8/8 and wild-type mice. A useful measure is the angiotensin II/angiotensin I ratio, which was significantly elevated in the ACE 8/8 mice, reflecting the increased ACE activity in the heart. In blood of ACE 8/8 mice, the angiotensin II levels were not significantly different from wild-type. Angiotensin I levels were elevated compared to wild-type values (P < 0.06) resulting in an angiotensin II/angiotensin I ratio that was less than wild-type mice (P < 0.05). In the kidneys of the ACE 8/8 mice, the angiotensin II level was decreased while the angiotensin I level was elevated compared to those of wild-type mice (P < 0.05), resulting in a reduced angiotensin II/angiotensin I ratio (P < 0.01). This is consistent with decreased renal ACE activity in ACE 8/8 mice. In summary, the concentration of angiotensin II was markedly increased in the heart, in agreement with what we predicted from the increased cardiac ACE expression. A decreased ratio of angiotensin II/angiotensin I in the kidney and plasma was consistent with the decreased ACE activity in these tissues.
Figure 5.
Angiotensin (Ang) and bradykinin (BK) peptide levels. Ang II, and Ang I peptide levels were measured in the heart (a), blood (b), and kidney (c) of wild-type (WT) and ACE 8/8 mice. Peptide levels were determined by an HPLC-based method. The ratios of Ang II to Ang I were also calculated. Ang II levels in the hearts of ACE 8/8 mice were 4.3-fold those found in the wild-type mice. All data are means ± SEM *, P < 0.05; **, P < 0.01; ***, P < 0.001. Peptide levels were studied in 9 ACE 8/8 mice and 10 wild-type controls. BK-(1–7), BK-(1–9) and the BK-(1–7)/BK-(1–9) ratios were similarly analyzed in heart (d), blood (e), and kidney (f). No significant differences were noted. Peptide levels were studied in 9 ACE 8/8 mice and 10 wild-type controls.
In addition to converting angiotensin I to angiotensin II, ACE also inactivates bradykinin peptide by converting bradykinin-(1–9) into bradykinin-(1–7) (Figure 5, d to f). We measured the tissue and blood bradykinin peptide levels using an HPLC-based method. In the ventricles of ACE 8/8 mice, bradykinin-(1–9) levels were slightly increased and bradykinin-(1–7) was slightly decreased, but neither measure reached significance. These data were surprising in that we predicted a significant decrease of bradykinin-(1–9) due to increased degradation by ACE. Both blood and kidney levels of bradykinin peptides were also no different from those of wild-type mice. In total, these data suggest that, in vivo, ACE may play a less central role in the degradation of bradykinin-(1–9) than other enzymes such as carboxypeptidase N and aminopeptidase P. A second possibility is that the relationship of ACE and bradykinin is more complicated than presently understood.
Physiological Measurements
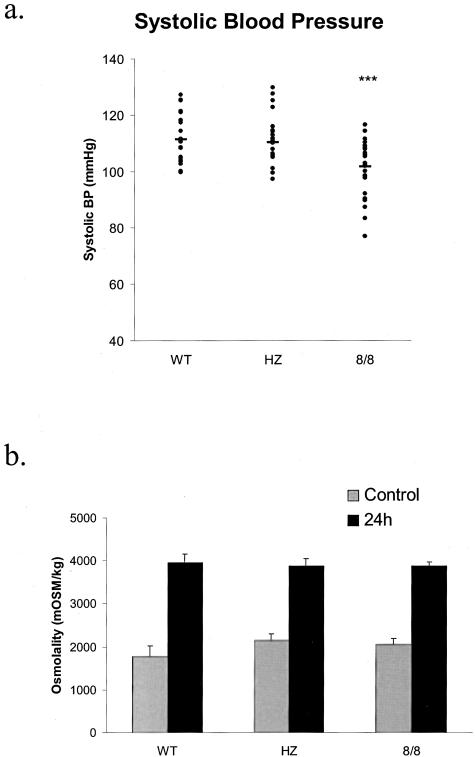
Previous work showed that mice lacking all ACE have a reduction of systolic blood pressure, renal concentrating ability, and hematocrit.2,3 Each of these parameters was studied in the ACE 8/8 mice. Systolic blood pressure was evaluated in conscious wild-type, heterozygous, and ACE 8/8 mice (Figure 6a). The ACE 8/8 mice have a systolic blood pressure that averaged 101.8 ± 1.8 mmHg while wild-type and heterozygous mice averaged 111.3 ± 1.8 and 110.4 ± 1.8 mmHg. While these differences in average blood pressure are small, the ACE 8/8 mice have a statistically lower blood pressure compared to the other two groups (P < 0.001). These differences were also seen when male and female mice for each genotype were compared. Thus, while the ACE 8/8 mice do not show the marked reduction of systolic blood pressure present in ACE null mice, they do have a mild but statistically significant decrease from wild-type or heterozygous mice.
Figure 6.
a: Systolic blood pressure was determined using an automated tail-cuff manometer for 4 consecutive days. The animals are 22 wild-type (WT), 25 heterozygous (HZ), and 28 ACE 8/8 mice. Each dot represents the systolic blood pressure of a single mouse. A solid bar represents the mean for each group of mice. The systolic blood pressure of ACE 8/8 mice was significantly lower than wild-type and heterozygous mice. ***, P < 0.001. b: Urine osmolality was determined from spot samples collected from wild-type (WT), heterozygous (HZ), and ACE 8/8 mice before and after 24-hour water deprivation. All three groups of mice showed a similar increase in urine osmolality following water deprivation. The number of mice in each group was 12 WT, 12 HZ, and 15 8/8. All data are means ± SEM.
While the blood pressure of ACE 8/8 mice was reduced, renal function was not different from that of wild-type animals (Figure 6b). In response to water deprivation, all groups markedly increased urine osmolality to greater than 3000 mosm/L. Similarly, the hematocrit of the ACE 8/8 mice was also equivalent to those of wild-type and heterozygous littermate controls. Thus, our data shows that overexpression of ACE in the heart, coupled with some pulmonary ACE expression, was able to correct most of the phenotypic abnormalities present in ACE null mice.
Diminished Survival of the ACE 8/8 Mice
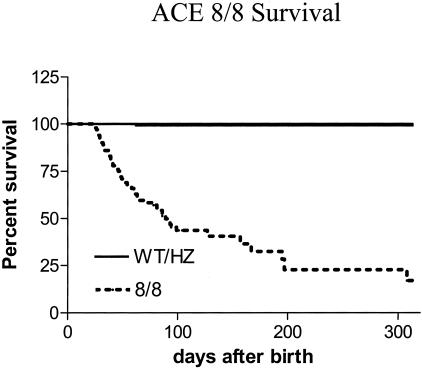
Although the ACE 8/8 mice did not show increased mortality before weaning, a significant incidence of sudden death was observed after 3 weeks of age (Figure 7). For example, at 66 days after birth, only 64% of ACE 8/8 mice were alive as compared to 100% of wild-type and heterozygous mice (P < 0.0001). ACE 8/8 mice continued to die after 60 days of age, though at a rate somewhat less than that measured before 60 days of age. The oldest ACE 8/8 animals survived for over 300 days. However, the survival rate at 300 days was only 23% for ACE 8/8 mice as compared to 100% for wild-type. There was no significant difference in survival between male and female mice using Kaplan-Meier analysis. No weight loss, sudden weight increase, or abnormal behaviors were noticed in the ACE 8/8 animals before death. At necropsy (12 mice) following sudden death, the only abnormal feature was the consistently dilated heart with a remarkable bilateral enlargement of the atria.
Figure 7.
Kaplan-Meier plot of survival. The survival of mice as a function of age was plotted using the Kaplan-Meier method. ACE 8/8 mice have a markedly increased incidence of death as compared to wild-type (WT) or heterozygous mice (HZ). The number of mice studied was 102, 200, and 103 for WT, HZ, and 8/8 mice. Due to the utilization of adult animals for other experiments and the death of 8/8 mice, the number of animals was reduced to 36, 67, and 27 at 100 days, and 13, 17, and 7 at 200 days, respectively, for WT, HZ, and 8/8 mice. The survival rate was significantly decreased in the 8/8 mice compared to WT or HZ mice (P < 0.0001). One of 200 HZ mice died during the course of study, but did not significantly reduce survival rate compared to WT mice (100% survival).
Cardiac Morphology and Function of ACE 8/8 Mice
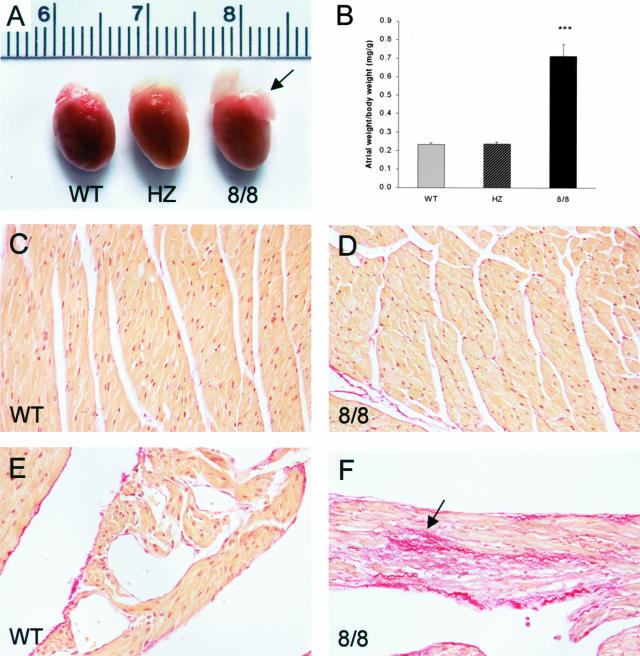
To characterize cardiac development in ACE 8/8 mice, we sacrificed animals ages 3 days to 16 weeks. All ACE 8/8 mice older than 3 weeks had markedly enlarged atria compared to wild-type and heterozygous mice (Figure 8). In a series of mice ages 10 to 16 weeks, we carefully dissected the atria free from the ventricles to determine average atrial and ventricular weight. ACE 8/8 mice had a ventricular weight that was not significantly different from wild-type mice (8/8: 4.4 ± 0.2; WT: 4.4 ± 0.1 mg/g body weight), but atrial weight was threefold greater than that of either wild-type or heterozygous mice (8/8: 0.71 ± 0.06; HZ: 0.24 ± 0.01; WT: 0.23 ± 0.01 mg/g body weight, P < 0.0001).
Figure 8.
Heart morphology and collagen staining. A: The hearts from a wild-type (WT), heterozygous (HZ), and ACE 8/8 mouse are shown. The atria of the ACE 8/8 heart (arrow) are markedly enlarged as compared to the other two genotypes. B: Mice ages 10 to 16 weeks were sacrificed and atria from wild-type (n = 15), heterozygous (n = 5), and ACE 8/8 mice (n = 10) were isolated, blotted dry, and weighed. This is plotted relative to total body weight. The atria weight from ACE 8/8 mice is threefold greater than that of the other genotypes (P < 0.0001). C–F: Heart sections from the ventricles (C and D) and atria (E and F) of wild-type (WT) and ACE 8/8 mice were stained with picro-sirius red. There was no increased fibrosis in the ventricular myocardium of ACE 8/8 mice, but their atria did show focal areas of increased fibrosis (F). All micrographs were photographed with a ×20 lens.
To investigate the onset of atrial enlargement, young mice were sacrificed to evaluate heart morphology. Three ACE 8/8 mice examined at 3 days of age did not show visible cardiac morphology different from wild-type mice. Of 11 ACE 8/8 mice observed at 2 weeks of age, mild atria enlargement was occasionally noticed, but was never as prominent as in adult mice. By 3 weeks of age, six ACE 8/8 mice consistently showed the phenotype of atrial enlargement typical of adult ACE 8/8 mice. Thus, we believe that most ACE 8/8 mice develop clear atrial enlargement between 2 and 3 weeks of age. This time course of abnormal heart morphology was consistent with the onset of sudden death in that no spontaneous deaths were noted before 3 weeks of age.
Histological examination of several adult 8/8 hearts showed atrial enlargement but normal ventricular myocyte organization. No structural abnormality of cardiac valves was observed. Some investigators have suggested that angiotensin II can promote ventricular hypertrophy and fibrosis.10 To evaluate cardiac fibrosis, heart sections of ACE 8/8 mice were stained with picro-sirius red, which specifically identifies collagen. Picro-sirius red staining in the ventricles of ACE 8/8 mice was not noticeably increased compared to wild-type controls (Figure 8D). Focally, the atria of the ACE 8/8 mice did show more staining than wild-type atria (Figure 8F). However, fibrosis was not present in large amounts. Thus, ACE overexpression in the heart, associated with elevated levels of angiotensin II, had little effect on either ventricular size or the degree of ventricular fibrosis. In contrast, there was bilateral atrial enlargement with a mild, focal increase of fibrosis.
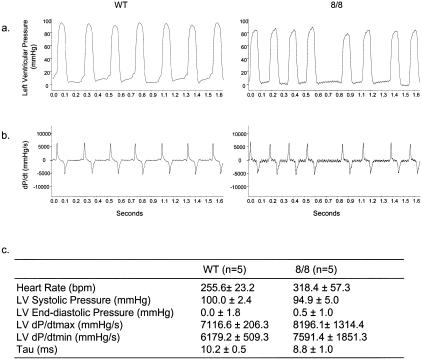
To evaluate the cardiac function of ACE 8/8 mice, we measured left ventricular function both by M-mode echocardiography and by in vivo hemodynamic studies. By echocardiography, all cardiac parameters for left ventricular function were comparable between ACE 8/8 mice and wild-type mice, except the posterior wall thickness, which was slightly thinner in the ACE 8/8 mice than in wild-type controls (Table 1). For in vivo hemodynamic studies, we measured left ventricular pressures using an ultra miniature, high fidelity Millar catheter inserted into the heart through the right carotid artery (Figure 9). LV systolic pressure, LV end-diastolic pressure, LV dP/dt max, LV dP/dt min, and τ (time constant for ventricular isovolumic relaxation) were computed from ventricular pressure wave forms. None of these parameters were significantly different between the two groups. These data suggest that, despite elevated levels of ACE and angiotensin II, the ventricular function of the ACE 8/8 mice was essentially normal and not the cause of the atrial enlargement.
Table 1.
Echocardiography Parameters of Left Ventricular Function
| WT (n = 8) | 8/8 (n = 6) | |
|---|---|---|
| EDD (mm) | 3.47 ± 0.13 | 3.45 ± 0.33 |
| ESD (mm) | 2.19 ± 0.29 | 2.31 ± 0.40 |
| IVS (mm) | 0.62 ± 0.09 | 0.62 ± 0.12 |
| PW (mm) | 0.61 ± 0.05 | 0.54 ± 0.04* |
| FS | 0.37 ± 0.07 | 0.33 ± 0.06 |
| LV mass (g) | 52.43 ± 12.89 | 44.09 ± 14.48 |
| BW (g) | 28.48 ± 4.27 | 27.55 ± 3.73 |
| RWT | 0.36 ± 0.04 | 0.34 ± 0.04 |
| LV\BW (mg/g) | 1.84 ± 0.35 | 1.59 ± 0.41 |
End-systolic dimension (EDD), end-diastolic dimension (ESD), interventricular septum thickness (IVS), posterior wall thickness (PW), fractional shortening (FS), left ventricular mass (LV mass), and relative wall thickness (RWT) were measured by M-mode echocardiography.
P < 0.05. all data are means ± SEM.
Figure 9.
In vivo hemodynamic measurements of the left ventricle. Left ventricular pressure was measured using a Millar microtip catheter inserted through the right carotid artery. a: Left ventricular pressure recordings from a wild-type (left) and an ACE 8/8 mouse (right). b: First-degree differential derived from the ventricular pressure wave forms, which is dP/dt. c: Hemodynamic parameters calculated from ventricular pressure recordings. Data are mean ± SEM. n, number of animals studied.
ACE 8/8 Mice Have AF, Low ECG Voltage, and Heart Block
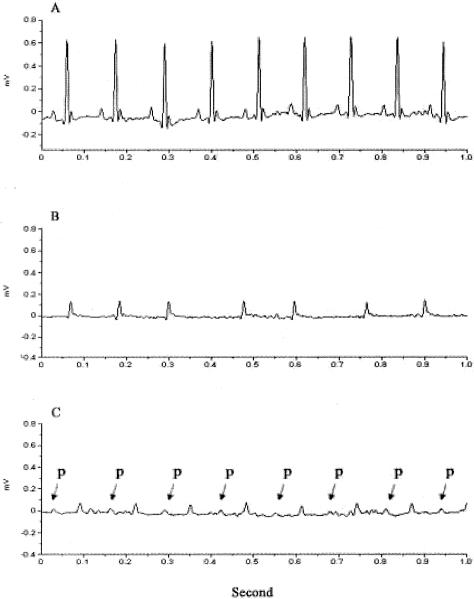
To further investigate a cause for sudden death, we used ambulatory ECG monitoring to study four wild-type mice and seven ACE 8/8 mice. After recovery from surgery, the four wild-type mice demonstrated a normal sinus rhythm with clearly identifiable P waves (Figure 10A). In contrast, all ACE 8/8 mice showed consistently low QRS voltages (Figure 10B). Six of the seven ACE 8/8 mice demonstrated no organized atrial activity and irregular RR intervals consistent with atrial fibrillation (AF). The sole ACE 8/8 mouse not in AF demonstrated a prolonged atrioventricular (AV) interval, suggesting of AV nodal dysfunction in this mouse (Figure 10C). The abnormal rhythm was not due to abnormal blood electrolyte levels as the blood sodium, potassium, and chloride were similar in ACE 8/8 and wild-type mice (data not shown). Two ACE 8/8 mice died during monitoring and the ECG showed a slow ventricular escape rhythm preceding death.
Figure 10.
Ambulatory ECG. ECG was recorded in wild-type and ACE 8/8 mice using telemetry. A: A representative ECG of a wild-type mouse showing normal sinus rhythm. B: A representative ECG from six analyzed ACE 8/8 mice showing low QRS voltage, no P wave, and irregular RR intervals. C: ECG of an ACE 8/8 mouse showing the presence of an atrial rhythm with prolonged AV block. Atrial P waves are labeled with arrows.
To further study ECG morphology and quantify the ECG signals, telemetry ECG data were analyzed using a signal averaging method. The reference tracing of all four wild-type mice showed clearly identifiable P, Q, R, S, and T waves. In contrast, the reference tracing of ACE 8/8 mice showed no P waves and low QRS and T wave voltages. The ACE 8/8 mice had a 2.3-fold reduction in QRS amplitude (P < 0.01, Table 2). QRS intervals were not changed in ACE 8/8 mice compared to wild-type mice. Similarly, R-R interval, QT interval, RT interval, and heart rate were not significantly different between the two groups.
Table 2.
Signal Averaging of Telemetry ECG Data
| WT (n = 4) | 8/8 (n = 7) | |
|---|---|---|
| R-Amp (mv) | 0.452 ± 0.145 | 0.197 ± 0.021* |
| QRS (ms) | 16.3 ± 0.5 | 16.1 ± 1.1 |
| RR (ms) | 103.3 ± 5.1 | 154.7 ± 63.4 |
| QT (ms) | 85.5 ± 4.4 | 78.3 ± 17.6 |
| RT (ms) | 54.3 ± 3.5 | 53.0 ± 14.2 |
| HR (bpm) | 582.9 ± 29.3 | 441.9 ± 168.2 |
Telemetry recordings of ECG data from 4 wild-type (WT) and 7 ACE 8/8 mice were averaged. R-Amp represents R wave amplitude. QRS, RR, QT, and RT represent the intervals of respective waves. HR represents heart rate.
p < 0.01. All data are means ± SEM.
Discussion
In recent years, the conceptualization of the renin-angiotensin system has expanded from just a circulating system generating plasma angiotensin II to a more complex picture where both systemic and local production of angiotensin II are thought to influence physiology. In the heart, published studies have suggested that locally produced angiotensin II may influence cardiac hypertrophy and fibrosis.10 In particular, the effect of ACE inhibitors in reducing cardiac hypertrophy in some rat models of hypertension correlates better with the reduction of local angiotensin II levels than the reduction of systemic pressure or plasma angiotensin II.24 Also, in vitro studies have suggested that angiotensin II stimulates cardiomyocyte growth and proliferation of cardiac fibroblasts.25,26 To investigate the functional role of angiotensin II produced within the heart, transgenic mice models were made that overexpressed components of the RAS within this organ. Such studies include the overexpression of angiotensinogen,11 ACE,12 angiotensin II peptide,17 or the angiotensin II AT1 receptor.14–16 These studies were not consistent in that some animal models developed ventricular hypertrophy or fibrosis, while other models showed no apparent pathology. In all these models, overexpression of the RAS in the heart accompanied a normal systemic distribution of ACE.
Our approach is quite different from that of previous models. By altering the endogenous ACE locus by targeted homologous recombination, we created a novel mouse model with elevated cardiac somatic ACE expression but reduced expression of somatic ACE in other organs. Apart perhaps from some foci of parenchymal ACE in the lung, ACE 8/8 mice have no endothelial expression of somatic ACE. The kidney, normally rich in ACE due to both endothelial and epithelial expression, is now totally devoid of this protein. Our hypothesis was that our approach would elevate angiotensin I and concentrate angiotensin II production in cardiac tissues. To a large degree, precisely this occurred. Renal angiotensin I was elevated and cardiac ACE produced cardiac levels of angiotensin II that were fourfold greater than normal. The phenotype of ACE 8/8 mice included a blood pressure that was only slightly less than normal and renal function identical to that of wild-type mice. So what do the ACE 8/8 mice tell us? First, echocardiography and in vivo hemodynamic studies (cardiac catheterization), did not reveal any major differences in ventricular function in the ACE 8/8 mice. Thus, the lack of ventricular hypertrophy or fibrosis indicates that a 100-fold increase of ventricular ACE and a fourfold elevation of angiotensin II are not, a priori, deleterious to ventricular function. Our data reflect animals maintained under basal conditions. However, there is still a possibility that cardiac angiotensin II may act synergistically with other factors under pathological conditions, such as hypertension, to cause deleterious effect in ventricles. Second, the systemic lack of endothelial ACE expression was not associated with a gross abnormality of blood pressure, indicating that the local production of ACE by endothelium is not obligatory for blood pressure control. A similar conclusion was reached in a previous mouse model we studied, termed ACE 1/3, in which ACE expression was predominantly restricted to the liver.27 Thus, it seems that the plasticity of the RAS (and the plasticity of overall blood pressure control) is such that an animal can adapt to pleomorphic expression patterns of ACE. Finally, we observed normal renal function in the ACE 8/8 mice, despite a complete absence of renal ACE. The ACE 8/8 mouse is the first animal model having no renal ACE expression, yet maintaining normal renal structure and function. In this model, the kidney does contain significant amounts of angiotensin II, and it follows that this peptide must originate from the circulation. These observations contrast with mice lacking all ACE who have both renal developmental defects and are unable to effectively concentrate urine.2,3 Thus, the generation of angiotensin II in tissue locations independent of the renal parenchyma appears capable of maintaining cardiovascular homeostasis, including normal renal function.
The two major pathologies in the ACE 8/8 mice were atrial enlargement and cardiac arrhythmia. In fact, the atrial enlargement with some atrial fibrosis may be the structural foundation of AF in these animals. While abnormal atrial morphology developed by 2 to 3 weeks in the ACE 8/8 mice, ventricular size was normal even after 4 months. The different response of the atria and ventricles is not a total surprise; as reflected by different gene expression profiles, atria and ventricle are not identical in their makeup, and presumably their response to injury.28 It will be of great interest to define the biochemical basis for the atrial response to increased angiotensin II.
The second very significant finding in the ACE 8/8 mice was the abnormal cardiac electrical activity. There was a high prevalence of AF in the ACE 8/8 mice. AF is the most common human cardiac arrhythmia affecting more than 5% of the population greater than 65 years of age. The prevalence of AF increases with age and is associated with a twofold increase in mortality in humans. A role of the RAS in AF has been suggested by various human studies demonstrating a beneficial effect of ACE inhibition on atrial remodeling and fibrillation.29–31 However, the biochemical explanation for these results is less developed. Our study of ACE 8/8 mice suggests that the RAS may directly participate in the pathogenesis of atrial dysfunction. The ECG abnormalities of these mice, including AF, a low QRS voltage, and some evidence of AV nodal dysfunction cannot be explained by reduced ventricular mass or cell count, alteration in serum electrolytes, the presence of pericardial effusion, or changes in the chest wall size or composition. While the physiological basis of the electrical abnormalities will be investigated in future studies, it appears that the ACE 8/8 mice will be a very interesting model to study the effects of angiotensin II and atrial enlargement on cardiac electrical activity.
We carefully screened for causes of sudden death in the ACE 8/8 mice. These mice showed no changes of appearance or behavior before death. No signs of cardiac failure, embolism, or bleeding were observed in sacrificed animals. It has been shown clinically that ACE inhibitors reduce the incidence of death from cardiac origins, perhaps in part by lowering blood pressure.32,33 However, many believe that the blood pressure lowering effect of ACE inhibitors does not account for all of the beneficial effects, as this class of pharmaceuticals appears to be more effective than other blood pressure lowering drugs in clinical trials. In recent years, a local RAS has been proposed to function in the heart. Our study adds some evidence to this idea in that the ACE 8/8 mice developed a cardiac phenotype independent of gross changes in blood pressure.
The phenotype of ACE 8/8 mice is different from some transgenic mouse models that overexpress RAS components. For example, we did not observe the ventricular hypertrophy or fibrosis, as reported by Paradis et al15 in cardiac overexpression of the AT1 receptor (by more than 200-fold). Here, cardiac dilatation and heart failure may reflect abnormal intracellular signaling as a function of the massive increase of these receptors. Other groups who overexpressed the AT1 receptor in the heart reported either no basal cardiac enlargement or atrial enlargement very similar to what we observed in the ACE 8/8 mice.14,16 Mazzolai et al11 overexpressed rat angiotensinogen in the hearts of transgenic mice. They found either normal or mildly enlarged hearts depending of the mouse strain (one or two renin genes), blood pressure, and age of the mice. However, even in those mice with enlarged hearts, Mazzolai et al11 reported no increase of cardiac fibrosis. Van Kats et al17 studied the effect of local cardiac angiotensin II production by directly expressing the peptide in cardiac tissue. This group found no effect on cardiac size until angiotensin II overexpression resulted in a systemic increase of blood pressure.
When compared to models that overexpress the AT1 receptor, ACE 8/8 mice are different in that cardiac angiotensin II may also activate the AT2 receptor, whose role in the myocardium is still unclear. Also, the increased ACE expression in ACE 8/8 mice may regulate the concentration of peptides other than angiotensin II, such as bradykinin and AcSDKP. Despite these concerns, our hypothesis is that angiotensin II is likely the main player for the ACE 8/8 phenotype. One approach to investigate this is to treat ACE 8/8 mice with pharmacological inhibitors of the renin-angiotensin system. However, due to the onset of the phenotype in ACE 8/8 mice before weaning, it has been difficult to achieve this through pharmacological means. Instead, we plan to take a genetic approach by breeding ACE 8/8 mice with angiotensinogen knockout mice, creating ACE 8/8 mice with only one functional angiotensinogen gene. This experiment, which is currently underway, should give rise to ACE 8/8 mice with low levels of circulating angiotensin I.
In summary, we created ACE 8/8 mice with cardiac-specific overexpression of ACE and as a consequence, overexpression of angiotensin II in the heart. These mice have a normal ventricular morphology and normal function as observed by ventricular catheterization. In contrast, they developed atrial enlargement by 2 to 3 weeks of age, cardiac arrhythmia, and an increased incidence of sudden death.
Acknowledgments
We thank Chad Haase, Louise McCann, Dr. David Harrison, Dr. W. Robert Taylor, Dr. Robert Santoianni, and Jonathan Adams for help with this study.
Footnotes
Address reprint requests to Kenneth E. Bernstein, M.D., Rm. 7107A WMB, 101 Woodruff Circle, Department of Pathology, Emory University, Atlanta, GA 30322. E-mail: kbernst@emory.edu.
Supported by National Institutes of Health grants DK39777, DK44280, DK51445, and DK55503, a research fellowship from the Georgia affiliate of the National Kidney Foundation (to H.D.X.), a postdoctoral fellowship from INSERM (to S.F.) and a Career Development Fellowship from the National Heart Foundation of Australia (CR 02M 0829 to D.J.C.).
References
- Corvol P, Williams TA, Soubrier F. Peptidyl dipeptidase A: angiotensin I-converting enzyme. Methods Enzymol. 1995;248:283–305. doi: 10.1016/0076-6879(95)48020-x. [DOI] [PubMed] [Google Scholar]
- Krege JH, John SW, Langenbach LL, Hodgin JB, Hagaman JR, Bachman ES, Jennette JC, O’Brien DA, Smithies O. Male-female differences in fertility and blood pressure in ACE-deficient mice. Nature. 1995;375:146–148. doi: 10.1038/375146a0. [DOI] [PubMed] [Google Scholar]
- Esther CR, Jr, Howard TE, Marino EM, Goddard JM, Capecchi MR, Bernstein KE. Mice lacking angiotensin-converting enzyme have low blood pressure, renal pathology, and reduced male fertility. Lab Invest. 1996;74:953–965. [PubMed] [Google Scholar]
- Hagaman JR, Moyer JS, Bachman ES, Sibony M, Magyar PL, Welch JE, Smithies O, Krege JH, O’Brien DA. Angiotensin-converting enzyme and male fertility. Proc Natl Acad Sci USA. 1998;95:2552–2557. doi: 10.1073/pnas.95.5.2552. [DOI] [PMC free article] [PubMed] [Google Scholar]
- Dzau VJ. Cell biology and genetics of angiotensin in cardiovascular disease. J Hypertens Suppl. 1994;12:S3–S10. [PubMed] [Google Scholar]
- Malik FS, Lavie CJ, Mehra MR, Milani RV, Re RN. Renin-angiotensin system: genes to bedside. Am Heart J. 1997;134:514–526. doi: 10.1016/s0002-8703(97)70089-9. [DOI] [PubMed] [Google Scholar]
- Garg R, Yusuf S. Overview of randomized trials of angiotensin-converting enzyme inhibitors on mortality and morbidity in patients with heart failure: Collaborative Group on ACE Inhibitor Trials. JAMA. 1995;273:1450–1456. [PubMed] [Google Scholar]
- Dostal DE, Baker KM. The cardiac renin-angiotensin system: conceptual, or a regulator of cardiac function? Circ Res. 1999;85:643–650. doi: 10.1161/01.res.85.7.643. [DOI] [PubMed] [Google Scholar]
- Neri Serneri GG, Boddi M, Coppo M, Chechi T, Zarone N, Moira M, Poggesi L, Margheri M, Simonetti I. Evidence for the existence of a functional cardiac renin-angiotensin system in humans. Circulation. 1996;94:1886–1893. doi: 10.1161/01.cir.94.8.1886. [DOI] [PubMed] [Google Scholar]
- Bader M. Role of the local renin-angiotensin system in cardiac damage: a mini-review focusing on transgenic animal models. J Mol Cell Cardiol. 2002;34:1455–1462. doi: 10.1006/jmcc.2002.2077. [DOI] [PubMed] [Google Scholar]
- Mazzolai L, Nussberger J, Aubert JF, Brunner DB, Gabbiani G, Brunner HR, Pedrazzini T. Blood pressure-independent cardiac hypertrophy induced by locally activated renin-angiotensin system. Hypertension. 1998;31:1324–1330. doi: 10.1161/01.hyp.31.6.1324. [DOI] [PubMed] [Google Scholar]
- Tian XL, Costerousse O, Urata H, Franz WM, Paul M. A new transgenic rat model overexpressing human angiotensin-converting enzyme in the heart. Hypertension. 1996;28:520. (Abstract) [Google Scholar]
- Higaki J, Aoki M, Morishita R, Kida I, Taniyama Y, Tomita N, Yamamoto K, Moriguchi A, Kaneda Y, Ogihara T. In vivo evidence of the importance of cardiac angiotensin-converting enzyme in the pathogenesis of cardiac hypertrophy. Arterioscler Thromb Vasc Biol. 2000;20:428–434. doi: 10.1161/01.atv.20.2.428. [DOI] [PubMed] [Google Scholar]
- Hein L, Stevens ME, Barsh GS, Pratt RE, Kobilka BK, Dzau VJ. Overexpression of angiotensin AT1 receptor transgene in the mouse myocardium produces a lethal phenotype associated with myocyte hyperplasia and heart block. Proc Natl Acad Sci USA. 1997;94:6391–6396. doi: 10.1073/pnas.94.12.6391. [DOI] [PMC free article] [PubMed] [Google Scholar]
- Paradis P, Dali-Youcef N, Paradis FW, Thibault G, Nemer M. Overexpression of angiotensin II type I receptor in cardiomyocytes induces cardiac hypertrophy and remodeling. Proc Natl Acad Sci USA. 2000;97:931–936. doi: 10.1073/pnas.97.2.931. [DOI] [PMC free article] [PubMed] [Google Scholar]
- Hoffmann S, Krause T, van Geel PP, Willenbrock R, Pagel I, Pinto YM, Buikema H, van Gilst WH, Lindschau C, Paul M, Inagami T, Ganten D, Urata H. Overexpression of the human angiotensin II type 1 receptor in the rat heart augments load induced cardiac hypertrophy. J Mol Med. 2001;79:601–608. doi: 10.1007/s001090100246. [DOI] [PubMed] [Google Scholar]
- van Kats JP, Methot D, Paradis P, Silversides DW, Reudelhuber TL. Use of a biological peptide pump to study chronic peptide hormone action in transgenic mice: direct and indirect effects of angiotensin II on the heart. J Biol Chem. 2001;276:44012–44017. doi: 10.1074/jbc.M106132200. [DOI] [PubMed] [Google Scholar]
- Cole J, Quach du L, Sundaram K, Corvol P, Capecchi MR, Bernstein KE. Mice lacking endothelial angiotensin-converting enzyme have a normal blood pressure. Circ Res. 2002;90:87–92. doi: 10.1161/hh0102.102360. [DOI] [PubMed] [Google Scholar]
- Langford KG, Shai SY, Howard TE, Kovac MJ, Overbeek PA, Bernstein KE. Transgenic mice demonstrate a testis-specific promoter for angiotensin-converting enzyme. J Biol Chem. 1991;266:15559–15562. [PubMed] [Google Scholar]
- Campbell D, Lawrence A, Kladis A, Duncan A-M. Strategies for measurement of angiotensin and bradykinin peptides and their metabolites in central nervous system and other tissues. Edited by Smith AI. Methods Neurosci. 1995;23:328–343. [Google Scholar]
- Sutliff RL, Haase C, Russ R, Hoit BD, Morris R, Norman AB, Lewis W. Cocaine increases mortality and cardiac mass in a murine transgenic model of acquired immune deficiency syndrome. Lab Invest. 2003;83:983–989. doi: 10.1097/01.lab.0000075555.93242.f2. [DOI] [PubMed] [Google Scholar]
- Bazett HC. An analysis of the time relations of electrocardiograms. Heart. 1920;7:353–370. [Google Scholar]
- Subramaniam A, Jones WK, Gulick J, Wert S, Neumann J, Robbins J. Tissue-specific regulation of the alpha-myosin heavy chain gene promoter in transgenic mice. J Biol Chem. 1991;266:24613–24620. [PubMed] [Google Scholar]
- Nagano M, Higaki J, Mikami H, Nakamaru M, Higashimori K, Katahira K, Tabuchi Y, Moriguchi A, Nakamura F, Ogihara T. Converting enzyme inhibitors regressed cardiac hypertrophy and reduced tissue angiotensin II in spontaneously hypertensive rats. J Hypertens. 1991;9:595–599. doi: 10.1097/00004872-199107000-00003. [DOI] [PubMed] [Google Scholar]
- Miyata S, Haneda T. Hypertrophic growth of cultured neonatal rat heart cells mediated by type 1 angiotensin II receptor. Am J Physiol. 1994;266:H2443–H2451. doi: 10.1152/ajpheart.1994.266.6.H2443. [DOI] [PubMed] [Google Scholar]
- Schorb W, Booz GW, Dostal DE, Conrad KM, Chang KC, Baker KM. Angiotensin II is mitogenic in neonatal rat cardiac fibroblasts. Circ Res. 1993;72:1245–1254. doi: 10.1161/01.res.72.6.1245. [DOI] [PubMed] [Google Scholar]
- Cole JM, Khokhlova N, Sutliff RL, Adams JW, Disher KM, Zhao H, Capecchi MR, Corvol P, Bernstein KE. Mice lacking endothelial ACE: normal blood pressure with elevated angiotensin II. Hypertension. 2003;41:313–321. doi: 10.1161/01.hyp.0000050650.52007.83. [DOI] [PubMed] [Google Scholar]
- Zhao XS, Gallardo TD, Lin L, Schageman JJ, Shohet RV. Transcriptional mapping and genomic analysis of the cardiac atria and ventricles. Physiol Genomics. 2002;12:53–60. doi: 10.1152/physiolgenomics.00086.2002. [DOI] [PubMed] [Google Scholar]
- Van Den Berg MP, Crijns HJ, Van Veldhuisen DJ, Griep N, De Kam PJ, Lie KI. Effects of lisinopril in patients with heart failure and chronic atrial fibrillation. J Card Fail. 1995;1:355–363. doi: 10.1016/s1071-9164(05)80004-1. [DOI] [PubMed] [Google Scholar]
- Pedersen OD, Bagger H, Kober L, Torp-Pedersen C. Trandolapril reduces the incidence of atrial fibrillation after acute myocardial infarction in patients with left ventricular dysfunction. Circulation. 1999;100:376–380. doi: 10.1161/01.cir.100.4.376. [DOI] [PubMed] [Google Scholar]
- Vermes E, Tardif JC, Bourassa MG, Racine N, Levesque S, White M, Guerra PG, Ducharme A. Enalapril decreases the incidence of atrial fibrillation in patients with left ventricular dysfunction: insight from the Studies Of Left Ventricular Dysfunction (SOLVD) trials. Circulation. 2003;107:2926–2931. doi: 10.1161/01.CIR.0000072793.81076.D4. [DOI] [PubMed] [Google Scholar]
- Yusuf S, Sleight P, Pogue J, Bosch J, Davies R, Dagenais G. Effects of an angiotensin-converting-enzyme inhibitor, ramipril, on cardiovascular events in high-risk patients: The Heart Outcomes Prevention Evaluation Study Investigators. N Engl J Med. 2000;342:145–153. doi: 10.1056/NEJM200001203420301. [DOI] [PubMed] [Google Scholar]
- The CONSENSUS Trial Study Group Effects of enalapril on mortality in severe congestive heart failure: results of the Cooperative North Scandinavian Enalapril Survival Study (CONSENSUS). N Engl J Med. 1987;316:1429–1435. doi: 10.1056/NEJM198706043162301. [DOI] [PubMed] [Google Scholar]


