Abstract
Urinary excretion of human liver-type fatty acid-binding protein (hL-FABP), which is expressed in human proximal tubules and engaged in free fatty acid (FFA) metabolism, was reported to reflect the clinical prognosis of chronic kidney disease. Here we have investigated the pathophysiological significance of hL-FABP in a model of protein overload nephropathy. Because L-FABP is not expressed in the wild-type mice, we generated hL-FABP chromosomal gene transgenic (Tg) mice. Tg mice were intraperitoneally injected with bovine serum albumin (BSA) replete with FFAs (r-BSA group) or FFA-depleted BSA (d-BSA group). The r-BSA group developed significantly more severe tubulointerstitial damage than did the d-BSA group. Renal expression of the hL-FABP gene was more up-regulated, and urinary excretion of hL-FABP was significantly higher, in the r-BSA group than in the d-BSA group. Furthermore, compared with their wild-type littermates injected with r-BSA, the number of infiltrated macrophages was significantly attenuated in Tg mice injected with it on day 28. In patients with kidney disease (n = 50), urinary hL-FABP was correlated with both urinary protein and the severity of tubulointerstitial injury. In conclusion, our experimental model suggests that urinary excretion of hL-FABP reflects stresses, such as urinary protein overload, on the proximal tubules. The clinical observations support this hypothesis.
The extent of tubulointerstitial damage has been found to be correlated more with the prognosis of chronic kidney disease than is the degree of glomerular injury.1–8 Accumulating evidence has shown that urinary protein may cause tubulointerstitial damage and play a contributory role in the progression of kidney disease.1,2,9–12 However, the mechanisms by which urinary protein provokes tubulointerstitial damage are not clear.
Free fatty acids (FFAs) are bound to albumin,13 filtered through the glomeruli, and reabsorbed into the proximal tubules.14 FFAs bound to albumin, therefore, might play a role in the development of tubulointerstitial damage. We recently found, by using a model of protein overload, that FFAs bound to albumin13 play some role in the progression of tubulointerstitial disease.15 In massive proteinuria, FFAs are overloaded on the proximal tubules and induce inflammatory factors such as macrophage chemotactic factors,16,17 which in turn cause tubulointerstitial damage.15,18–22
FFAs loaded on the proximal tubules are bound to cytoplasmic fatty acid-binding protein (FABP) and transported to mitochondria or peroxisomes,23,24 where they are metabolized by β-oxidization. In human proximal tubules, the liver-type FABP (L-FABP) of 14 kd is expressed.25 Although the physiological role of L-FABP has not been completely elucidated, L-FABP might be a key regulator of fatty acid homeostasis in the cytoplasm.20,26
We developed specific monoclonal antibodies against human L-FABP (hL-FABP) and established an enzyme-linked immunosorbent assay (ELISA) for measuring urinary excretion of hL-FABP. In clinical examination of chronic kidney disease, we found that urinary hL-FABP was a clinical marker for progression of kidney disease: higher urinary hL-FABP may suggest higher incidence of progression of kidney disease.27 From the results, we hypothesize that FFAs bound to albumin, which causes severe tubulointerstitial damage, up-regulates hL-FABP gene expression in the proximal tubule, and accelerates excretion of hL-FABP into urine.
Because L-FABP is not expressed in the kidneys of rodents and renal hL-FABP has not been investigated under the pathophysiological condition yet, we generated hL-FABP chromosomal transgenic (Tg) mice and have examined the pathophysiological significance of hL-FABP in an experimental model of protein overload. In addition, we have investigated the relationship between urinary hL-FABP and various clinical parameters, and tubulointerstitial damage in patients with kidney disease.
Materials and Methods
Established Human L-FABP Chromosomal Tg Mice
Initially, Tg mice for hL-FABP were generated (patent no. WO0073791). In brief, the genomic DNA of hL-FABP including its promoter region (13 kb) was microinjected into fertilized eggs obtained from BALB/c and CBA mice. ICR mice were used as the recipients for the transfected eggs. The resultant Tg mice were backcrossed for six generations onto BALB/c mice to obtain homozygous mutant mice on an inbred background. Only female mice were used. The integration of the hL-FABP gene into the mice genome was examined by genomic polymerase chain reaction and the expression of hL-FABP in the proximal tubules of the Tg mice was examined by Northern blot analysis, Western blot analysis, and immunohistochemistry, as described below (patent no. WO0073791). To confirm the distribution of hL-FABP expression in the Tg mice, the protein was extracted from the brain, lung, heart, spleen, liver, intestine, or kidney of the Tg mice and the content of hL-FABP in each tissue was measured by ELISA, as described below.
Experimental Design 1
Experiments were performed with the Tg mice on a BALB/c background, and 12-week-old female Tg mice (n = 39) were used for this study (body weight, 21 ± 0.4 g; mean ± SE). The mice were divided into three groups: the r-BSA (bovine serum albumin) group (n = 12) received a once-daily intraperitoneal injection of lipid-replete BSA (250 mg/mouse, dissolved in 1 ml saline) (BSA fraction V, catalog no. A4503; Sigma Chemical Corp., St. Louis, MO); the d-BSA group (n = 14) received lipid-depleted BSA (prepared from BSA fraction V, catalog no. A-6003; Sigma); and the saline group (n = 13) received an equivalent volume of sterile normal saline as control. The content of long-chain fatty acids in r-BSA and d-BSA has been previously shown.15 Mice were individually housed in metabolic cages with free access to tap water, and urine was collected on days 0, 7, 14, 21, and 28. The sediment was removed from the urine samples by centrifugation (12,000 rpm for 5 minutes).
Groups of animals were sacrificed on day 7 (n = 3 for r-BSA, n = 3 for d-BSA, and n = 3 for saline), on day 14 (n = 4 for r-BSA, n = 4 for d-BSA, and n = 3 for saline) and on day 28 (n = 5 for r-BSA, n = 7 for d-BSA, and n = 7 for saline), as previously described.15 In brief, under intraperitoneal anesthesia, a polyethylene catheter (PE-10) was retrogradely inserted into the abdominal aorta. The pedicle of the left kidney was ligated and the kidney was removed and snap-frozen in liquid nitrogen for Northern blot analysis and Western blot analysis. The right kidney was fixed with 10% formalin (WAKO Pure Chemical Industries, Ltd., Osaka, Japan), first by perfusion and then by immersion for 24 hours. The right kidney was divided into two for light microscopy analysis. Plasma was obtained by exsanguination through the abdominal great vein before perfusion on days 7, 14, and 28.
Experimental Design 2
To investigate the role of hL-FABP in proteinuric kidney disease, the Tg mice and their wild-type (WT) littermates on a BALB/c background were simultaneously injected with r-BSA, which caused severe tubulointerstitial damage, and the degree of kidney damage was compared between them. Fourteen-week-old female Tg mice (n = 15; body weight, 22 ± 0.2 g; mean ± SE) and 14-week-old female WT mice were used (n = 15; body weight, 22 ± 0.3 g; mean ± SE). Both the Tg and the WT mice were divided into two groups each: the r-BSA group (n = 10 for Tg mice and n = 10 for WT mice) received a once-daily intraperitoneal injection of r-BSA (250 mg/mouse, dissolved in 1 ml saline) and the saline group (n = 5 for Tg mice and n = 5 for WT mice) received an equivalent volume of sterile normal saline as control. Their urine was collected on days 0, 7, 14, 21, and 28 using the metabolic cages. Groups of animals were sacrificed on day 14 (n = 5 for r-BSA in Tg mice, n = 5 for r-BSA in WT mice) and on day 28 (n = 5 for r-BSA and n = 5 for saline in Tg mice, n = 5 for r-BSA and n = 5 for saline in WT mice), as described above.
Serum Biochemistry
Serum urea nitrogen, total cholesterol, and triglyceride were measured by enzymatic methods, and total protein was measured by the Biuret method at the SRL Co. Research Service, Tokyo, Japan.15
Urinary Biochemistry
Levels of urinary BSA and mouse albumin were quantified by using commercially available kits (a BSA ELISA kit and a mouse albumin ELISA kit; Exocell Inc., Philadelphia, PA) and a spectrophotometer (MicroReader 4, Hyperion Inc., AL, USA). The level of urinary creatinine (cre) was quantified by using a commercially available kit (cre ELISA kit; Exocell Inc.) and a spectrophotometer (MicroReader 4). Urinary BSA and urinary mouse albumin were expressed as ratios of urinary BSA (mg) to urinary cre (mg), and urinary mouse albumin (mg) to urinary cre (mg), respectively.
Renal Histological and Morphometric Analysis
For light microscopy analysis, the kidney was dehydrated and embedded in paraffin. Serial sections (1 μm thick) were obtained for conventional histological assessment [hematoxylin and eosin staining or periodic acid-Schiff (PAS) staining] and immunohistochemistry.
The PAS-stained tissue sections were used to evaluate tubulointerstitial injury, which was categorized as tubular dilatation, tubular atrophy, or tubular hyaline cast formation. Under ×200 magnification, 20 nonoverlapping fields from the cortical region were selected, and the area of tubulointerstitial damage and the whole cortical area were measured by using a computer-aided video manipulator (Hamamatsu-Photonics Co., Hamamatsu, Japan). Tubulointerstitial damage was defined as the ratio of the area of tubulointerstitial damage to the entire cortical area, as previously described.15 Glomerulosclerosis was indicated by the disappearance of cellular elements from the capillary tuft, capillary loop collapse, or the folding of the glomerular basement membrane with an accumulation of amorphous material. The grade of sclerosis in each glomerulus was defined as follows: 0, if there was no sclerosis; I, if 1 to 25% of the glomerular area was affected by sclerosis; II, if 26 to 50% of the glomerular area was affected; III, if 51 to 75% of the glomerular area was affected; IV, if 76 to 100% of the glomerular area was affected, as previously described.15 The glomerulosclerosis score for each animal was calculated as: [1× the number of grade I glomeruli (%) + (2× one of grade II glomeruli (%) + (3× one of grade III glomeruli (%) + (4× one of grade IV glomeruli (%)]. These histological evaluations were performed in a blinded manner by one observer.
Immunohistochemical Examination
Immunohistochemistry was performed with a monoclonal antibody against mouse macrophages (rat anti-mouse F4/80 antibody; Medical and Biological Laboratories Co., Ltd., Nagoya, Japan) and a monoclonal antibody against human L-FABP (mouse anti-human L-FABP antibody generated in this study, as described below) based on the labeled streptavidin biotin kit (DAKO Co., Tokyo, Japan). hL-FABP immunostaining in the kidneys of the mice was performed with a monoclonal antibody against human L-FABP, FABP-2, and that in the human renal biopsy specimens performed with FABP-1, as described below. A negative control without the primary antibody showed no staining. The degree of macrophage infiltration in the cortical interstitium was measured as the average number of F4/80-positive cells per field at ×200 magnification, as previously described.15
Northern Blot Analysis of L-FABP
Total cellular RNA was extracted from a half kidney by using ISOGEN reagent (Nihon gene Co. Tokyo, Japan) in accordance with the manufacturer’s instructions. Denatured kidney RNA (10 μg) was fractionated on formaldehyde-agarose gels, transferred onto nitrocellulose membranes (Amersham Int., Buckinghamshire, UK). The intensity of the bands corresponding to hL-FABP transcripts was estimated by using a Bioimage analyzer (BSA 2000; Fuji Film, Tokyo, Japan), and the ratio of the intensity of hL-FABP transcripts to that of GAPDH was used to normalize the amount of hL-FABP transcripts. The hL-FABP cDNA probe was prepared by polymerase chain reaction and labeled with 32P-dCTP (3000 Ci/mmol) by using a DNA random-labeling method (Takara Shuzo, Kyoto, Japan). The primer sequences were as follows. hL-FABP: sense, ATGAGTTTCTCCGGCAAG and anti-sense, TGAAATGCAGACTTG; GAPDH: sense, CATCATCTCTGCCCCCTCTG and anti-sense, CCACCACCCTGTTGCTGTAG.
Generation of Monoclonal Antibodies Specific for hL-FABP
Monoclonal antibodies, FABP-1, FABP-2, and FABP-L, were obtained from BALB/c mice immunized with the purified recombinant hL-FABP, prepared by using a fusion plasmid system (pMAL-cRI),28 as described previously.27
Western Blot Analysis of L-FABP
To examine the cross-reaction of FABP-1, FABP-2, or FABP-L to human intestine FABP (hI-FABP), human ileal bile acid-binding protein (hI-BABP), human epithelial FABP (hE-FABP), human heart FABP (hH-FABP), and endogenous mouse L-FABP, Western blot analysis was performed with the recombinant hI-FABP,29 the recombinant hI-BABP,29 the human cardiac muscle, the human skin, the recombinant hL-FABP, and the liver of the WT mice.
Each tissue was homogenized in homogenization buffer (10 mmol/L PB, 1 mmol/L PMSF, 2 μg/ml leupeptin, 2 μg/ml chymostatin, 0.2% Triton X-100, Sigma) for protein extraction. The recombinant hI-FABP (0.1 μg/lane), the recombinant hI-BABP (0.1 μg/lane), the recombinant hL-FABP (0.1 μg/lane), 125 μg of total protein in the human cardiac muscle, 45 μg of total protein in the human skin, and 2.5 μg of total protein in the liver of the WT mice were electrophoresced into a 4 to 12% gradient Bis-Tris acrylamide gel (Bio-Rad, Richmond, CA). Rabbit polyclonal antibodies against hI-FABP,29 hI-BABP,29 or hE-FABP29 and mouse monoclonal antibodies against hL-FABP (FABP-1, FABP-2, and FABP-L) were used as primary antibodies. Monoclonal antibody against hH-FABP was purchased from Dainippon Pharmaceutical Co., Ltd., Osaka, Japan.
To further confirm whether endogenous mouse L-FABP was induced by r-BSA injection in the kidney of the WT mice, the protein was extracted from the kidneys of both the Tg and the WT mice injected with r-BSA or saline and 10 μg of total protein was electrophoresced, as described above. FABP-2 was used as a primary antibody. The positive bands were visualized with a POD immunostain set (WAKO).
Establishment of ELISA for Urinary hL-FABP
This ELISA method for measuring urinary hL-FABP was described previously.27 Monoclonal antibodies against hL-FABP were used both FABP-2 and FABP-L. In brief, 96-well microtiter plates were coated with 10 mg/L of FABP-2 monoclonal antibodies and incubated overnight. Unreacted sites were blocked with PBS containing 10 g/L BSA (Sigma) overnight. One hundred μl of appropriately diluted standards or samples were incubated in the wells of each plate at room temperature for 1 hour. The plates were allowed to react with 100 μl of horseradish peroxidase-conjugated FABP-L for 1 hour. Absorbance was measured at 492 nm on a microplate reader (MicroReader 4). Urinary hL-FABP was expressed as a ratio of urinary hL-FABP (μg) to urinary cre (mg).
Clinical Study
Study Participants
Fifty individuals, who were admitted to the hospital of St. Marianna University School of Medicine for diagnosis by renal biopsy and treatment of kidney disease from September 2002 to March 2003 were recruited for this study (Table 1). The study was conducted under written informed consent and approved by the ethical committee for human research at the St. Marianna University School of Medicine.
Table 1.
Clinical Data of Patients*
| Variable | Mean ± SE |
|---|---|
| Age (year) | 46 ± 2.4 |
| Sex [no. of patients (%)] | |
| Male | 22 (44%) |
| Female | 28 (56%) |
| Mean blood pressure (mmHg) | 96.5 ± 2.8 |
| Creatinine clearance (ml/min) | 63.3 ± 5.3 |
| Total cholesterol (mg/dl) | 253 ± 18 |
| Urinary protein (g/g. cre.) | 2.3 ± 0.5 |
| Urinary NAG (IU/g. cre.) | 11.2 ± 1.2 |
| Urinary hL-FABP (μg/g. cre.) | 111.7 ± 32.1 |
| Diagnosis of renal biopsy | |
| Minor glomerular abnormalities | 4 |
| Minimal change nephritic syndrome | 5 |
| Mesangial proliferative glomerulonephritis | 13 |
| Focal segmental glomerulosclerosis | 3 |
| Membranous nephropathy | 4 |
| Nephrosclerosis | 6 |
| Diabetic nephropathy | 5 |
| Lupus nephritis | 7 |
| Anti-neutrophil cytoplasmic antibody related nephritis | 3 |
A total of 50 patients were assessed.
Clinical Parameters of Serum and Ambulatory Spot Urine
Cre and total cholesterol were measured in serum samples, and hL-FABP, cre, total protein, and N-acetyl-β-d-glucosaminidase (NAG) were measured in spot urine samples. Creatinine clearance (Ccr) was calculated by 24-hour urine collection. Serum cre, urinary cre, and serum total cholesterol were measured by enzymatic methods, urinary protein by the pyrogallol red-molybdate complex method, and urinary NAG by using chlorophenol red-N-acetylglucosaminide (CPR-NAG) as a substrate. Urinary excretion of hL-FABP was measured as described above.
Relationship between Tubulointerstitial Damage and Urinary L-FABP
Renal tissue obtained from renal biopsies was used to quantify tubulointerstitial damage, which was evaluated as described in the mouse experiment. The patients were divided into three groups according to the degree of tubulointerstitial damage as follows: mild group (n = 29), <10% of the tubulointerstitial region injured; moderate group (n = 12), <50% of the tubulointerstitial region injured; severe group (n = 9), ≥50% of the tubulointerstitial region injured.
Statistical Analysis
All values are expressed as the mean ± SE. Differences among the three groups were analyzed by the Kruskal-Wallis test, followed by Scheffé’s multiple comparison procedure. The correlation between two logarithmic values of clinical parameters including urinary hL-FABP was assessed by Pearson’s correlation. The correlation between urinary L-FABP and the area ratio of tubulointerstitial damage was assessed by Spearman’s rank correlation. These statistical analyses were performed with a computer software program for the Macintosh Power Book G3 (Stat View 5.0; SAS Institute Inc., Cary, NC). P values of less than 0.05 were considered to be significant.
Results
Establishment of Tg Mice
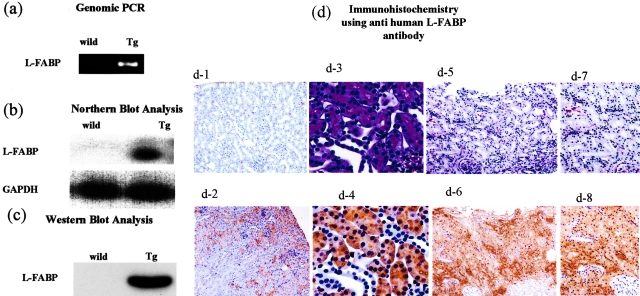
The integration of the hL-FABP gene into the mice genome was confirmed by genomic polymerase chain reaction, and the expression of hL-FABP in the proximal tubules of Tg mice was shown by Northern blot analysis, Western blot analysis, and immunohistochemistry (Figure 1).
Figure 1-4250.
Generation of hL-FABP chromosomal gene Tg mice. a: Integration of the hL-FABP gene into the mice genome was confirmed by genomic polymerase chain reaction. b and c: The expression of hL-FABP in mouse kidney was verified by Northern (b) and Western (c) blot analysis. d: The expression of hL-FABP in mouse proximal tubules was observed by immunohistochemistry with monoclonal antibodies specific for hL-FABP, FABP-2. Representative photomicrographs show renal hL-FABP immunostaining in the kidney of a WT (d-1) and a Tg (d-2) mouse; PAS-stained sections in the kidney of a Tg mouse (d-3); and hL-FABP immunostaining in the kidney of a Tg mouse (d-4). In d-5 and d-6, human renal biopsy specimens obtained from a patient with minor glomerular abnormalities whose urinary occult blood was positive and urinary protein was negative were subjected to PAS staining (d-5, d-7) and hL-FABP immunostaining with monoclonal antibodies specific for hL-FABP, FABP-1 (d-6, d-8). The photomicrographs in d-3 to d-4, in d-5 to d-6, and in d-7 to d-8 are serial sections. hL-FABP was expressed diffusely throughout the proximal tubules, which have brush borders (d-3), in the Tg (d-4) but not in the WT (d-1) mouse. The localization of hL-FABP in the Tg mice (d-4) was similar to that in the human renal biopsy specimens (d-6 and d-8). Original magnifications: ×40 (d-1, d-2, d-5, d-6); ×200 (d-3, d-4); ×100 (d-7, d-8).
The Tg mice did not show any obvious abnormalities in appearance and behavior. In the Tg mouse, hL-FABP was detected in the protein extracted from the kidney, liver, and intestine by ELISA (117.9, 275.9, and 298.7 ng/20 μg protein/ml, respectively), but not in that from the lung, brain, spleen, and heart. In the WT mouse, hL-FABP was not detected in those tissues. The distribution of hL-FABP expression in the Tg mice was considered in the kidney, liver, and intestine.
Urinary Biochemistry
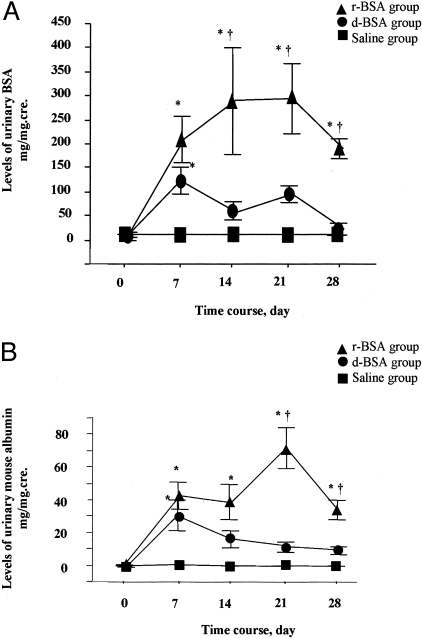
The Tg mice overloaded with r-BSA and d-BSA showed almost the same high levels of urinary BSA on day 7 (214 ± 47 mg protein/mg cre and 123 ± 27 mg protein/mg cre, respectively) (Figure 2a). Thereafter, urinary BSA levels differed significantly (P < 0.05), remaining high in the r-BSA group (293 ± 110 mg/mg cre, 297 ± 72 mg/mg cre, and 193 ± 20 mg/mg cre on days 14, 21, and 28, respectively) and decreasing in the d-BSA group (58 ± 19 mg/mg cre, 95 ± 17 mg/mg cre, and 24 ± 13 mg/mg cre on days 14, 21, and 28, respectively).
Figure 2-4250.
Levels of total urinary protein and urinary mouse albumin in Tg mice. A: Levels of total urinary protein expressed as a ratio of total urinary protein to urinary creatinine (mg/mg.cre), mean ± SE. B: Levels of urinary mouse albumin expressed as a ratio of urinary mouse albumin to urinary creatinine (mg/mg.cre), mean ± SE. *, P < 0.05 compared to the saline group; †, P < 0.05 compared to the d-BSA group.
Urinary mouse albumin showed the same pattern as total urinary protein and showed similar levels in the r-BSA and the d-BSA groups on day 7 (42 ± 8 mg albumin/mg cre and 31 ± 9 mg albumin/mg cre, respectively) (Figure 2b). Thereafter, urinary mouse albumin remained at a high level in the r-BSA group (38 ± 11 mg/mg cre, 71 ± 13 mg/mg cre, and 33 ± 6 mg/mg cre on days 14, 21, and 28, respectively), but decreased in the d-BSA group (17 ± 5 mg/mg cre, 12 ± 3 mg/mg cre, and 10 ± 2 mg/mg cre on days 14, 21, and 28, respectively). On days 21 and 28, urinary mouse albumin was significantly higher in the r-BSA group than in the d-BSA or the saline group (P < 0.005).
Serum Biochemistry
In the Tg mice, the level of total serum protein in the r-BSA and the d-BSA groups was significantly higher than that in the saline group on days 7 and 14 (Table 2). On day 28, total protein in the r-BSA group had decreased to a level similar to that in the saline group, whereas total protein in the d-BSA group remained high.
Table 2.
Renal Function, Total Serum Protein, and Serum Lipid in the r-BSA, d-BSA, and Saline Groups on Days 7, 14, and 28
| SUN, mg/dL |
Total protein, g/dL |
Total cholesterol, mg/dL |
Triglyceride, mg/dL |
|||||||||
|---|---|---|---|---|---|---|---|---|---|---|---|---|
| Day 7 | Day 14 | Day 28 | Day 7 | Day 14 | Day 28 | Day 7 | Day 14 | Day 28 | Day 7 | Day 14 | Day 28 | |
| r-BSA | 33 ± 2 | 41 ± 2 | 45 ± 8 | 6.4 ± 0.2* | 6.6 ± 0.2* | 6.0 ± 0.4 | 123 ± 14† | 135 ± 6*† | 155 ± 23*† | 131 ± 9 | 102 ± 12 | 152 ± 14*† |
| d-BSA | 26 ± 4 | 44 ± 3 | 39 ± 3 | 5.9 ± 0.4* | 7.2 ± 0.4* | 7.1 ± 0.3* | 79 ± 2 | 93 ± 10 | 61 ± 5 | 119 ± 30 | 81 ± 22 | 79 ± 12 |
| Saline | 29 ± 2 | 37 ± 2 | 32 ± 1 | 4.4 ± 0.0 | 5.0 ± 0.0 | 4.9 ± 0.2 | 94 ± 1 | 98 ± 3 | 98 ± 5 | 80 ± 12 | 65 ± 8 | 92 ± 10 |
P < 0.05 compared to the saline group;
, P < 0.05 compared to the d-BSA group. Values are the mean ± SE.
Total cholesterol was significantly higher in the r-BSA group than in the d-BSA group on days 7, 14, and 28, and triglyceride was significantly higher in the r-BSA group than in either the d-BSA or the saline group on day 28. The concentration of serum urea nitrogen did not differ significantly among the three groups.
Renal Histological and Immunohistochemical Evaluation
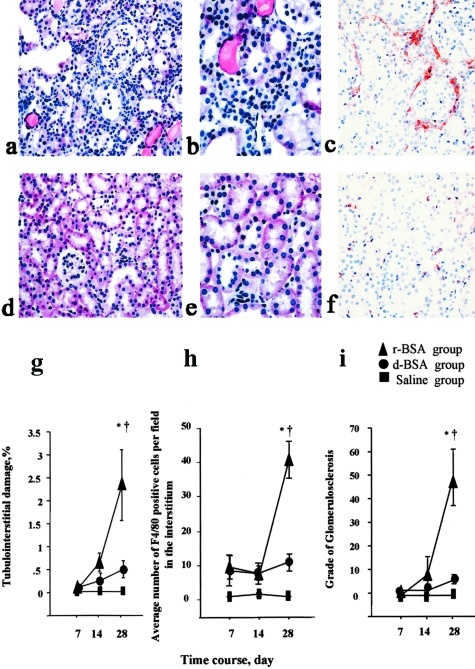
In the Tg mice, proximal tubular dilatation and tubular hyaline cast formation in the interstitium were more prominent in the r-BSA group (Figure 3, a and b) than in the d-BSA group (Figure 3, d and e) on day 28. The area of the tubulointerstitial damage was significantly greater in the r-BSA group than in either the d-BSA or the saline group on day 28 (P < 0.0005) (Figure 3g). The damaged area was not significantly greater in the d-BSA group than in the saline group on days 7, 14, and 28. Glomerulosclerosis was not observed in any group on days 7 and 14, but was more prominent in the r-BSA group than in the other two groups on day 28 (Figure 3i).
Figure 3-4250.
Histological evaluation of tubulointerstitial change and renal F4/80 immunostaining in mice with BSA-overload-induced proteinuria in Tg mice (day 28). Representative photomicrographs of PAS-stained sections from mice in the r-BSA (a, b) and d-BSA (d, e) groups, and renal F4/80 immunostaining in the kidney of mice in the r-BSA (c) and d-BSA (f) groups. F4/80 was expressed in the interstitium in both the r-BSA and the d-BSA groups. The tubulointerstitial damage (g), the number of F4/80-positive cells that had infiltrated the interstitium (h), and the glomerular injury (i) were semiquantified as described in Materials and Methods; values are the mean ± SE. *, P < 0.05 compared to the saline group; †, P < 0.05 compared to the d-BSA group. Original magnifications: ×100 (a, d); ×400 (b, e); ×200 (c, f).
Macrophages were observed to have infiltrated the interstitium in both the r-BSA and the d-BSA groups when first examined on day 7. On day 14, the number of infiltrated macrophages was higher in the r-BSA group than in the d-BSA group, but the difference was not significant. On day 28, however, this number was significantly higher in the r-BSA group (Figure 3c) than in the d-BSA (Figure 3f) or the saline group (41.3 ± 5.3, 10.9 ± 2.5, and 0.1 ± 0.0 in the r-BSA, d-BSA, and saline groups, respectively; P < 0.0001) (Figure 3h).
Effect of hL-FABP Expression on the Tubulointerstitial Injury
The body weight of Tg mice (g) used for the present study did not differ significantly from that of their WT littermates (g).
Urinary Parameters
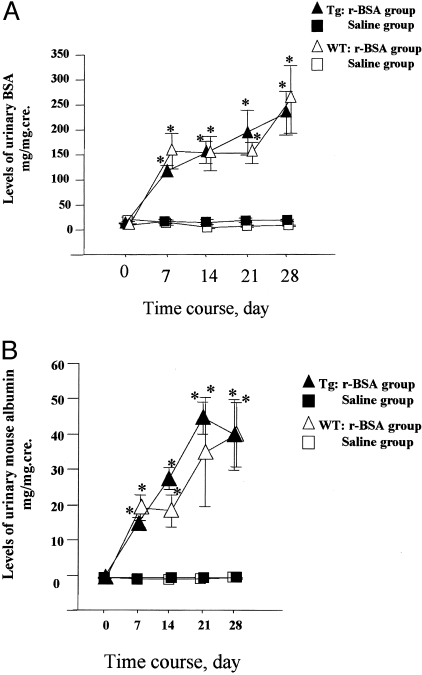
Both urinary BSA and urinary mouse albumin were not significantly different between the Tg and the WT mice during the experimental periods (Figure 4, a and b).
Figure 4-4250.
Levels of total urinary protein and urinary mouse albumin in Tg and WT mice. A: Levels of total urinary protein expressed as a ratio of total urinary protein to urinary creatinine (mg/mg.cre), mean ± SE. B: Levels of urinary mouse albumin expressed as a ratio of urinary mouse albumin to urinary creatinine (mg/mg.cre), mean ± SE. *, P < 0.05 compared to the saline group.
Serum Biochemistry
In both the Tg and the WT mice, the level of total serum protein in the r-BSA group was significantly higher than that in the saline group on day 14 (Table 3). On day 28, total protein in the r-BSA group was higher than that in the saline group, but not significantly in both the Tg and the WT mice. Total cholesterol and triglyceride of the r-BSA group in the Tg mice were higher than that in the WT mice, but not significantly.
Table 3.
Renal Function, Total Serum Protein, and Serum Lipid in the r-BSA and Saline Groups of Tg Mice and WT Mice on Days 14 and 28
| Tg mice |
WT mice |
|||||
|---|---|---|---|---|---|---|
| r-BSA group | Saline group | r-BSA group | Saline group | |||
| Day 14 | Day 28 | Day 28 | Day 14 | Day 28 | Day 28 | |
| SUN (mg/dL) | 43 ± 5 | 37 ± 2 | 27 ± 1 | 36 ± 2* | 44 ± 5* | 24 ± 1 |
| Total protein (g/dL) | 7.0 ± 0.9* | 6.5 ± 0.4 | 4.9 ± 0.1 | 7.0 ± 0.3* | 6.4 ± 0.4 | 4.9 ± 0.2 |
| Total cholesterol (mg/dL) | 122 ± 17 | 110 ± 8 | 87 ± 4 | 94 ± 7 | 109 ± 18 | 85 ± 4 |
| Triglyceride (mg/dL) | 107 ± 29 | 104 ± 24 | 74 ± 8 | 76 ± 7 | 112 ± 28 | 62 ± 5 |
P < 0.05 compared to the saline group.
The concentration of serum urea nitrogen in the Tg mice did not differ significantly between the r-BSA and the saline groups. In the WT mice, that of the r-BSA group increased significantly more than that of the saline group on days 14 and 28. However, that in the Tg mice was similar to that in the WT mice.
Renal Histological and Immunohistochemical Evaluation
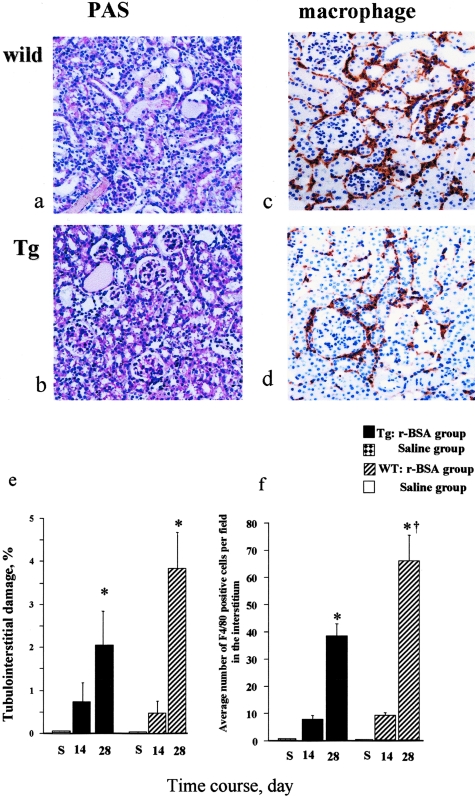
In both the WT (Figure 5a) and the Tg mice (Figure 5b), the area of the tubulointerstitial damage was significantly greater in the r-BSA group than in the saline group on day 28 (Figure 5e). The damaged area in the Tg mice was similar to that in the WT mice on day 14, and was smaller than that in the WT mice, but not significantly on day 28.
Figure 5-4250.
Histological evaluation of tubulointerstitial change and renal F4/80 immunostaining in mice with BSA overload-induced proteinuria in Tg and WT mice (day 28). Representative photomicrographs of PAS-stained sections from mice in the r-BSA group (a, WT mouse; b, Tg mouse), and renal F4/80 immunostaining in the kidney of the r-BSA group in a WT mouse (c) and in a Tg mouse (d). F4/80 was expressed in the interstitium in both the Tg mouse and the WT mouse. The tubulointerstitial damage (e) and the number of F4/80-positive cells that had infiltrated the interstitium (f) were semiquantified as described in Materials and Methods; values are the mean ± SE. *, P < 0.05 compared to the saline group; †, P < 0.05 compared to the Tg mice. Original magnifications: ×100 (a–d).
Glomerulosclerosis was not observed in the r-BSA group of both the WT and the Tg mice on day 14, but was more prominent in the r-BSA group than in the saline group of each mouse on day 28. However the degree of the glomerulosclerosis in the Tg mice was similar to that in the WT mice (50 ± 4% and 43 ± 7% in the Tg and the WT mice, respectively; NS).
Macrophages infiltrated the interstitium in the r-BSA group of both the WT (Figure 5c) and the Tg (Figure 5d) mice on days 14 and 28. On day 28, the number of infiltrated macrophages was significantly higher in the r-BSA group than in the saline group in both the Tg and the WT mice (Figure 5f) (P < 0.05). That in the r-BSA group was significantly lower in the Tg mice than in the WT mice (39.5 ± 4.7 and 68.3 ± 9.4 in the Tg and the WT mice, respectively; P < 0.05).
Northern Blot Analysis
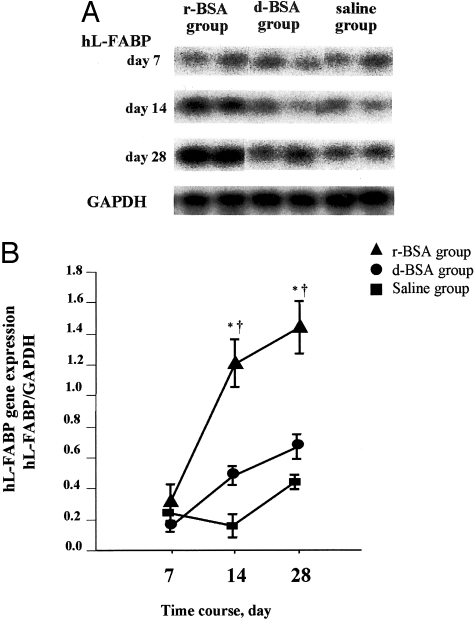
In the Tg mice, renal expression of the hL-FABP gene was similar among all three groups on day 7 (Figure 6, a and b). Thereafter, expression of hL-FABP increased in the r-BSA group and was significantly greater than in the d-BSA or the saline group on days 14 and 28. The expression of hL-FABP was not significantly higher in the d-BSA group than in the saline group on days 14 and 28. In the WT mice, renal expression of the hL-FABP gene was not induced by r-BSA (data not shown).
Figure 6-4250.
Protein overload-induced expression of hL-FABP transcripts in Tg mice. A: The expression of hL-FABP transcripts was examined by Northern blot analysis. B: The level of hL-FABP transcripts was semiquantified as described in Materials and Methods. Values are the mean ± SE. *, P < 0.05 compared to the saline group; †, P < 0.05 compared to the d-BSA group.
Western Blot Analysis
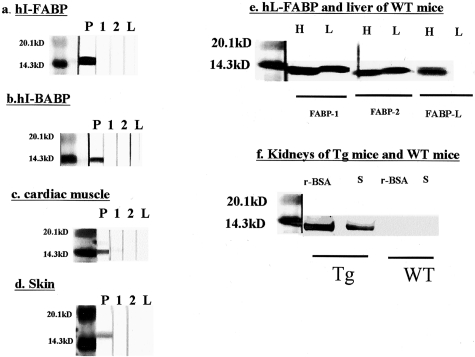
Monoclonal antibody against hL-FABP, FABP-1, FABP-2, and FABP-L, had no cross-reaction with the other family proteins, such as hI-FABP (Figure 7a), hI-BABP (Figure 7b), hH-FABP (Figure 7c), and hE-FABP (Figure 7d).
Figure 7-4250.
Specificity of monoclonal antibodies against hL-FABP, FABP-1, FABP-2, and FABP-L. a–d: Recombinant hI-FABP (a), recombinant hI-BABP (b), the protein of human cardiac muscle (c), and the protein of human skin (d) were electrophoresed and subjected to Western blot analysis using FABP-1 (1), FABP-2 (2), FABP-L (L), and some antibodies as positive controls (P). Rabbit polyclonal antibodies against hI-FABP, hI-BABP, hE-FABP, and mouse monoclonal antibody against hH-FABP were used as primary antibodies. e: Recombinant hL-FABP (H) and the protein of the livers in the WT mice (L) were electrophoresed and subjected to Western blot analysis using FABP-1, FABP-2, and FABP-L. f: The protein of the kidneys in the Tg and the WT mice injected with r-BSA or saline (S) was electrophoresed and subjected to Western blot analysis using FABP-2.
Both FABP-1 and FABP-2 reacted with the recombinant hL-FABP and the protein of the liver in the WT mouse, while in the endogenous mouse L-FABP was expressed (Figure 7e). FABP-L reacted with the recombinant hL-FABP, but not with the protein of the liver (Figure 7e). FABP-1 and FABP-2 had cross-reaction with the endogenous mouse L-FABP, but did not FABP-L.
To investigate whether L-FABP is induced by the injection of r-BSA in the kidney of the WT mice, FABP-2 was used as a primary antibody of Western blot analysis. In the kidney of the Tg mice, the expression of hL-FABP was increased by injection of r-BSA. However, in that of the WT mice, L-FABP was not induced by it (Figure 7f).
Immunohistochemical Evaluation of hL-FABP
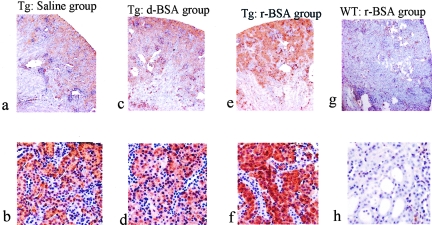
hL-FABP staining in the Tg mice was spread diffusely through the cytoplasm of the proximal tubules in all three groups on days 7, 14, and 28. The density of hL-FABP staining in the proximal tubules was similar among the three groups on day 7 (data not shown). Thereafter, its density in the proximal tubules was more intense in the r-BSA group than in the d-BSA or the saline group on days 14 (Figure 8) and 28 (data not shown). In the WT mice, hL-FABP staining was not observed in the r-BSA group and the saline group on days 7 (data not shown), 14 (data not shown), and 28 (Figure 8).
Figure 8-4250.
Photomicrographs of renal hL-FABP immunostaining (day 14). Representative photomicrographs show immunostaining of hL-FABP in the kidney of the saline (a, b), d-BSA (c, d), and r-BSA (e, f) groups in the Tg mouse, and that of the r-BSA group (g, h) in the WT mouse. Original magnifications: ×40 (a, c, e, g); ×100 (b, d, f, h).
Urinary Excretion of hL-FABP
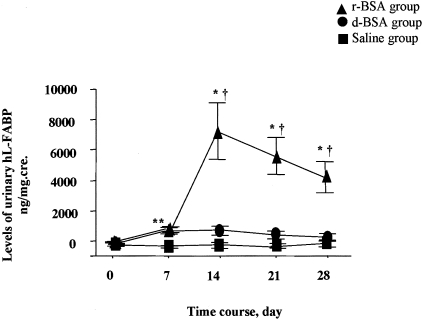
Tg animals overloaded with r-BSA and d-BSA showed almost the same high levels of urinary excretion of hL-FABP on day 7 (1026 ± 156 ng protein/mg cre and 863 ± 191 ng protein/mg cre, respectively) (Figure 9). Thereafter, urinary excretion of hL-FABP differed significantly (P < 0.05); in the r-BSA group, it increased and remained high (7497 ± 1888 ng/mg cre, 5884 ± 1228 ng/mg cre, and 4459 ± 1051 ng/mg cre on days 14, 21, and 28, respectively), whereas in the d-BSA group, it did not change significantly (879 ± 279 ng/mg cre, 584 ± 236 ng/mg cre, and 416 ± 196 ng/mg cre on days 14, 21, and 28, respectively). Urinary excretion of hL-FABP in the saline group remained low on all days. In the WT mice, urinary hL-FABP was not detected in the r-BSA and the saline groups.
Figure 9-4250.
Levels of urinary excretion of hL-FABP expressed as a ratio of urinary hL-FABP to urinary creatinine (ng/mg.cre) in Tg mice. Values are the mean ± SE. *, P < 0.05 compared to the saline group; †, P < 0.05 compared to the d-BSA group.
Clinical Study
Correlation between Urinary Excretion of hL-FABP and Clinical Parameters
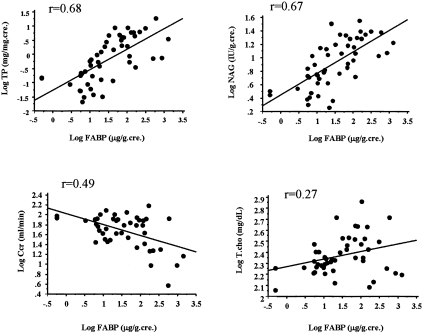
We investigated whether there is a correlation between urinary excretion of hL-FABP and other clinical parameters in human with kidney disease (Figure 10), and found that urinary excretion of hL-FABP was correlated significantly with urinary protein (r = 0.68, P < 0.0001), urinary NAG (r = 0.67, P < 0.0001), and creatinine clearance (Ccr) (r = 0.49, P < 0.0001). By contrast, total cholesterol was not correlated with urinary excretion of hL-FABP (r = 0.27, P < 0.0001).
Figure 10-4250.
Correlation between urinary excretion of hL-FABP and other clinical parameters. Urinary excretion of hL-FABP was correlated significantly with urinary protein (r = 0.68, P < 0.0001), urinary NAG (r = 0.67, P < 0.0001), and creatinine clearance (Ccr) (r = 0.49, P < 0.0001). By contrast, total cholesterol was not correlated with urinary excretion of hL-FABP (r = 0.27, P < 0.0001).
Correlation between Urinary Excretion of hL-FABP and Tubulointerstitial Damage
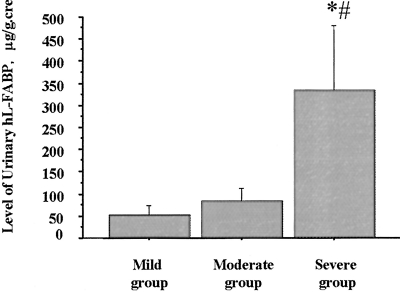
The ratio of the area of tubulointerstitial injury to the whole cortical area was found to be correlated with the level of urinary L-FABP (r = 0.33, P < 0.05), but not those of urinary protein and urinary NAG (data not shown). In addition, the level of urinary L-FABP was significantly higher in individuals with severe tubulointerstitial damage than in those with either mild or moderate damage (54.3 ± 20.1 μg/mg cre, 84.1 ± 28.0 μg/mg cre, 333.8 ± 146.5 μg/mg cre in mild, moderate, and severe groups, respectively; P < 0.005 mild group versus severe group, P < 0.05 moderate group versus severe group, and NS mild group versus moderate group) (Figure 11).
Figure 11-4250.
Correlation between urinary excretion of hL-FABP and the extent of tubulointerstitial damage. Urinary excretion of hL-FABP was significantly higher in patients with severe tubulointerstitial damage than in those with mild or moderate tubulointerstitial damage (#, P < 0.005 mild group versus severe group; *, P < 0.05 moderate group versus severe group).
Discussion
In the experimental model of protein overload nephropathy, we demonstrated that, in comparison to the administration of FFA-depleted albumin, the administration of FFA-replete albumin, which causes more severe tubulointerstitial damage, up-regulates expression of the hL-FABP gene and increases urinary excretion of hL-FABP. The number of infiltrated macrophages was significantly lower in the Tg mice than in the WT mice. We also demonstrated that urinary excretion of hL-FABP in patients with kidney disease is correlated with both urinary protein and the severity of tubulointerstitial damage. Thus, the present experimental model raises the hypothesis that urinary excretion of hL-FABP reflects a stress such as urinary protein overload on the proximal tubules—a hypothesis that is supported by the clinical observations.
In the experimental model using the Tg mice, levels of total serum protein, levels of urinary BSA, and levels of serum BSA were similar in the r-BSA and d-BSA groups on day 7. This indicates that the amount of BSA that was absorbed into the systemic circulation from the peritoneal cavity, filtered through glomeruli, and loaded on the proximal tubules was equivalent in the two groups. Urinary excretion of BSA on day 14 was significantly higher in the r-BSA group than in the d-BSA group. We previously discussed that differences in BSA itself, such as its isoelectric point, endotoxicity, cytotoxicity, and proximal tubular uptake, are not likely to have an influence on its urinary excretion.15 The current results suggest that in the early stages of the experiment, the amount of albumin loaded on the proximal tubules was equivalent in the two groups, whereas by day 14 the reabsorption of BSA had decreased in the r-BSA group. Thus, we conclude that the administration of FFAs bound to albumin damaged proximal tubular function to a greater extent than did the administration of pure albumin.
In the model using the Tg mice, the semiquantitative histological analysis showed that by day 28 the r-BSA group had developed significantly more severe tubulointerstitial damage than either the d-BSA or the saline group and that the number of infiltrated macrophages was much larger in the r-BSA group than in the d-BSA group. On day 28, the extent of glomerulosclerosis and mesangial expansion was greater, and consequently the levels of total serum protein were lower, in the r-BSA group than in the d-BSA group. Other studies reported that apoptosis was significantly increased in the r-BSA group but not in the d-BSA group19,21 and that fibronectin secretion, which was associated with accumulation of tubulointerstitial matrix proteins, was induced by oleate bound to albumin.18 The FFAs bound to albumin may be more strongly related to the progression of kidney disease than is albumin itself.
Serum total cholesterol in the r-BSA group remained higher than that in the d-BSA group on days 7, 14, and 28 (P < 0.05). These suggested that intraperitoneally injected FFAs in the r-BSA group were used for the synthesis of total cholesterol in the liver. Hypercholesterolemia was reported to cause interstitial inflammation and fibrosis.30 As we could not exclude the possibility that higher total cholesterol in the r-BSA group might play a certain role in the development of tubulointerstitial damage, we induced hypercholesterolemia (300 to 320 mg/dl) in mice with a high-fat diet. These hypercholesterolemic mice did not develop tubulointerstitial injury, which indicated that total cholesterol level in the protein overload model did not influence the progression of tubulointerstitial injury (data not shown).
FABPs may play an important role of FFA delivery and metabolic utilization.31,32 It has been hypothesized that FABP protects vital cellular functions by binding intracellular FFAs.23,31–34 In the proximal tubules, we investigated the effect of hL-FABP expression on the tubular damage induced by r-BSA. The levels of urinary protein excretion and serum parameters were not significantly different between the Tg and the WT mice. However, L-FABP expression in the proximal tubules reduced macrophage infiltration induced by r-BSA and mildly inhibited the development of tubulointerstitial damage. We assume that L-FABP may reduce accumulation of overloaded FFAs in the proximal tubules, inhibit production of inflammatory factors, and attenuate macrophage infiltration. However, there is an in vitro study suggesting that L-FABP does not protect against cytotoxicity induced by FFAs in the distal tubules, but not in the proximal tubules.35 Further experiments are needed to further confirm the significance of L-FABP in the proximal tubules under the pathophysiological condition.
On day 7, urinary excretion of hL-FABP and expression of the hL-FABP were similar in the r-BSA and d-BSA groups. On day 14, however, when there was a significant difference between the two groups in proximal tubular function but not in renal structural disorder, urinary excretion of hL-FABP and hL-FABP expression were significantly higher in the r-BSA group than in the d-BSA group. On day 28, when there was significantly more severe tubulointerstitial damage in the r-BSA group than in the d-BSA group, hL-FABP expression and urinary excretion of hL-FABP remained high, in parallel with urinary levels of BSA. These results indicate that stresses on the proximal tubules, such as FFAs bound to albumin, induce an up-regulation of hL-FABP gene expression and accelerate the excretion of hL-FABP from the proximal tubules, resulting in an increase in urinary excretion of hL-FABP.
Because hL-FABP was detected in not only the kidney, but also the liver and intestine of the Tg mice, serum L-FABP was filtered through the glomeruli and might influence urinary L-FABP. We measured serum hL-FABP of the Tg mice injected with r-BSA or d-BSA on day 28, when levels of urinary protein, urinary mouse albumin, and urinary hL-FABP were significantly higher in the r-BSA group than in the d-BSA group. Serum hL-FABP of the former was similar to that of the latter (0.14 ± 0.42 μg/ml and 0.09 ± 0.29 μg/ml, respectively; NS). Furthermore, injection of r-BSA or d-BSA did not increase hL-FABP expression in the liver of the Tg mice (data not shown), whereas it increased in the kidney of the Tg mice. Therefore, these results suggest that serum hL-FABP levels do not influence urinary hL-FABP levels.
L-FABP is a member of the genetically related cytosolic family of FABPs, which are known to bind intracellular fatty acids and transport them to sites of FFA β-oxidization (mitochondria or peroxisomes).36,37 Transcription of the L-FABP gene is promoted by FFAs.38 Recently, it has been reported that L-FABP transports FFAs from the cytosol to the nucleus39,40 and that L-FABP interacts with the nuclear protein peroxisome proliferator-activated receptors,41 which is a nuclear target of FFAs and initiates the gene expression of enzymes involved in lipid metabolism.42,43 L-FABP may have an important role in fatty acid homeostasis in the cytoplasm.20,26 L-FABP may have the same functions in the proximal tubules that it has in the liver and thus may be up-regulated by FFAs bound to albumin (as in r-BSA) and promote FFA metabolism by transporting them to the mitochondria, peroxisomes, or nucleus.
FABPs from some tissues of different mammalian species can show greater amino acid similarity and identity than is observed among FABPs isolated from different tissues of the same species.44 Although L-FABP is not expressed in mouse kidney under physiological conditions, it is possible that L-FABP expression may be induced in mouse kidney by FFA overload in a protein overload model. To discount this possibility, we generated a similar model of protein overload nephropathy in the WT mice, and performed Western blot analysis and immunohistochemistry with the anti-hL-FABP monoclonal antibody established here, FABP-2, which had cross-reaction with endogenous mouse L-FABP. Furthermore, we measured the urinary excretion of hL-FABP in the WT mice injected with r-BSA. However, we observed neither induction of L-FABP in the proximal tubules nor urinary excretion of hL-FABP in the WT mice. Thus, we conclude that there is little possibility that mouse L-FABP influenced our present results.
Because the Tg mice used in this study were generated by microinjection of the genomic DNA of hL-FABP including its promoter region, it seems possible that the transcription of the hL-FABP gene in the Tg mice might be regulated by the same mode in humans. In the pathological model of protein overload in these Tg mice, we would expect that the dynamics of hL-FABP might reflect its dynamics under similar pathophysiological conditions in humans. Thus, expression of hL-FABP in human proximal tubules may be up-regulated by increased urinary protein and the excretion of hL-FABP into urine may be accelerated.
Urinary protein has been widely confirmed as a factor indicative of progressive tubulointerstitial injury.1,2,9–12 In patients with kidney disease, there was a significant correlation of urinary L-FABP with levels of urinary protein and with the extent of tubulointerstitial damage in renal tissue. Other markers were not correlated with the extent of tubulointerstitial damage. These results indicate that an increase in urinary protein becomes a stress on the proximal tubules and causes accelerated excretion of hL-FABP from the proximal tubules into urine. The level of urinary L-FABP reflects the extent of tubulointerstitial damage. The clinical study advocates the hypothesis of the experimental model—that is, urinary excretion of hL-FABP reflects a stress such as urinary protein overload on the proximal tubules. Furthermore, we recently reported that only urinary hL-FABP was correlated with the progression of chronic kidney disease.27 Thus, urinary excretion of hL-FABP will probably serve as a useful marker for tubulointerstitial damage in humans.
Urinary NAG, which reflects structural damage of tubular cell, was measured in the r-BSA, the d-BSA, and the saline groups of the Tg mice. The level of NAG in the r-BSA group was higher than that in the d-BSA and the saline groups, but not significantly (data not shown). However, in this experimental study, we cannot completely deny the possibility that such a tubular damage can be easily monitored by measuring urinary NAG levels. In the clinical study, the degree of the tubulointerstitial damage was correlated with urinary L-FABP, but not with urinary NAG. We presume that the clinical significance of L-FABP may be different from that of NAG.
The reason why an increase in urinary protein causes hL-FABP to be excreted from the proximal tubules into urine was not clarified in these studies. When an uncontrolled influx of FFAs into the proximal tubules occurs in massive proteinuria, hL-FABP not only might promote the transport of FFAs to the mitochondria or peroxisomes, but it also might bind FFAs and excrete them into urine to maintain a low intracellular level of FFAs. Further studies are needed, however, to clarify the exact mechanisms underlying the increase in urinary excretion of hL-FABP.
In conclusion, our experimental model suggests that the urinary excretion of hL-FABP reflects a stress, such as urinary protein overload on the proximal tubules, that causes tubulointerstitial damage. The clinical observations support this hypothesis and show that urinary hL-FABP may be a useful clinical marker for kidney disease. Taken together, these results bring new insight into our understanding of the clinical implications of hL-FABP expressed in the proximal tubules.
Acknowledgments
We thank Ms. Sanae Ogawa (Internal Medicine, the University of Tokyo), Ms. Yasuko Ishii (Internal Medicine, St. Marianna University School of Medicine), and Ms. Kayoko Yamashita (Department of Anatomy, St. Marianna University School of Medicine) for assistance with laboratory technique; Drs. Hiroshi Miura, Hiroyo Sasaki, Satoshi Kondo, Yusuke Konno, Kohei Miura, Tomohiko Usui, Sayuri Shirai, Tetsuro Kusaba, Shingo Kuboshima, Yoshinori Shima, Mei Murao, Tutomu Sakurada, Goro Imai, Kouishi Ogimoto, Akiko Isogai, Takeo Sato, and Teruhiko Maeba for assistance with renal biopsy and urinary or serum collections; and Drs. Masaomi Nangaku (Internal Medicine, the University of Tokyo) and Shigeyoshi Oba (Internal Medicine, the University of Tokyo) for their expert technical support.
Footnotes
Address reprint requests to Kenjiro Kimura M.D., Ph.D., Prof. of Medicine, Nephrology, and Hypertension, St. Marianna University School of Medicine, 2-16-1 Sugao, Miyamae-Ku, Kawasaki 216-8511, Japan. E-mail: kimura@marianna-u.ac.jp.
References
- Remuzzi G, Ruggenenti P, Benigni A. Understanding the nature of renal disease progression. Kidney Int. 1997;51:2–15. doi: 10.1038/ki.1997.2. [DOI] [PubMed] [Google Scholar]
- Remuzzi G, Bertani T. Pathophysiology of progressive nephropathies. N Engl J Med. 1998;339:1448–1456. doi: 10.1056/NEJM199811123392007. [DOI] [PubMed] [Google Scholar]
- Risdon RA, Sloper JC, De Wardener HE. Relationship between renal function and histological changes found in renal-biopsy specimens from patients with persistent glomerular nephritis. Lancet. 1968;2:363–366. doi: 10.1016/s0140-6736(68)90589-8. [DOI] [PubMed] [Google Scholar]
- Nath KA. Tubulointerstitial changes as a major determinant in the progression of renal damage. Am J Kidney Dis. 1992;20:1–17. doi: 10.1016/s0272-6386(12)80312-x. [DOI] [PubMed] [Google Scholar]
- Hruby Z, Smolska D, Filipowski H, Rabczynski J, Cieslar E, Kopec W, Dulawa J. The importance of tubulointerstitial injury in the early phase of primary glomerular disease. J Intern Med. 1998;243:215–222. doi: 10.1046/j.1365-2796.1998.00277.x. [DOI] [PubMed] [Google Scholar]
- Schainuck LI, Striker GE, Cutler RE, Benditt EP. Structural-functional correlations in renal disease II The correlations. Hum Pathol. 1970;1:631–641. doi: 10.1016/s0046-8177(70)80061-2. [DOI] [PubMed] [Google Scholar]
- Mackensen-Haen S, Bader R, Grund KE, Bohle A. Correlations between renal cortical interstitial fibrosis, atrophy of the proximal tubules and impairment of the glomerular filtration rate. Clin Nephrol. 1981;15:167–171. [PubMed] [Google Scholar]
- Striker GE, Schainuck LI, Cutler RE, Benditt EP. Structural-functional correlations in renal disease I A method for assaying and classifying histopathologic changes in renal disease. Hum Pathol. 1970;1:615–630. doi: 10.1016/s0046-8177(70)80060-0. [DOI] [PubMed] [Google Scholar]
- Eddy AA, McCulloch L, Liu E, Adams J. A relationship between proteinuria and acute tubulointerstitial disease in rats with experimental nephrotic syndrome. Am J Pathol. 1991;138:1111–1123. [PMC free article] [PubMed] [Google Scholar]
- Eddy AA. Experimental insights into the tubulointerstitial disease accompanying primary glomerular lesions. J Am Soc Nephrol. 1994;5:1273–1287. doi: 10.1681/ASN.V561273. [DOI] [PubMed] [Google Scholar]
- Peterson JC, Adler S, Burkart JM, Greene T, Hebert LA, Hunsicker LG, King AJ, Klahr S, Massry SG, Seifter JL. Blood pressure control, proteinuria, and the progression of renal disease The modification of diet in renal disease Study. Ann Intern Med. 1995;123:754–762. doi: 10.7326/0003-4819-123-10-199511150-00003. [DOI] [PubMed] [Google Scholar]
- Suzuki Y, Lopez-Franco O, Gomez-Garre D, Tejera N, Gomez-Guerrero C, Sugaya T, Bernal R, Blanco J, Ortega L, Egido J. Renal tubulointerstitial damage caused by persistent proteinuria is attenuated in AT1-deficient mice: role of endothelin-1. Am J Pathol. 2001;159:1895–1904. doi: 10.1016/S0002-9440(10)63036-2. [DOI] [PMC free article] [PubMed] [Google Scholar]
- Hamilton JA, Era S, Bhamidipati SP, Reed RG. Locations of the three primary binding sites for long-chain fatty acids on bovine serum albumin. Proc Natl Acad Sci USA. 1991;88:2051–2054. doi: 10.1073/pnas.88.6.2051. [DOI] [PMC free article] [PubMed] [Google Scholar]
- Barac-Nieto M, Cohen JJ. The metabolic fates of palmitate in the dog kidney in vivo Evidence for incomplete oxidation. Nephron. 1971;8:488–499. doi: 10.1159/000179952. [DOI] [PubMed] [Google Scholar]
- Kamijo A, Kimura K, Sugaya T, Yamanouchi M, Hase H, Kaneko T, Hirata Y, Goto A, Fujita T, Omata M. Urinary free fatty acids bound to albumin aggravate tubulointerstitial damage. Kidney Int. 2002;62:1628–1637. doi: 10.1046/j.1523-1755.2002.00618.x. [DOI] [PubMed] [Google Scholar]
- Kees-Folts D, Sadow JL, Schreiner GF. Tubular catabolism of albumin is associated with the release of an inflammatory lipid. Kidney Int. 1994;45:1697–1709. doi: 10.1038/ki.1994.222. [DOI] [PubMed] [Google Scholar]
- Lindner A, Hinds TR, Joly A, Schreiner GF. Neutral lipid from proteinuric rat urine is a novel inhibitor of the red blood cell calcium pump. J Am Soc Nephrol. 1999;10:1170–1178. doi: 10.1681/ASN.V1061170. [DOI] [PubMed] [Google Scholar]
- Arici M, Brown J, Williams M, Harris KP, Walls J, Brunskill NJ. Fatty acids carried on albumin modulate proximal tubular cell fibronectin production: a role for protein kinase C. Nephrol Dial Transplant. 2002;17:1751–1757. doi: 10.1093/ndt/17.10.1751. [DOI] [PubMed] [Google Scholar]
- Arici M, Chana R, Lewington A, Brown J, Brunskill NJ. Stimulation of proximal tubular cell apoptosis by albumin-bound fatty acids mediated by peroxisome proliferator activated receptor-gamma. J Am Soc Nephrol. 2003;14:17–27. doi: 10.1097/01.asn.0000042167.66685.ea. [DOI] [PubMed] [Google Scholar]
- Thomas ME, Morrison AR, Schreiner GF. Metabolic effects of fatty acid-bearing albumin on a proximal tubule cell line. Am J Physiol. 1995;268:F1177–F1184. doi: 10.1152/ajprenal.1995.268.6.F1177. [DOI] [PubMed] [Google Scholar]
- Thomas ME, Harris KP, Walls J, Furness PN, Brunskill NJ. Fatty acids exacerbate tubulointerstitial injury in protein-overload proteinuria. Am J Physiol. 2002;283:F640–F647. doi: 10.1152/ajprenal.00001.2002. [DOI] [PubMed] [Google Scholar]
- Thomas ME, Schreiner GF. Contribution of proteinuria to progressive renal injury: consequences of tubular uptake of fatty acid bearing albumin. Am J Nephrol. 1993;13:385–398. doi: 10.1159/000168653. [DOI] [PubMed] [Google Scholar]
- Veerkamp JH, Peeters RA, Maatman RG. Structural and functional features of different types of cytoplasmic fatty acid-binding proteins. Biochim Biophys Acta. 1991;1081:1–24. doi: 10.1016/0005-2760(91)90244-c. [DOI] [PubMed] [Google Scholar]
- Sweetser DA, Heuckeroth RO, Gordon JI. The metabolic significance of mammalian fatty-acid-binding proteins: abundant proteins in search of a function. Annu Rev Nutr. 1987;7:337–359. doi: 10.1146/annurev.nu.07.070187.002005. [DOI] [PubMed] [Google Scholar]
- Maatman RG, van de Westerlo EM, van Kuppevelt TH, Veerkamp JH. Molecular identification of the liver- and the heart-type fatty acid-binding proteins in human and rat kidney Use of the reverse transcriptase polymerase chain reaction. Biochem J. 1992;288:285–290. doi: 10.1042/bj2880285. [DOI] [PMC free article] [PubMed] [Google Scholar]
- Martin GG, Danneberg H, Kumar LS, Atshaves BP, Erol E, Bader M, Schroeder F, Binas B. Decreased liver fatty acid binding capacity and altered liver lipid distribution in mice lacking the liver fatty acid-binding protein gene. J Biol Chem. 2003;278:21429–21438. doi: 10.1074/jbc.M300287200. [DOI] [PubMed] [Google Scholar]
- Kamijo A, Kimura K, Sugaya T, Yamanouchi M, Hikawa A, Hirano N, Hirata Y, Goto A, Omata M. Urinary fatty acid binding protein as a new clinical marker for the progression of chronic renal disease. J Lab Clin Med. 2004;143:23–30. doi: 10.1016/j.lab.2003.08.001. [DOI] [PubMed] [Google Scholar]
- Nagai K, Thogersen HC. Generation of beta-globin by sequence-specific proteolysis of a hybrid protein produced in Escherichia coli. Nature. 1984;309:810–812. doi: 10.1038/309810a0. [DOI] [PubMed] [Google Scholar]
- Watanabe R, Fujii H, Yamamoto A, Hashimoto T, Kameda K, Ito M, Ono T. Immunohistochemical distribution of cutaneous fatty acid-binding protein in human skin. J Dermatol Sci. 1997;16:17–22. doi: 10.1016/s0923-1811(97)00615-4. [DOI] [PubMed] [Google Scholar]
- Eddy AA. Interstitial fibrosis in hypercholesterolemic rats: role of oxidation, matrix synthesis, and proteolytic cascades. Kidney Int. 1998;53:1182–1189. doi: 10.1046/j.1523-1755.1998.00889.x. [DOI] [PubMed] [Google Scholar]
- Erol E, Kumar LS, Cline GW, Shulman GI, Kelly DP, Binas B. Liver fatty acid binding protein is required for high rates of hepatic fatty acid oxidation but not for the action of PPARalpha in fasting mice. EMBO J. 2004;18:347–349. doi: 10.1096/fj.03-0330fje. [DOI] [PubMed] [Google Scholar]
- Akiyama TE, Ward JM, Gonzalez FJ. Regulation of the liver fatty acid-binding protein gene by hepatocyte nuclear factor 1alpha (HNF1alpha) Alterations in fatty acid homeostasis in HNF1alpha-deficient mice. J Biol Chem. 2000;275:27117–27122. doi: 10.1074/jbc.M004388200. [DOI] [PubMed] [Google Scholar]
- Glatz JF, van der Vusse GJ. Cellular fatty acid-binding proteins: their function and physiological significance. Prog Lipid Res. 1996;35:243–282. doi: 10.1016/s0163-7827(96)00006-9. [DOI] [PubMed] [Google Scholar]
- Kaikaus RM, Bass NM, Ockner RK. Functions of fatty acid binding proteins. Experientia. 1990;46:617–630. doi: 10.1007/BF01939701. [DOI] [PubMed] [Google Scholar]
- Zimmerman AW, Veerkamp JH. Fatty-acid-binding proteins do not protect against induced cytotoxicity in a kidney cell model. Biochem J. 2001;360:159–165. doi: 10.1042/0264-6021:3600159. [DOI] [PMC free article] [PubMed] [Google Scholar]
- Ockner RK, Manning JA, Poppenhausen RB, Ho WK. A binding protein for fatty acids in cytosol of intestinal mucosa, liver, myocardium, and other tissues. Science. 1972;177:56–58. doi: 10.1126/science.177.4043.56. [DOI] [PubMed] [Google Scholar]
- Glatz JF, Veerkamp JH. Intracellular fatty acid-binding proteins. Int J Biochem. 1985;17:13–22. doi: 10.1016/0020-711x(85)90080-1. [DOI] [PubMed] [Google Scholar]
- Meunier-Durmort C, Poirier H, Niot I, Forest C, Besnard P. Up-regulation of the expression of the gene for liver fatty acid-binding protein by long-chain fatty acids. Biochem J. 1996;319:483–487. doi: 10.1042/bj3190483. [DOI] [PMC free article] [PubMed] [Google Scholar]
- Lawrence JW, Kroll DJ, Eacho PI. Ligand-dependent interaction of hepatic fatty acid-binding protein with the nucleus. J Lipid Res. 2000;41:1390–1401. [PubMed] [Google Scholar]
- Huang H, Starodub O, McIntosh A, Kier AB, Schroeder F. Liver fatty acid-binding protein targets fatty acids to the nucleus Real time confocal and multiphoton fluorescence imaging in living cells. J Biol Chem. 2002;277:29139–29151. doi: 10.1074/jbc.M202923200. [DOI] [PubMed] [Google Scholar]
- Wolfrum C, Borrmann CM, Borchers T, Spener F. Fatty acids and hypolipidemic drugs regulate peroxisome proliferator-activated receptors alpha- and gamma-mediated gene expression via liver fatty acid binding protein: a signaling path to the nucleus. Proc Natl Acad Sci USA. 2001;98:2323–2328. doi: 10.1073/pnas.051619898. [DOI] [PMC free article] [PubMed] [Google Scholar]
- Issemann I, Green S. Activation of a member of the steroid hormone receptor superfamily by peroxisome proliferators. Nature. 1990;347:645–650. doi: 10.1038/347645a0. [DOI] [PubMed] [Google Scholar]
- Wolfrum C, Ellinghaus P, Fobker M, Seedorf U, Assmann G, Borchers T, Spener F. Phytanic acid is ligand and transcriptional activator of murine liver fatty acid binding protein. J Lipid Res. 1999;40:708–714. [PubMed] [Google Scholar]
- Veerkamp JH, van Kuppevelt TH, Maatman RG, Prinsen CF. Structural and functional aspects of cytosolic fatty acid-binding proteins. Prostaglandins Leukot Essent Fatty Acids. 1993;49:887–906. doi: 10.1016/0952-3278(93)90174-u. [DOI] [PubMed] [Google Scholar]


