Abstract
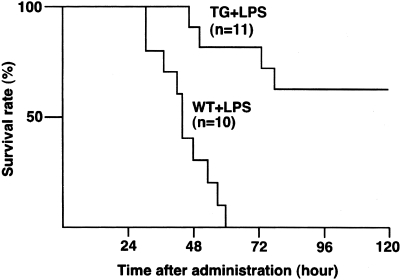
The 150-kd oxygen-regulated protein is a novel stress protein that is located in the endoplasmic reticulum and contributes to cell survival when this organelle is under stress. Expression of this protein was strongly increased in alveolar macrophages and alveolar epithelial cells from mice with acute lung injury induced by lipopolysaccharide. Transgenic mice overexpressing the 150-kd protein showed decreased histological severity of this lung injury, accompanied by lower total protein concentrations, and lactate dehydrogenase activity in bronchoalveolar lavage fluid. As indicated by nick end-labeling, lipopolysaccharide induced apoptosis in fewer alveolar wall cells in transgenic than in wild-type mice. Transgenic mice also showed increased survival after lipopolysaccharide injection (a log-rank test). Thus, the 150-kd protein, an endoplasmic reticulum-related molecular chaperone, is pivotal in resisting acute lung injury from lipopolysaccharide.
Lipopolysaccharide (LPS), a toxic biological substance that initiates acute inflammation, can produce experimental acute lung injury (ALI)1–3 resulting in hypoxemia. Ongoing exposure to hypoxemia/hypoxia induces death of lung cells, which are vulnerable to hypoxic conditions; hypoxia further increases lung inflammation after LPS exposure.4,5 Thus, hypoxia may play a central role in LPS-induced ALI.
Extreme hypoxia induces changes in cellular metabolic homeostasis. The 150-kd oxygen-regulated protein (ORP150/HSP12A), first cloned from cultured astrocytes under hypoxic conditions,6 is a molecular chaperone belonging to the heat shock protein (HSP) family. Located in the endoplasmic reticulum (ER), ORP150 resembles glucose-regulated proteins (GRPs) such as GRP78 and GRP94.7 ORP150 expression is required for cells to survive hypoxic conditions, indicating that ORP150 is important in protection of cells from hypoxia/ischemia.8 In the central nervous system, ORP150 overexpression was found to protect neurons from ischemia by suppression of apoptosis9 and/or activation of Ca2+-dependent proteinases.10,11 These findings establish an important role for this ER-located molecular chaperone in neuronal defense mechanisms against environmental stress.
Although ORP150 normally is expressed in most tissues, its role in the development of respiratory diseases has not been evaluated. Severity of ALI is associated with degree of alveolar epithelial cell injury.12 As alveolar epithelial cells participate in essential functions including gas exchange, they must be protected from environmental stresses including hypoxia. Thus, understanding of cellular defense mechanisms against such events could lead to therapeutic strategies that enhance protection of alveolar epithelial cells from pathogenetic insults. Induction of ER-associated chaperones such as ORP150 has not been studied in the respiratory system as a possible mechanism for cytoprotection.
We used a mouse model of LPS-induced ALI to examine changes in expression of ORP150 by alveolar epithelial cells, and to determine whether ORP150 overexpression could protect the lung from injury. Overexpression of ORP150 suppressed alveolar cell death. The role of ER-related stress in alveolar cell death should make it a productive target for treating ALI.
Materials and Methods
Mice
All animal procedures were approved by the Animal Care Committee of Hyogo College of Medicine. We used ORP150 transgenic (TG) mice9 supplied through participation of the HSP Research Institute (Kyoto, Japan), as well as wild-type (WT) littermates. The mice were female, 6 to 8 weeks old, and weighed 18 to 20 g.
Experimental Models and Protocols
To induce lung injury, mice were injected via the tail vein with 20 mg/kg of Escherichia coli LPS (L 4391, lot 012K4071; Sigma, St. Louis, MO) dissolved in 200 μl of saline. Control mice were injected with an equivalent volume of saline alone. Some mice were killed by exsanguination under pentobarbital anesthesia 24 hours after LPS administration; survival of other mice was studied for up to 5 days after injection with LPS.
Blood Gas Analysis
Arterial blood gas content was analyzed at room temperature. Blood samples were obtained directly from the heart as described previously,13 with some modifications. Briefly, mice were anesthetized with 0.5% halothane. Left ventricular puncture was performed through the left side of the closed thorax with a 22-gauge needle connected by a polyethylene tube (PE50) to a syringe containing heparinized saline. When 0.2 ml of blood sample was obtained, arterial blood gases were measured with an i-STAT cartridge (i-STAT Corp., East Windsor, NJ). Single cardiac puncture was confirmed subsequently.
Bronchoalveolar Lavage (BAL)
BAL was performed after intraperitoneal injection of pentobarbital. The trachea was exposed and injected through a catheter with 3 ml of phosphate-buffered saline (PBS) at pH 7.4. Total return after lavage in individual mice averaged 2.5 to 2.8 ml. After BAL fluid (BALF) was centrifuged at 1800 rpm for 10 minutes, the supernatant was used for measuring total protein concentration and lactate dehydrogenase (LDH) activity. Smears of BAL cells were prepared with Cytospin 3 equipment (Cytospin, Shandon, UK) and stained with Diff-Quik solution (Baxter, McGraw Park, IL) to examine the cell differentials.
For immunocytochemistry, BAL cells were fixed with acetone at room temperature for 5 minutes. Immunocytochemical staining for ORP150 then was performed using rabbit anti-ORP150 antibody (diluted 1:1000 in PBS) as described previously.6–11 Immunoreactivity was detected with an avidin-biotin-peroxidase detection system (Vectastain Elite ABC kit; Vector Laboratories, Burlingame, CA) and diaminobenzidine.
Measurement of Total Protein Concentration and LDH Activity
The protein concentration was determined using the Bradford reagent (B6916, Sigma), with bovine serum albumin (P0834, Sigma) as the standard. Briefly, BAL supernatant (50 μl) was added to 1.5 ml of Bradford reagent. Absorbance at 595 nm (A 595) was recorded every minute for 3 minutes, and the mean was calculated. Protein concentration was determined from A 595 using the bovine serum albumin standard curve. LDH activity was measured at 340 nm using an LDH determination kit according to the manufacturer’s instructions (DG 1340-UV, Sigma).
Measurement of Myeloperoxidase (MPO) Activity
MPO activity in lung tissue was assayed according to the method of Christofidou-Solomidou and colleagues,14 as the change in absorbance at 460 nm for 15 minutes.
Histological Examination and Nick End-Labeling of Lung Tissue Sections
Immediately after mice were killed, lungs were excised and fixed in 4% paraformaldehyde. Paraffin-embedded lung tissues were cut at a thickness of 4 μm. They were stained with hematoxylin and eosin (H&E), processed for immunohistochemistry (see below), or processed for terminal dUTP nick-end labeling (TUNEL). TUNEL was performed using an in situ apoptosis detection kit (Apop Tag; Intergen Company, Purchase, NY), followed by counterstaining with methyl green solution (Wako, Osaka, Japan). TUNEL-positive alveolar wall cells were counted in 15 to 20 randomly chosen microscopic fields (×400) of sections obtained from five mice, until a total of 2000 alveolar cells had been evaluated.
Immunohistochemistry
After deparaffinization, sections were immersed in target unmasking fluid antigen retrial solution (Monosan, T 10333; Sanbio BV, Uder, The Netherlands) and incubated in an oven for 10 minutes at 90°C. Double immunofluorescence for ORP150 and cytokeratin was performed to localize ORP150 to lung epithelial cells. After treatment of sections with blocking reagent using a mouse-on-mouse kit (MOM kit, Vector Laboratories), primary antibodies were applied: rabbit anti-ORP150 antibody diluted 1:1000 in PBS, and mouse monoclonal anti-cytokeratin antibody diluted 1:100 in PBS (C-2562, Sigma). Next, sections were incubated with one secondary antibody (fluorescein isothiocyanate-conjugated goat anti-rabbit IgG diluted 1:200 in PBS), and then with the other biotin-conjugated anti-mouse IgG diluted 1:1000 in PBS. The final incubation was with Cy3-avidin (diluted 1:2000 in PBS). Sections were examined using confocal laser-scanning microscopy (LSM510; Carl Zeiss, Göttingen, Germany).
Cell Culture of Alveolar Macrophages and LPS Treatment
Alveolar macrophages were collected from BALF obtained from adult Sprague-Dawley rats (350 to 380 g) according to Leeper-Woodford and colleagues5 with some modifications; under deep anesthesia with pentobarbital, the lungs were lavaged 10 times through a catheter with 8 ml of PBS at pH 7.4. Gradient-separated alveolar macrophages were counted and suspended (106 cells/ml) in Dulbecco’s modified Eagle’s medium with 10% fetal bovine serum (Biomedicals, Aurora, OH), 100 IU/ml penicillin, and 0.1 mg/ml streptomycin (Biomedicals). To examine the effect of LPS on ORP150 expression, adherent alveolar macrophages were incubated (37°C at 5% CO2) with LPS (10, 100, or 1000 ng/ml) or without LPS for 24 hours. Equal amounts of protein from cell lysates under each condition were subjected to Western analysis.
Western Analysis
Cultured alveolar macrophages and lung tissue homogenates (10 μg) were separated by 10% sodium dodecyl sulfate-polyacrylamide gel electrophoresis. Separated proteins were transferred electrophoretically onto nitrocellulose membranes. Membranes were incubated overnight at 4°C with rabbit anti-ORP150 antibody (diluted 1:1000 in PBS) and then with peroxidase-labeled anti-rabbit IgG secondary antibody (diluted 1:1000 in PBS) for 1 hour at room temperature. Antibody labeling of protein was detected with enhanced chemiluminescence reagents (Amersham Biosciences, Little Chalfont, Buckinghamshire, UK) according to the supplier’s protocol, and density was measured using scanning densitometry.
Statistical Analysis
Results are expressed as the mean ± SD. Differences between experimental groups were analyzed by analysis of variance with Bonferroni post hoc comparisons. Semiquantitative analysis of apoptotic cells was assessed by chi-square analysis between each group of mice. Survival curves (Kaplan-Meier plots) were analyzed by the log-rank test. Significance was assumed at P < 0.05.
Results
ORP150 Suppresses Hypoxemia
Results of blood gas analysis in the mice are shown in Table 1. Saline-treated WT and ORP150 TG mice had a PaO2 in the normal range. After treatment with LPS, WT mice showed severe hypoxemia with a significant decrease in PaO2 (P < 0.01). ORP150 TG mice treated with LPS also showed a significant decrease in PaO2 (P < 0.01) compared with saline-treated WT mice, but they still had significantly higher PaO2 values than LPS-treated WT mice (P < 0.05). No significant difference was seen in pH, PaCO2, or base excess between the various groups.
Table 1.
Blood Gas Analysis
| pH | PaO2 (mmHg) | PaCO2 (mmHg) | BE (mmol/L) | |
|---|---|---|---|---|
| WT + saline | 7.26 ± 0.05 | 97.0 ± 9.4 | 33.8 ± 7.9 | −12.2 ± 2.9 |
| WT + LPS | 7.21 ± 0.12 | 50.0 ± 9.1* | 23.0 ± 8.7 | −18.8 ± 2.9 |
| TG + saline | 7.22 ± 0.08 | 98.6 ± 10.9 | 32.5 ± 5.7 | −12.4 ± 5.5 |
| TG + LPS | 7.19 ± 0.11 | 70.6 ± 5.3*† | 28.6 ± 8.7 | −16.8 ± 5.9 |
BE, base excess.
Arterial blood gases measured in mice 24 hours after saline or LPS treatment. Blood samples were obtained directly from the left ventricle of the heart as described in the text. Saline-treated WT (WT + saline) and ORP150 TG mice (TG + saline) revealed a normal range of PaO2. After treatment with LPS, WT (WT + LPS) and ORP150 TG mice (TG + LPS) displayed a significant decrease in PaO2 (*, P < 0.01). The levels of hypoxemia, however, were different between the two genotypes. Compared with LPS-treated WT mice (WT + LPS), ORP150 TG mice (TG + LPS) revealed significantly higher levels of PaO2 (†, P < 0.05). Values represent mean ± SD of results from each group (n = 5).
, Significantly different from saline-injected mice in the same genotype.
, Significantly different from WT mice in the same treatment.
ORP150 Attenuates LPS-Induced ALI
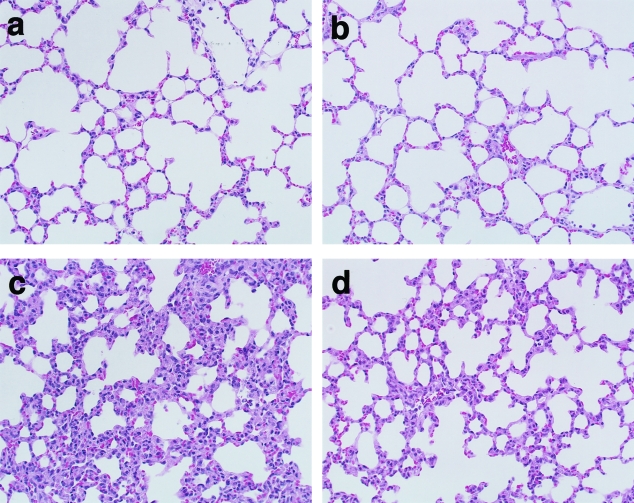
Normal lung histology was observed with H&E staining after saline treatment in WT mice (Figure 1a), and in ORP150 TG mice (Figure 1b). After LPS treatment, WT mice showed morphological evidence of lung injury, including severe disruption of alveolar walls and widespread alveolar wall thickening in association with edema and infiltration by inflammatory cells (Figure 1c). LPS-treated ORP150 TG mice showed somewhat lesser degrees of these abnormalities (Figure 1d).
Figure 1-4240.
H&E staining of lung sections obtained from mice 24 hours after the saline (a, b) or LPS (c, d) treatment. Saline-injected WT (a) and ORP150 TG (b) mice showed normal lung histology. LPS treatment resulted in diffuse alveolar wall injury and infiltration with inflammatory cells in WT mice (c), and these findings were attenuated in ORP150 TG mice (d). Original magnifications, ×200.
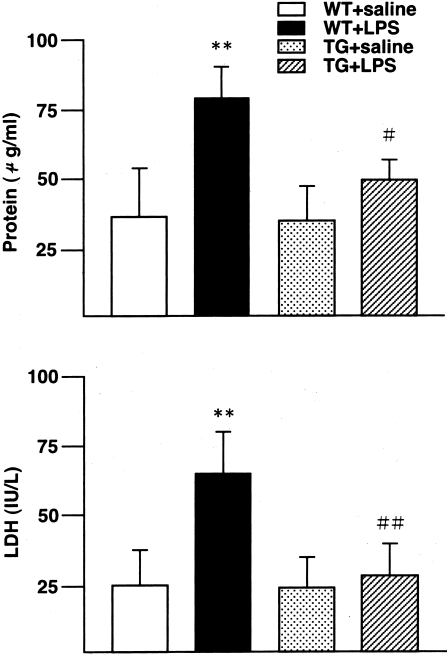
Total protein concentration and LDH activity in BALF are illustrated in Figure 2. No significant differences were observed between WT and ORP150 TG mice treated with saline. LPS treatment caused a significant increase in protein concentration (P < 0.01) and LDH activity (P < 0.01) in WT mice but not in ORP150 TG mice; overexpression-related differences were significant (protein concentration, P < 0.05; LDH activity, P < 0.01).
Figure 2-4240.
Total protein levels (a) and LDH activity (b) in BALF of WT and ORP150 TG mice 24 hours after the saline or LPS treatment. LPS treatment significantly increased both protein concentration (**, P < 0.01) and LDH activity (**, P < 0.01) in WT mice (WT + LPS). LPS treatment did not increase these parameters in ORP150 TG mice (TG + LPS). Between LPS-treated animals, ORP150 TG mice (TG + LPS) showed a significantly less amount of protein concentration (#, P < 0.05) and LDH activity (##, P < 0.01) than WT mice (WT + LPS). **, Significantly different from saline-injected mice in the same genotype; # and ##, significantly different from WT mice in the same treatment. WT mice, n = 5; ORP150 TG mice, n = 5, for each treatment.
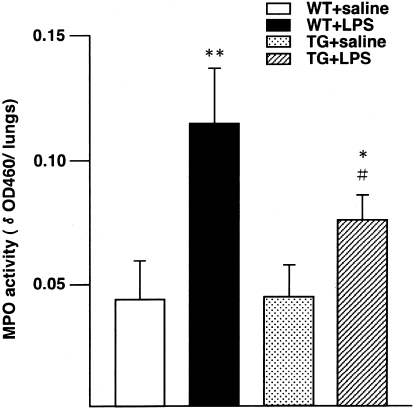
MPO activity (Figure 3) did not differ significantly between WT and ORP150 TG mice treated with saline, whereas LPS treatment significantly increased lung MPO activity in both WT (P < 0.01) and ORP150 TG mice (P < 0.05). However, the MPO activity in LPS-treated ORP150 TG mice was significantly less than that in LPS-treated WT mice (P < 0.05). Thus, ORP150 overexpression reduced pulmonary inflammation after LPS treatment.
Figure 3-4240.
MPO activity of the lungs obtained from WT and ORP150 TG mice 24 hours after the saline or LPS treatment. LPS treatment significantly increased MPO activity in both WT (WT + LPS) and ORP150 TG mice (TG + LPS), by 2.6-fold (**, P < 0.01) and 1.7-fold (*, P < 0.05), respectively, compared with saline-treated mice of each genotype. The increased MPO activity of LPS-treated ORP150 TG mice (TG + LPS) was significantly less than that of LPS-treated WT mice (WT + LPS) (#, P < 0.05). * and **, Significantly different from saline-injected mice in the same genotype; #, significantly different from WT mice in the same treatment. WT mice, n = 5; ORP150 TG mice, n = 5, for each treatment.
ORP150 Induced by Alveolar Epithelium in ALI
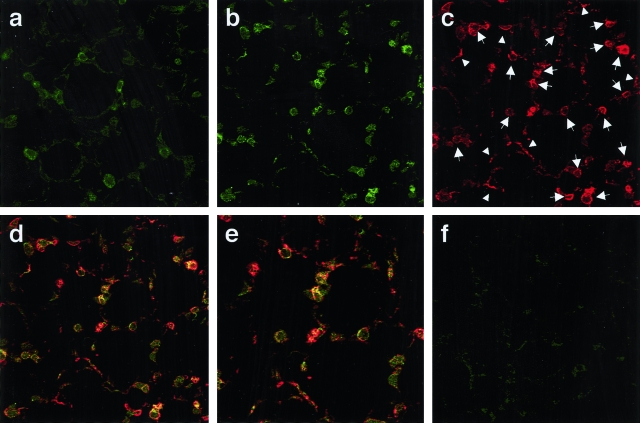
Immunofluorescence findings in lung sections concerning ORP150 are shown in Figure 4. Saline-treated WT mice displayed weak staining for ORP150 in the cytoplasm of alveolar wall cells (Figure 4a, green); LPS treatment increased ORP150 expression (Figure 4b, green). Double immunofluorescence for ORP150 and cytokeratin was performed to localize ORP150 to alveolar wall cells; immunofluorescence for cytokeratin in the same section identified alveolar epithelial cells (Figure 4c, red). Confocal laser microscopy demonstrated up-regulation of ORP150 expression (Figure 4b, green) in epithelial cells labeled by cytokeratin antibody [Figure 4; c (red), and d and e (merge)]. Control lung sections omitting either ORP150 (Figure 4f) or cytokeratin antibody (data not shown) were not fluorescent, and no cross reactivity was detected.
Figure 4-4240.
Confocal laser immunofluorescence photomicrography showing co-localization of ORP150 and cytokeratin in the lung. a: Saline-treated WT mice displayed weak staining for ORP150 in the cytoplasm of alveolar wall cells (green). b: After LPS treatment, the intensity of staining for ORP150 was up-regulated in WT mice (green). b–e: Representative images illustrating lung sections staining ORP150 (b, green), cytokeratin (c, red), and both (d and e, merge) obtained from LPS-treated WT mice. d: Cytokeratin was expressed in the cytoplasm of liner- and cubic-shaped alveolar wall cells, indicating type I (arrowheads) and type II (arrows) alveolar epithelial cells, respectively. d and e: Note that there is the overlap (yellow) between these two antigens. f: Control lung section omitting ORP150 antibody was not fluorescent. Original magnifications: ×400 (a–d, f); ×600 (e).
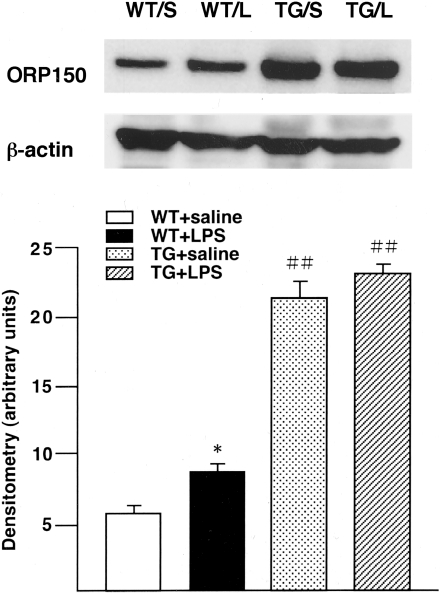
By Western analysis, ORP150 expression was increased in lungs of WT mice 24 hours after LPS (Figure 5). Semiquantitative analysis by densitometry showed a 1.4-fold increase in expression after LPS exposure (P < 0.05). ORP150 TG mice expressed 3.5 times as much ORP150 as WT mice unexposed to LPS (P < 0.01), and TG showed no further increase in ORP150 after LPS treatment. Saline injection did not affect ORP150 expression in the lungs of TG or WT mice (data not shown).
Figure 5-4240.
a: Western analysis showing immunoreactive ORP150 levels in homogenated lung samples from WT and ORP150 TG mice 24 hours after the saline (S) or LPS treatment (L). b: Densitometry of 150-kd bands was expressed as arbitrary units. LPS-treated WT mice (WT + LPS) had a 1.4-fold increase of ORP150 compared with the saline-treated WT mice (WT + saline) (*, P < 0.05). ORP150 TG mice (TG + saline) had a 3.5-fold increase in ORP150 expression compared with WT mice (WT + saline) (##, P < 0.01). LPS injection to ORP150 TG mice (TG + LPS) resulted in no further increase in ORP150. Values represent mean ± SD of results from each group (n = 3). *, Significantly different from saline-injected mice in the same genotype; ##, significantly different from WT mice in the same treatment.
ORP150 Induced in Alveolar Macrophage with LPS Stimulation
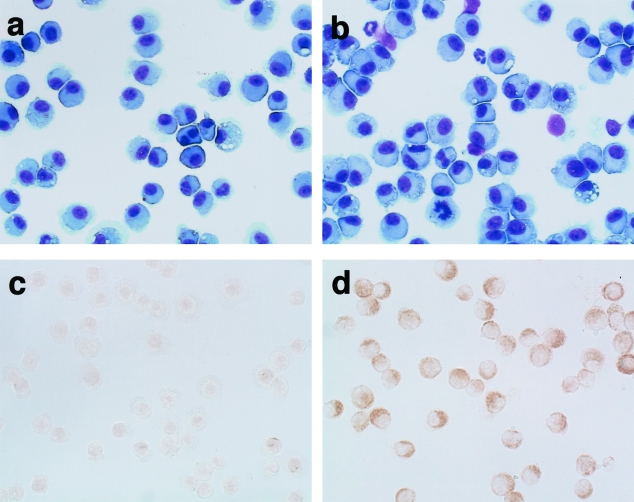
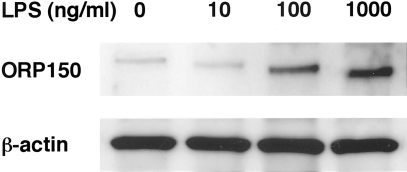
BALF cells stained with Diff-Quik solution are shown in Figure 6, a and b. In fluid from saline-treated WT mice, most cells appeared to be macrophages (Figure 6a), whereas some inflammatory cells such as neutrophils were found among BALF cells after LPS treatment (Figure 6b). Immunocytochemical staining of BALF cells for ORP150 is displayed in Figure 6, c and d. Compared with saline-treated WT mice (Figure 6c), LPS-treated WT mice showed up-regulated expression of ORP150 in the cytoplasm of macrophages obtained from BALF (Figure 6d). By Western analysis, LPS treatment induced increased ORP150 expression by alveolar macrophages in a dose-dependent manner (Figure 7). Thus, LPS itself could enhance production of ORP150 in response to ER stress.
Figure 6-4240.
Diff-Quik (a, b) and immunocytochemical staining (c, d) of BAL cells 24 hours after the saline (a, c) or LPS treatment (b, d) in WT mice. a: Most cells of saline-treated WT mice were morphologically macrophages. b: LPS-treated WT mice revealed some inflammatory cells including neutrophils. c and d: Immunocytochemistry for ORP150 displayed that this protein was expressed in morphologically macrophages. In comparison to saline-treated WT mice (c), the stronger intensity of ORP150 showed a predominantly perinuclear and cytoplasmic localization after LPS treatment (d). Original magnifications, ×400.
Figure 7-4240.
Western blotting of ORP150 by alveolar macrophages stimulated with LPS (10, 100, 1000 ng/ml) or without LPS for 24 hours. LPS-treatment induced dose-dependent ORP150 expression.
ORP150 Suppresses Apoptosis in Alveolar Wall Cells
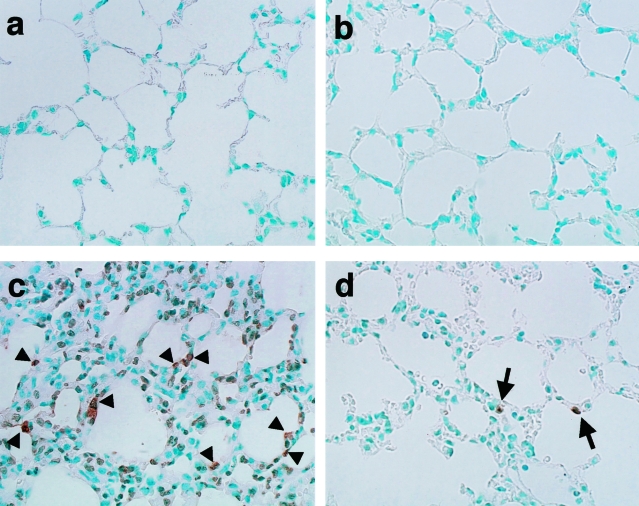
Apoptosis in the lung was assessed by the TUNEL method (Figure 8, Table 2). In saline-treated WT (Figure 8a) and ORP150 TG mice (Figure 8b), few TUNEL-positive lung cells were observed. Semiquantitative analysis of apoptotic cells showed that LPS treatment caused a significant increase in numbers of TUNEL-positive cells in the lungs of WT mice (P < 0.01). These cells were seen predominantly in alveolar walls (Figure 8c). After LPS treatment, TUNEL-positive lung cells were less plentiful in ORP150 TG mice (P < 0.01, Figure 8d) than in WT mice.
Figure 8-4240.
TUNEL staining of lung sections obtained from mice 24 hours after the saline (a, b) or LPS treatment (c, d). Saline-injected mice displayed few TUNEL-positive lung cells in WT (a) and ORP150 TG (b) mice. LPS treatment resulted in the increase in TUNEL-positive cells in alveolar walls of WT (c, arrowheads) and ORP150 TG (d, arrows) mice. ORP150 TG mice after LPS treatment showed less number of TUNEL-positive cells (d) than the same treated WT mice (c). Original magnifications, ×400.
Table 2.
Semiquantitative Analysis of Apoptotic Cells in Alveolar Wall Cells
| WT + saline |
9/2000 (0.45%) |
| WT + LPS | 186/2000 (9.30%)* |
| TG + saline | 7/2000 (0.35%) |
| TG + LPS | 29/2000 (1.45%)*† |
The number of TUNEL-positive cells in the lung obtained from mice 24 hours after saline or LPS treatment. Cell count was performed on tissue sections obtained from five individual animals in each group under microscopy. Values represent the number of TUNEL-positive alveolar wall cells out of a total of 2000 lung cells and their ratio. Saline-treated WT (WT + saline) and ORP150 TG mice (TG + saline) had a few TUNEL-positive cells in the lung. After treatment with LPS, both genotypic mice displayed a significant increase in TUNEL-positive cells (*, P < 0.01). Compared with LPS-treated WT mice (WT + LPS), ORP150 TG mice (TG + LPS) revealed significantly less number of TUNEL-positive cells in the lung (†, P < 0.01).
, Significantly different from saline-injected mice in the same genotype.
, Significantly different from WT mice in the same treatment.
ORP150 Reduced Mortality because of ALI
Survival rates after LPS administration are shown in Figure 9. All WT mice died within 60 hours after LPS injection, whereas ORP150 TG mice survived significantly longer (P < 0.01); with 63% of ORP150 TG mice remaining alive at 5 days after LPS injection.
Figure 9-4240.
Survival curves after LPS administration. Mortality of WT (n = 10), and ORP150 TG (n = 11) mice was assessed for 5 days. All WT mice died within 60 hours after LPS injection. ORP150 TG mice survived longer; 63% of them survived for 5 days after LPS administration. Compared with WT mice, the mortality rate was significantly reduced in ORP150 TG (P < 0.01) when analyzed by a log-rank test.
Discussion
This report is the first description of involvement of ER stress proteins in a murine model of ALI. We found that overexpression of ORP150, a novel ER stress protein, ameliorated LPS-induced lung injury and mortality. Patients with ALI are characterized by hypoxemia, bilateral infiltrates in chest radiographs, and absence of an elevated pulmonary capillary wedge pressure.15 Pathological findings in ALI include diffuse alveolar damage with widespread alveolar wall thickening and infiltration by neutrophils and macrophages.16 In the current study, LPS-treated WT mice developed histological findings compatible with ALI and displayed hypoxemia. LPS-induced hypoxemia is known to accompany microvascular endothelial and epithelial injuries of the lung. Functional derangements include disturbance of gas exchange by type I alveolar epithelial cells and decreased protective and regenerative properties in type II alveolar epithelial cells.16 Although LPS exposure and LPS-induced cytokines can directly produce tissue hypoxia by impaired oxygen metabolism,17,18 hypoxia in turn increases these LPS-stimulated responses.4,5 Furthermore, lung tissue hypoxia can be induced by a variety of factors such as hypovolemia, reduced blood flow, inadequate delivery of oxygen, and insufficient consumption of oxygen.19 These observations underscore the importance of the hypoxic stress response in protecting against LPS-induced ALI.
In the present study, LPS caused hypoxemia accompanied by expression of ORP150 in both alveolar macrophages and alveolar epithelial cells. Expression of molecular chaperones in ALI, such as ORP150, suggests occurrence of intercellular stresses arising in part from perturbations in the tissue environment. ORP150 first was identified as a stress protein in astrocytes exposed to severe hypoxia.6 In cultured cells, hypoxia induces a group of stress proteins, termed oxygen-regulated proteins (ORPs),20 as well as a shift of energy metabolism to favor anaerobic processes.21 ORPs overlap with proteins induced by glucose deprivation GRPs, and most ORPs/GRPs are located in the ER.22 This suggests that stress caused by an intercellular decline in either oxygen tension or glucose specifically targets the ER. Because ORP150 is localized to the ER and is expressed in response to stresses,6–11 up-regulation of ORP150 in these cells suggests the presence of an ER stress response during LPS exposure. Uncertainty has existed as to whether LPS could directly induce ORP150 in alveolar epithelial cells. In the current study LPS induced ORP150 expression in cultured alveolar macrophages, which suggests that LPS can directly cause a response to ER stress. Environmental stress focused on the ER causes a proteotoxic insult; accumulation of immature proteins in the ER is accompanied by conformational changes.23 Molecular chaperones are induced as a result. Taken together, these observations support an interpretation that increased expression of ORP150 in lung cells during LPS exposure indicates the presence of potentially hypoxic and/or proteotoxic environmental stress.
Overexpression of ORP150 improved cellular viability in the lung after LPS injection, suggesting that the protein has a protective role in alveolar cells after LPS exposure. Our data are consistent with findings supporting a protective role of ORP150 in various conditions of cellular stress, including hypoxia.8–11 These data suggest that both hypoxia and LPS can trigger induction of ORP150. Once induced, ORP150 can prevent disruption of the alveolar-capillary barrier, thus protecting the lung from ALI.
Although the mechanism by which ORP150 protects alveolar wall cells still is unclear, one potential mechanism may involve effects on apoptotic pathways. The apoptotic cascade, including the Fas/Fas ligand system2,24 and caspases,3,24 has been reported to be responsible for alveolar cell death. Experiments performed by our group and by others2,3,25 have demonstrated that LPS induces apoptosis in alveolar cells and endothelium. We already have demonstrated that ORP150 suppresses hypoxia-induced apoptosis in vitro,8 and that the chaperone function of ORP150 in vivo rescues neurons from hypoxic-mediated cell death by suppressing caspase-3-like activity.9 Although hypoxia-induced apoptosis can be accompanied by cytochrome c release from mitochondria,26 ER-specific apoptosis mediated by caspase-12 also has been reported.27 Another protective mechanism of ORP150 may involve anti-proteolytic properties. Our previous data demonstrated that ORP150 can maintain Ca2+ metabolism in the ER during glutamate excitotoxicity by suppressing Ca2+-dependent proteolysis.10,11 ORP150 is a homologue of CBP140, a 140-kd calcium-binding protein28 present in the ER. Thus, overexpression of ORP150 could protect alveolar epithelial cells from environmental stresses by suppressing several pathways of both apoptosis and proteolysis. The observation that the chaperone function of ORP150 is maintained even in a low ATP environment29 supports these protective actions.
An integral component of the cellular response to environmental challenge is expression, usually by de novo protein synthesis, of stress-associated polypeptides such as HSPs (induced by high temperature), GRPs (induced by glucose deprivation), and ORPs (induced by oxygen deprivation).30 Well conserved in organisms ranging from prokaryotes to mammals, these biosynthetic responses are hypothesized to contribute to maintenance of cellular homeostasis as an adaptation to altered environmental conditions. Cytoprotective roles in the lung have been reported for stress proteins such as HSP70 and HO-1.31–33 Mechanisms of cytoprotection by these stress proteins involve the resolution of inflammation by stabilization of both respiratory epithelial cells and macrophages.34–36 Alveolar macrophages highly express HSP7237 and HO-138 during lung injury, responses that have been reported to inhibit activation by LPS of the transcription factor nuclear factor-κB,35 which would induce inflammatory cytokines and cause activation of neutrophils.39,40 In the present study, we observed increased ORP150 expression in alveolar macrophages of WT mice injected with LPS. ORP150 TG mice showed less MPO activity than WT mice, suggesting an anti-inflammatory action of this ER chaperone in LPS-induced ALI. Because ORP150 is located in the ER, where accumulation of immature protein has been shown to activate nuclear factor-κB in HEK cells,41 ORP150 may facilitate protein folding in mature patterns, decreasing ER stress and inactivating nuclear factor-κB to decrease proinflammatory cytokine induction. Thus, ORP150 may exert an anti-inflammatory effect by maintaining ER integrity through mechanisms yet to be determined, ultimately decreasing alveolar wall injury.
In conclusion, we demonstrated that ORP150 expression in response to LPS-induced lung injury correlated closely with cell survival. As this inducible ER-associated stress protein therefore may confer resistance to ALI, up-regulation of ORP150 may represent a novel therapeutic strategy for enhancing alveolar cell survival in such injury.
Acknowledgments
We thank Ms. K. Obata and Ms. Y. Okinaka for the technical and secretarial assistance and Japan Tobacco Inc.
Footnotes
Address reprint requests to Takayuki Nakagomi, Department of Internal Medicine, Hyogo College of Medicine, 1-1 Mukogawa-cho, Nishinomiya, Hyogo 663-8501, Japan. E-mail: nakagomi@hyo-med.ac.jp.
Supported in part by the Ministry of Education, Science, and Culture of Japan (grant-in-aid no. 15790421).
References
- Denis M, Guojian L, Widmer M, Cantin A. A mouse model of lung injury induced by microbial products: implication of tumor necrosis factor. Am J Respir Cell Mol Biol. 1994;10:658–664. doi: 10.1165/ajrcmb.10.6.8003342. [DOI] [PubMed] [Google Scholar]
- Kitamura Y, Hashimoto S, Mizuta N, Kobayashi A, Kooguchi K, Fujiwara I, Nakajima H. Fas/FasL-dependent apoptosis of alveolar cells after lipopolysaccharide-induced lung injury in mice. Am J Respir Crit Care Med. 2001;163:762–769. doi: 10.1164/ajrccm.163.3.2003065. [DOI] [PubMed] [Google Scholar]
- Kawasaki M, Kuwano K, Hagimoto N, Matsuba T, Kunitake R, Tanaka T, Maeyama T, Hara N. Protection from lethal apoptosis in lipopolysaccharide-induced acute lung injury in mice by a caspase inhibitor. Am J Pathol. 2000;157:597–603. doi: 10.1016/S0002-9440(10)64570-1. [DOI] [PMC free article] [PubMed] [Google Scholar]
- Hempel SL, Monick MM, Hunninghake GW. Effect of hypoxia on release of IL-1 and TNF by human alveolar macrophages. Am J Respir Cell Mol Biol. 1996;14:170–176. doi: 10.1165/ajrcmb.14.2.8630267. [DOI] [PubMed] [Google Scholar]
- Leeper-Woodford SK, Detmer K. Acute hypoxia increases alveolar macrophage tumor necrosis factor activity and alters NF-κB expression. Am J Physiol. 1999;276:L909–L916. doi: 10.1152/ajplung.1999.276.6.L909. [DOI] [PubMed] [Google Scholar]
- Kuwabara K, Matsumoto M, Ikeda J, Hori O, Ogawa S, Maeda Y, Kitagawa K, Imuta N, Kinoshita T, Stern DM, Yanagi H, Kamada T. Purification and characterization of a novel stress protein, the 150-kDa oxygen-regulated protein (ORP150), from cultured rat astrocytes and its expression in ischemic mouse brain. J Biol Chem. 1996;271:5025–5032. doi: 10.1074/jbc.271.9.5025. [DOI] [PubMed] [Google Scholar]
- Ikeda J, Kaneda S, Kuwabara K, Ogawa S, Kobayashi T, Matsumoto M, Yura T, Yanagi H. Cloning and expression of cDNA encoding the human 150 kDa oxygen-regulated protein, ORP150. Biochem Biophys Res Commun. 1997;230:94–99. doi: 10.1006/bbrc.1996.5890. [DOI] [PubMed] [Google Scholar]
- Ozawa K, Kuwabara K, Tamatani M, Takatsuji K, Tsukamoto Y, Kaneda S, Yanagi H, Stern DM, Eguchi Y, Tsujimoto Y, Ogawa S, Tohyama M. 150-kDa oxygen-regulated protein (ORP150) suppresses hypoxia-induced apoptotic cell death. J Biol Chem. 1999;274:6397–6404. doi: 10.1074/jbc.274.10.6397. [DOI] [PubMed] [Google Scholar]
- Tamatani M, Matsuyama T, Yamaguchi A, Mitsuda N, Tsukamoto Y, Taniguchi M, Che YH, Ozawa K, Hori O, Nishimura H, Yamashita A, Okabe M, Yanagi H, Stern DM, Ogawa S, Tohyama M. ORP150 protects against hypoxia/ischemia-induced neuronal death. Nat Med. 2001;7:317–323. doi: 10.1038/85463. [DOI] [PubMed] [Google Scholar]
- Kitao Y, Ozawa K, Miyazaki M, Tamatani M, Kobayashi T, Yanagi H, Okabe M, Ikawa M, Yamashima T, Stern DM, Hori O, Ogawa S. Expression of the endoplasmic reticulum molecular chaperone (ORP150) rescues hippocampal neurons from glutamate toxicity. J Clin Invest. 2001;108:1439–1450. doi: 10.1172/JCI12978. [DOI] [PMC free article] [PubMed] [Google Scholar]
- Miyazaki M, Ozawa K, Hori O, Kitao Y, Matsushita K, Ogawa S, Matsuyama T. Expression of 150-kd oxygen-regulated protein in the hippocampus suppresses delayed neuronal cell death. J Cereb Blood Flow Metab. 2002;22:979–987. doi: 10.1097/00004647-200208000-00009. [DOI] [PubMed] [Google Scholar]
- Ware LB, Matthay MA. Alveolar fluid clearance is impaired in the majority of patients with acute lung injury and the acute respiratory distress syndrome. Am J Respir Crit Care Med. 2001;163:1376–1383. doi: 10.1164/ajrccm.163.6.2004035. [DOI] [PubMed] [Google Scholar]
- Matsumoto M, Kimura K, Fujisawa A, Matsuyama T, Asai T, Uyama O, Yoneda S, Abe H. Regional blood flows measured in Mongolian gerbil by a modified microsphere method. Am J Physiol. 1982;242:H990–H995. doi: 10.1152/ajpheart.1982.242.6.H990. [DOI] [PubMed] [Google Scholar]
- Christofidou-Solomidou M, Kennel S, Scherpereel A, Wiewrodt R, Solomides CC, Pietra GG, Murciano JC, Shah SA, Ischiropoulos H, Albelda SM, Muzykantov VR. Vascular immunotargeting of glucose oxidase to the endothelial antigens induces distinct forms of oxidant acute lung injury: targeting to thrombomodulin, but not to PECAM-1, causes pulmonary thrombosis and neutrophil transmigration. Am J Pathol. 2002;160:1155–1169. doi: 10.1016/S0002-9440(10)64935-8. [DOI] [PMC free article] [PubMed] [Google Scholar]
- Bernard GR, Artigas A, Brigham KL, Carlet J, Falke K, Hudson L, Lamy M, Legall JR, Morris A, Spragg R. The American-European Consensus Conference on ARDS: definitions, mechanisms, relevant outcomes, and clinical trial coordination. Am J Respir Crit Care Med. 1994;149:818–824. doi: 10.1164/ajrccm.149.3.7509706. [DOI] [PubMed] [Google Scholar]
- Ware LB, Matthay MA. The acute respiratory distress syndrome. N Engl J Med. 2000;342:1334–1349. doi: 10.1056/NEJM200005043421806. [DOI] [PubMed] [Google Scholar]
- Schulze-Osthoff K, Bakker AC, Vanhaesebroeck B, Beyaert R, Jacob WA, Fiers W. Cytotoxic activity of tumor necrosis factor is mediated by early damage of mitochondrial functions Evidence for the involvement of mitochondrial radical generation. J Biol Chem. 1992;267:5317–5323. [PubMed] [Google Scholar]
- Crouser ED, Julian MW, Blaho DV, Pfeiffer DR. Endotoxin-induced mitochondrial damage correlates with impaired respiratory activity. Crit Care Med. 2002;30:276–284. doi: 10.1097/00003246-200202000-00002. [DOI] [PubMed] [Google Scholar]
- Shoemaker WC, Appel PL, Bishop MH. Temporal patterns of blood volume, hemodynamics, and oxygen transport in pathogenesis and therapy of postoperative adult respiratory distress syndrome. New Horiz. 1993;1:522–537. [PubMed] [Google Scholar]
- Heacock CS, Sutherland RM. Induction characteristics of oxygen regulated proteins. Int J Radiat Oncol Biol Phys. 1986;12:1287–1290. doi: 10.1016/0360-3016(86)90155-0. [DOI] [PubMed] [Google Scholar]
- Niitsu Y, Hori O, Yamaguchi A, Bando Y, Ozawa K, Tamatani M, Ogawa S, Tohyama M. Exposure of cultured primary rat astrocytes to hypoxia results in intracellular glucose depletion and induction of glycolytic enzymes. Brain Res Mol Brain Res. 1999;74:26–34. doi: 10.1016/s0169-328x(99)00245-4. [DOI] [PubMed] [Google Scholar]
- Little E, Ramakrishnan M, Roy B, Gazit G, Lee AS. The glucose-regulated proteins (GRP78 and GRP94): functions, gene regulation, and applications. Crit Rev Eukaryot Gene Expr. 1994;4:1–18. doi: 10.1615/critreveukargeneexpr.v4.i1.10. [DOI] [PubMed] [Google Scholar]
- Patil C, Walter P. Intracellular signaling from the endoplasmic reticulum to the nucleus: the unfolded protein response in yeast and mammals. Curr Opin Cell Biol. 2001;13:349–355. doi: 10.1016/s0955-0674(00)00219-2. [DOI] [PubMed] [Google Scholar]
- Albertine KH, Soulier MF, Wang Z, Ishizaka A, Hashimoto S, Zimmerman GA, Matthay MA, Ware LB. Fas and fas ligand are up-regulated in pulmonary edema fluid and lung tissue of patients with acute lung injury and the acute respiratory distress syndrome. Am J Pathol. 2002;161:1783–1796. doi: 10.1016/S0002-9440(10)64455-0. [DOI] [PMC free article] [PubMed] [Google Scholar]
- Haimovitz-Friedman A, Cordon-Cardo C, Bayoumy S, Garzotto M, McLoughlin M, Gallily R, Edwards CK, III, Schuchman EH, Fuks Z, Kolesnick R. Lipopolysaccharide induces disseminated endothelial apoptosis requiring ceramide generation. J Exp Med. 1997;186:1831–1841. doi: 10.1084/jem.186.11.1831. [DOI] [PMC free article] [PubMed] [Google Scholar]
- Chae HJ, Kim SC, Han KS, Chae SW, An NH, Kim HM, Kim HH, Lee ZH, Kim HR. Hypoxia induces apoptosis by caspase activation accompanying cytochrome C release from mitochondria in MC3T3E1 osteoblasts p38 MAPK is related in hypoxia-induced apoptosis. Immunopharmacol Immunotoxicol. 2001;23:133–152. doi: 10.1081/iph-100103855. [DOI] [PubMed] [Google Scholar]
- Nakagawa T, Zhu H, Morishima N, Li E, Xu J, Yankner BA, Yuan J. Caspase-12 mediates endoplasmic-reticulum-specific apoptosis and cytotoxicity by amyloid-b. Nature. 2000;403:98–103. doi: 10.1038/47513. [DOI] [PubMed] [Google Scholar]
- Naved AF, Ozawa M, Yu S, Miyauchi T, Muramatsu H, Muramatsu T. CBP-140, a novel endoplasmic reticulum resident Ca2+-binding protein with a carboxy-terminal NDEL sequence showed partial homology with 70-kDa heat shock protein (hsp70) Cell Struct Funct. 1995;20:133–141. doi: 10.1247/csf.20.133. [DOI] [PubMed] [Google Scholar]
- Bando Y, Ogawa S, Yamauchi A, Kuwabara K, Ozawa K, Hori O, Yanagi H, Tamatani M, Tohyama M. 150-kDa oxygen-regulated protein (ORP150) functions as a novel molecular chaperone in MDCK cells. Am J Physiol. 2000;278:C1172–C1182. doi: 10.1152/ajpcell.2000.278.6.C1172. [DOI] [PubMed] [Google Scholar]
- Pelham HR. Speculations on the functions of the major heat shock and glucose-regulated proteins. Cell. 1986;46:959–961. doi: 10.1016/0092-8674(86)90693-8. [DOI] [PubMed] [Google Scholar]
- Villar J, Edelson JD, Post M, Mullen JB, Slutsky AS. Induction of heat stress proteins is associated with decreased mortality in an animal model of acute lung injury. Am Rev Respir Dis. 1993;147:177–181. doi: 10.1164/ajrccm/147.1.177. [DOI] [PubMed] [Google Scholar]
- Weiss YG, Maloyan A, Tazelaar J, Raj N, Deutschman CS. Adenoviral transfer of HSP-70 into pulmonary epithelium ameliorates experimental acute respiratory distress syndrome. J Clin Invest. 2002;110:801–806. doi: 10.1172/JCI15888. [DOI] [PMC free article] [PubMed] [Google Scholar]
- Hashiba T, Suzuki M, Nagashima Y, Suzuki S, Inoue S, Tsuburai T, Matsuse T, Ishigatubo Y. Adenovirus-mediated transfer of heme oxygenase-1 cDNA attenuates severe lung injury induced by the influenza virus in mice. Gene Ther. 2001;8:1499–1507. doi: 10.1038/sj.gt.3301540. [DOI] [PubMed] [Google Scholar]
- Yoo CG, Lee S, Lee CT, Kim YM, Han SK, Shim YS. Anti-inflammatory effect of heat shock protein induction is related to stabilization of IκBα through preventing IκB kinase activation in respiratory epithelial cells. J Immunol. 2000;164:5416–5423. doi: 10.4049/jimmunol.164.10.5416. [DOI] [PubMed] [Google Scholar]
- Shanley TP, Ryan MA, Eaves-Pyles T, Wong HR. Heat shock inhibits phosphorylation of I-κBα. Shock. 2000;14:447–450. doi: 10.1097/00024382-200014040-00005. [DOI] [PubMed] [Google Scholar]
- Willis D, Moore AR, Frederick R, Willoughby DA. Heme oxygenase: a novel target for the modulation of the inflammatory response. Nat Med. 1996;2:87–90. doi: 10.1038/nm0196-87. [DOI] [PubMed] [Google Scholar]
- Kindas-Mügge I, Pohl WR, Zavadova E, Köhn HD, Fitzal S, Kummer F, Micksche M. Alveolar macrophages of patients with adult respiratory distress syndrome express high levels of heat shock protein 72 mRNA. Shock. 1996;5:184–189. doi: 10.1097/00024382-199603000-00003. [DOI] [PubMed] [Google Scholar]
- Kitada O, Kodama T, Kuribayashi K, Ihaku D, Fujita M, Matsuyama T, Sugita M. Heme oxygenase-1 (HO-1) protein induction in a mouse model of asthma. Clin Exp Allergy. 2001;31:1470–1477. doi: 10.1046/j.1365-2222.2001.01179.x. [DOI] [PubMed] [Google Scholar]
- Goodman RB, Strieter RM, Martin DP, Steinberg KP, Milberg JA, Maunder RJ, Kunkel SL, Walz A, Hudson LD, Martin TR. Inflammatory cytokines in patients with persistence of the acute respiratory distress syndrome. Am J Respir Crit Care Med. 1996;154:602–611. doi: 10.1164/ajrccm.154.3.8810593. [DOI] [PubMed] [Google Scholar]
- Carden D, Xiao F, Moak C, Willis BH, Robinson-Jackson S, Alexander S. Neutrophil elastase promotes lung microvascular injury and proteolysis of endothelial cadherins. Am J Physiol. 1998;275:H385–H392. doi: 10.1152/ajpheart.1998.275.2.H385. [DOI] [PubMed] [Google Scholar]
- Pahl HL, Baeuerle PA. A novel signal transduction pathway from the endoplasmic reticulum to the nucleus is mediated by transcription factor NF-κB. EMBO J. 1995;14:2580–2588. doi: 10.1002/j.1460-2075.1995.tb07256.x. [DOI] [PMC free article] [PubMed] [Google Scholar]


