

Abstract
Objectives
We report the prevalence of and risk and protective factors for DSM-IV sub-threshold gambling (1–4 criteria) and pathological gambling disorder (PGD; 5–10 criteria) in a non-clinical household sample of St. Louis area gamblers.
Methods
Of the 7689 individuals contacted via Random Digit Dialing, 3292 were screened eligible. Of these, 1142 from households in 6 contiguous regions in Missouri and Illinois consented to participate and were mailed a St. Louis Area Personality, Health, and Lifestyle (SLPHL) Survey.
Results
Post-stratification weighted data (n = 913) indicate lifetime prevalence rates of 12.4% sub-threshold and 2.5% PGD (conditional prevalence = 21.5% and 4.3% respectively). Risk and protective factors for gambling severity varied in the sample.
Conclusions
Targeted prevention messages are warranted specifically for gamblers of varying risk for PGD.
Keywords: Pathological gambling, Epidemiology, Personality, TCI, Comorbidity, Substance use
1. Introduction
Pathological gambling disorder (PGD) is characterized by gambling behavior that is persistent and recurrent and that causes significant impairment in a person’s life – with family members, or at work or school (APA, 1994). The psychiatric diagnosis is made when at least 5 out of 10 criteria are present. The criteria mimic substance dependence and include pre-occupation, inability to control or stop gambling, needing to gamble more often or make larger bets to obtain a level of excitement, continuing to gamble despite problems, lying to conceal gambling involvement, committing illegal acts to obtain gambling money, “withdrawal-like” symptoms of restlessness or irritability when unable to gamble, and “self-medication” behavior such as gambling to escape a dysphoric mood. Criteria also include those more specific to the nature of gambling, such as “chasing losses” in order to win, break even or recover past losses, and relying on others for a financial “bail-out” due to gambling-related financial problems.
Studies in the US and Canada have reported lifetime rates of PGD between 1.0% and 2.0% (Kallick et al., 1979; NRC, 1999; Volberg, 1994; Gerstein et al., 1999; Shaffer and Hall, 1997; Welte et al., 2002; Cunningham-Williams and Cottler, 2001). For example, in a recent national telephone survey of gambling in the US, Welte et al. (2002) used the Diagnostic Interview Schedule (DIS; version 4.0; Robins et al., 1997) to interview a sample of nearly 2700 adults, aged 18 and older. Most of the sample gambled (82%), primarily on the lottery and casino games. The lifetime PGD rate was 2.0% with a past year rate of 1.35% (Welte et al., 2002). The conditional prevalence rates (i.e., among gamblers only) were slightly higher (2.16% – lifetime and 1.46% for the past year; personal communication with Dr. John W. Welte, April 21, 2003).
The gambling impact and behavior study report (Gerstein et al., 1999) to the National Gambling Impact Study Commission, estimated a lifetime and past year rate of 0.8% and 0.1%, respectively, using the NODS (NORC Diagnostic Screen), in their national telephone survey of 2417 adults. Participants in the study met a threshold of having ever lost $100 or more in a single day of gambling or who ever lost this same amount in a 12-month period.
Site-specific studies conducted earlier than these have found similar lifetime PGD rates. For example, the St. Louis, Missouri site of the national epidemiologic catchment area (ECA) study (Robins and Regier, 1991), using the DIS (Robins et al., 1981), reported rates of 0.9% for PGD in the overall sample of 3004 household residents (Cunningham-Williams et al., 1998). The ECA study, conducted in 1980, collected gambling data during a time prior to the proliferation of legal gambling opportunities in Missouri. The Missouri Lottery was not yet established, and the first riverboat casino in the area did not begin operations until about 13 years after the ECA study was begun. That study was the first of its kind to report rates of DSM-III PGD and its comorbid psychiatric and substance use disorders among household residents. Cunningham-Williams et al. (1998) also reported that while rates of gambling were higher for Caucasians than for African-Americans, African-Americans were more likely to be problem or pathological gamblers. Persons with major depression, schizophrenia, phobias, somatization syndrome, antisocial personality disorder, alcohol abuse/dependence, and nicotine dependence were found to have a significantly higher likelihood of being problem gamblers than their counterparts. In an 11-year follow-up of a sub-sample of drug users from the ECA study (n = 162), the PGD prevalence rate was 1.2% and was 3.7% at the follow-up. Also, there was a considerable increase in the rate of problem gambling from 3.7% to 10.5% (Cottler and Cunningham-Williams, 2000). Rates of PGD are among the highest for individuals sampled from psychiatric and drug treatment settings ranging from 7% to 16% (Cunningham-Williams et al., 2000; Lesieur and Blume, 1990; Lesieur et al., 1986; Lesieur and Heineman, 1988; Spunt et al., 1995; Steinberg et al., 1992).
Those who exhibit addictive and impulsive behavior are generally found to have the personality trait of high novelty-seeking, whereas mood and anxiety disorders are associated with high harm avoidance (Battaglia et al., 1996; Howard et al., 1997). In fact, self-directedness is negatively correlated with many other manifestations of psychopathology (Grucza and Cloninger, 2002; Svrakic et al., 1993). Few studies have been conducted examining personality traits among problem gamblers. Kim and Grant (2001) recruited participants from two clinical medication trials on PGD and obsessive-compulsive disorder (OCD) and found, using the Tridimensional Personality Questionnaire (TPQ; Cloninger, 1987), that problem gamblers were more likely to be novelty-seekers when compared to OCD patients and normal controls and there was also a tendency for them to score lower than OCD patients on harm avoidance. There were no differences among the groups in reward dependence. As noted by Kidman (2002), that study was limited by the small sample size and lack of sample representativeness. Given its limitations, however, it highlights that personality traits and other comorbid psychiatric and substance use disorders among gamblers may be important areas for further examination.
It was the aim of the current analysis to report, for the first time since the legalization of area riverboat casinos, the prevalence of problem gambling and PGD in a household sample of St. Louis area residents who were not being assessed solely for the purpose of obtaining gambling histories. Since this was the first study assessing gambling in the area since the St. Louis ECA study, it was of interest to see how these rates compared to that study in the current context of increased legal gambling opportunities in the area. Additionally, we sought to examine the association of gambling behavior with socio-demographic characteristics, psychiatric and substance use correlates, and personality traits.
2. Methodology
2.1. Sampling procedure
From 2001 to 2002, a survey covering topics related to personality, lifestyle and health was administered to a stratified, random sample of adults (age 18 and older), using random digit dialing (RDD) from six geographic regions that included St. Louis city and five surrounding counties in Missouri and Illinois. Strata were defined according to geographic region, gender, age and race/ethnicity categories based on data from the 2000 US census. In one county the RDD list was exhausted, thus the sample was augmented with additional ethnic/racial minority subjects (n = 12). The data were weighted based on the stratification variables in order to establish population estimates for the sampling areas.
2.2. Subject recruitment procedure and results
When a potential participant was reached by telephone, the study aims, eligibility criteria and compensation procedures were explained. The screening process was iterative and thus excluded individuals if they belonged to a demographic stratum for which the recruitment quota had already been met. Other exclusion criteria included those under age 18 and those unable to be interviewed in English and by telephone. A successful contact was defined as a residential number that was answered by the fifth attempt (n = 7689). Of these contacts, 4697 screening interviews were completed, 1142 individuals agreed to participate, gave verbal informed consent and were then mailed a survey booklet. The remaining contacts were either eligible, but uninterested (n = 2150) or determined ineligible to participate (n = 1405) and thus, were not sent a survey. Completed surveys were returned by 918 of the respondents, therefore representing a net participation rate of those who completed surveys out of those who were eligible (irrespective of interest to participate) of 27.9% (918/3292), a consent rate among those eligible of 34.7% (1142/3292), and an actual participation rate of 80.4% (918/1142). All procedures were approved by the Washington University School of Medicine Institutional Review Board prior to data collection.
2.3. Instrumentation
The survey, the St. Louis area personality, health, and lifestyle (SLPHL) study 2001, was a self-administered mail survey that included socio-demographic variables (e.g., gender, race/ethnicity, number of times married, educational level, employment status, frequency of church or religious service attendance, and frequency of private prayer or meditation) and previously developed assessments, with additional items such as gambling questions added for this study.
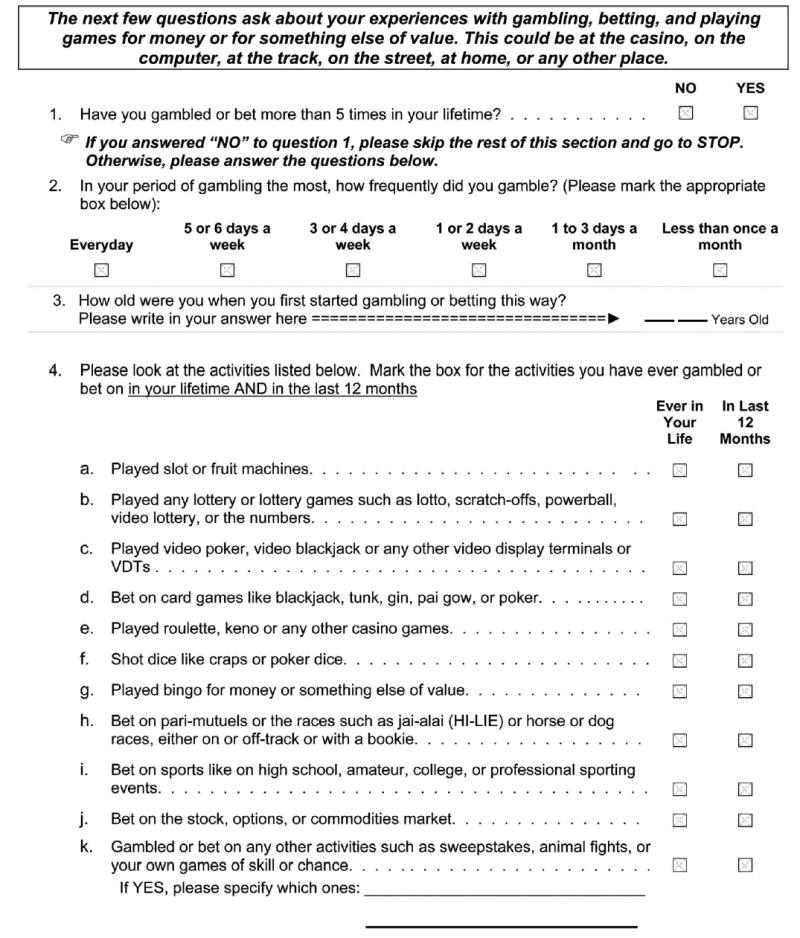
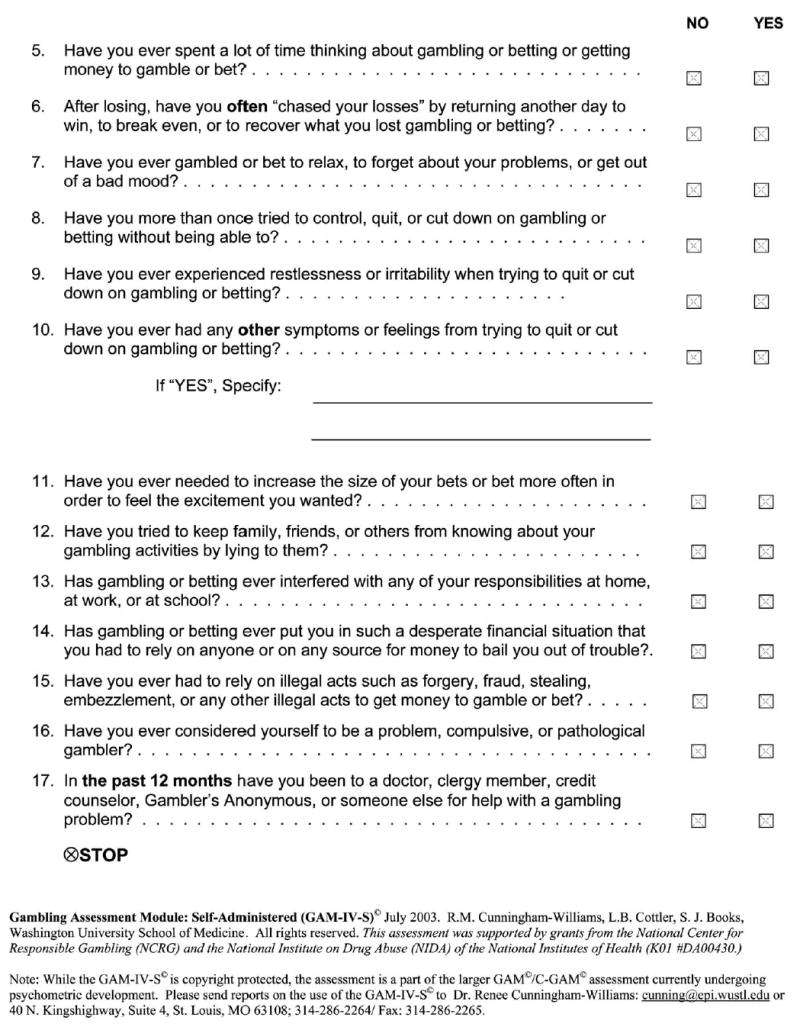
The self-administered DSM-IV Gambling Assessment Module (GAM-IV-S©; Cunningham-Williams et al., 2001) was developed for this survey to establish lifetime and current prevalence of gambling behaviors. The GAM-IV-S©, a member of a family of recently developed diagnostic gambling assessments for use in clinical and research settings, is a brief, 17-item self-administered assessment derived from the parent GAM© (Cunningham-Williams et al., 2003a,b), and includes the DSM-IV criteria. To assess gambling involvement in the SLPHL, the following introduction was used: The next few questions ask about your experiences with gambling, betting, and playing games for money or for something else of value. This could be at the casino, on the computer, at the track, on the street, at home, or any place else. The assessment then queries lifetime gambling or betting behavior that has occurred more than 5 times for 11 different types of gambling activity.
The GAM-IV-S© also includes non-diagnostic items such as the frequency of gambling during the heaviest gambling period, self-perceptions of being a problem gambler, and past 12-month help-seeking behavior for gambling problems. The internal consistency of the GAM-IV-S© criterion items was found to be excellent among gamblers in this sample (α = 0.86; n = 532); scoring of the diagnosis is based on a computer-derived algorithm. The parent GAM©, in its computerized format (C-GAM©; Cunningham-Williams et al., 2003a,b), is undergoing additional psychometric evaluation as a part of two on-going grants to the senior author (R.C-W) funded by the National Institute on Drug Abuse. The most updated version of the GAM-IV-S© is included inAppendix A (Cunningham-Williams et al., 2003a,b) which includes only a slight modification in the introduction, and order of activities, from the SLPHL Study version described above.
The prevalence of several other psychiatric disorders was estimated using the patient health questionnaire (PHQ; Spitzer et al., 1999). The PHQ is a self-report instrument that provides current diagnoses of several common psychiatric disorders. Sections of the PHQ incorporated into the survey included symptoms of: depression, anxiety, binge eating and alcohol abuse/dependence. The PHQ has been validated in studies using primary care patients and has shown good correspondence with clinician-administered interviews for any one or more PHQ diagnosis (κ = 0.65; overall accuracy, 85%; sensitivity, 75%; specificity, 90%; Spitzer et al., 1999). The SLPHL also includes a single item on the lifetime use of psychiatric medication and on a history of suicide attempts. Additionally, the SLPHL includes a section on cigarette smoking which assesses symptoms of tobacco dependence among persons smoking daily for at least 12 months.
Other correlates of gambling behavior discussed in this paper were derived from the revised version of the temperament and character inventory (TCI-R; Cloninger et al., 1994), which is a 240-item personality inventory with five-step response options that assesses personality on seven separate scales. The original version of the TCI was validated in both patient and general population samples; it exhibited an acceptable internal consistency and moderate to large correlations with personality disorder symptom counts (Svrakic et al., 1993). The revision to the TCI reflects an improvement in internal consistency and a change in the response scale (i.e., from true/false to Likert). The report on the validation of the TCI-R is in preparation. The TCI-R is scored on four temperament scales; labeled novelty-seeking (NS), harm-avoidance (HA), reward-dependence (RD), and persistence (PS); and three character scales labeled self-directedness (SD), cooperativeness (CO), and self-transcendence (ST) (Cloninger et al., 1993; Cloninger et al., 1994).
2.4. Statistical data analysis
All descriptive statistics, lifetime and current gambling prevalence and conditional prevalence were computed using SAS version 8.01 (SAS, 1999). As stated previously, these data were weighted to the 2000 US census based on geographic region, gender, and age categories. Weighted data are reported for all percentages with corresponding sample sizes. We report Wald-χ2 in all analyses testing bi-variate associations with gambling status due to the use of weighted data and rigorous estimates of variance. The multinomial logistic regression, using STATA release 7.0 (Stata Corporation, 2001) and post-stratification weights, was used to assess the likelihood of being in a gambling severity group by various socio-demographic, psychiatric, substance use, and personality trait correlates. Multinomial logistic regression, in which a backwards elimination variable selection procedure was performed, was used rather than ordered logistic regression, because the proportional odds assumption justifying ordered logistic regression was not met. These models were fit using weights, and all estimates of standard errors and hypothesis tests are adjusted for these weights. The adjustment for the weights used the Huber-White “sandwich estimator” method available in STATA. Five cases were excluded from analyses due to missing data on the gambling filter question, yielding a final sample size of 913.
3. Results
3.1. Lifetime prevalence of DSM-IV pathological gambling disorder
The sample was classified into four mutually exclusive groups (Table 1): Pathological Gamblers were gamblers who met DSM-IV criteria for pathological gambling disorder (PGD; 2.5%; n = 21); Sub-threshold gamblers reported between 1 and 4 lifetime DSM-IV criteria (12.4%; n = 107); Recreational gamblers did not meet any DSM-IV gambling criteria (42.9%; n = 404). The remainder of the sample were Non-gamblers who indicated that they never gambled or they gambled between 1 and 5 times in their lifetime (42.2%; n = 381).
Table 1.
Lifetime prevalence of DSM-IV PGD diagnosis and criteria among St. Louis area household residents
| Lifetime prevalence | Weighted percentage of total sample | Weighted percentage of gamblers only | Weighted percentage of gamblers with 1 + symptoms | |||
|---|---|---|---|---|---|---|
| Non-gamblers (n = 381) | 42.2% | – | – | |||
| Recreational gamblersa (0 criteria; n = 404) | 42.9% | 74.2% | – | |||
| Sub-threshold gamblers (1–4 criteria; n = 107) | 12.4% | 21.5% | 83.2% | |||
| Pathological gamblers (PGD; 5–10 criteria; n = 21) | 2.5% | 4.3% | 16.8% | |||
| DSM-IV PG criteria | Sub-thresholdb gamblers (n = 107)
|
PGDc(n = 21)
|
Odds ratio***
|
|||
| n | (Weighted %) | n | (Weighted %) | (95% CI) | ||
| Frequent preoccupation with gambling | 28 | (27) | 19 | (90) | 23.2 (4.8–112.3) | |
| Attempts to win back losses (“chasing”) | 43 | (43) | 20 | (96) | 30.1 (3.8–237.3) | |
| Gambling to escape a dysphoric mood | 52 | (46) | 19 | (90) | 10.7 (2.3–49.9) | |
| Repeated unsuccessful efforts to reduce/stop | 10 | (9) | 15 | (75) | 27.4 (8.1–92.2) | |
| Restlessness or irritability if unable to gamble | 3 | (3) | 14 | (70) | 66.3 (13.6–321.7) | |
| Increased size of bets or betting frequency to feel desired excitement | 23 | (23) | 13 | (64) | 6.0 (2.1–17.2) | |
| Lying to hide extent of gambling | 8 | (7) | 12 | (77) | 44.2 (12.1–161.1) | |
| Gambling/betting interfered with responsibilities at home, work, school | 5 | (6) | 12 | (61) | 26.9 (7.2–100.6) | |
| Relying on others for financial bail-out | 8 | (8) | 13 | (66) | 23.8 (7.2–78.4) | |
| Relying on illegal acts for gambling money | 2 | (2) | 3 | (23) | 12.8 (1.8–90.0) | |
Recreational gamblers = gamblers without DSM-IV pathological gambling criteria.
Sub-threshold = gamblers meeting 1-4 DSM-IV pathological gambling criteria.
PGD = gamblers meeting 5–10 criteria, thus being diagnosed with pathological gambling disorder.
All significant at the p < 0.001 level.
We further classified the sample into gamblers only (n = 532) and found the conditional prevalence rate of PGD to be 4.3%, and of sub-threshold gambling to be 21.5%. The remainder was recreational gamblers (74.2%). Among gamblers with one or more PGD symptoms, 16.8% met criteria for PGD.
3.2. Prevalence of DSM-IV PGD criteria
The percentage of sub-threshold gamblers and pathological gamblers (i.e., gamblers with PGD) is also shown in Table 1. Nearly all pathological gamblers chased losses (96%), were frequently pre-occupied with gambling (90%) or gambled as a way of escaping a dysphoric mood (90%). The remaining criteria were each endorsed by pathological gamblers at rates ranging between 61% and 75%. One notable exception was that less than one-quarter of pathological gamblers (23%) relied on illegal acts for gambling money. The criteria most frequently endorsed by sub-threshold gamblers were similar to those endorsed most frequently by pathological gamblers.
Among the criteria indicating the highest risk for being a pathological gambler (relative to being a sub-threshold gambler) was being restless or irritable when unable to gamble (OR = 66.3; p < 0.001), lying to hide the extent of gambling involvement (OR = 44.2; p < 0.001), and chasing losses (OR = 30.1; p < 0.001).
Not shown in Table 1, but clinically relevant to diagnostic criteria, was a pattern of “withdrawal-like” symptoms other than restlessness or irritability related to quitting gambling; over a quarter (28%) of pathological gamblers reported experiencing these symptoms compared to less than 1% of the sub-threshold gamblers. The GAM-IV-S© also elicits whether individuals actually consider themselves to be a “problem, compulsive, or pathological gambler”. While 64% of pathological gamblers accurately perceived themselves as such, only 1 in 5 of them actually sought help for a gambling problem. In contrast, less than 4% of sub-threshold gamblers had an accurate self-perceived gambling status, and less than 1% of them actually sought help.
3.3. Socio-demographics overall and by lifetime gambling status
The overall study sample (n = 913; Table 2) was 49% male; 75% Caucasian; 20% African-American; ranged in age from 18 to 92 years (mean = 44; SD = 16), most were married only one time (65%) and had additional education beyond high school (70%). Only 6% of the sample was jobless. The employed category included nearly 20% who were either a full-time student, retired, or working inside the home (i.e., a homemaker). Religious affiliation was primarily Christian. Over half of the sample (53%) attended church or religious services at least once or twice a month and 42% spent time in meditation or prayer (including scripture reading or private religious practice) at least several times a week in the past 6 months.
Table 2.
Demographic characteristics by GAM-IV-S© gambling status
| Full sample | Non-gamblers | Recreationala gamblers | Sub-thresholdb gamblers | PGDc | Wald-χ2d (df) | p | |
|---|---|---|---|---|---|---|---|
| n (Wtd. %) | n (%) | n (%) | n (%) | n (%) | |||
| 381 (42) | 404 (43) | 107 (12) | 21 (2.5) | ||||
| Gender | 41 (3) | <0.001 | |||||
| Male | 410 (49) | 117 (35) | 220 (59) | 61 (61) | 12 (54) | ||
| Female | 503 (51) | 264 (65) | 184 (41) | 46 (39) | 9 (46) | ||
| Race/ethnicity | 15 (6) | 0.002 | |||||
| African-American/Black | 135 (20) | 65 (23) | 42 (15) | 19 (22) | 8 (47) | ||
| Caucasian/White | 740 (75) | 294 (70) | 350 (82) | 83 (73) | 13 (53) | ||
| Other | 30 | (5) | 17 (7) | 9 (3) | 4 (5) | 0 (0) | |
| Mean age (SD) | 44 (16) | 42 (16) | 47 (16) | 45 (16) | 29 (12) | f = 6 (3) | <0.001 |
| Range | 18–92 | 18–89 | 18–92 | 18–81 | 18–63 | ||
| Number of times married | 27 (6) | <0.001 | |||||
| Zero | 137 (15) | 68 (24) | 37 (14) | 24 (29) | 8 (43) | ||
| One | 589 (65) | 235 (59) | 287 (68) | 58 (51) | 9 (43) | ||
| Two or more | 180 (20) | 75 (17) | 78 (18) | 23 (20) | 4 (14) | ||
| Education | 20 (6) | 0.002 | |||||
| <12 Years | 62 (7) | 31 (10) | 17 (4) | 10 (9) | 4 (17) | ||
| High school/GED only | 197 (23) | 89 (24) | 75 (19) | 25 (26) | 8 (41) | ||
| >12 years | 652 (70) | 261 (66) | 310 (77) | 72 (65) | 9 (42) | ||
| Employment status | 14 (3) | 0.008 | |||||
| Unemployed | 50 (6) | 22 (7) | 13 (4) | 10 (12) | 5 (23) | ||
| Employede | 859 (94) | 355 (93) | 391 (96) | 97 (88) | 16 (77) | ||
| Attended church/religious servicef | 491 (53) | 233 (60) | 206 (50) | 47 (42) | 5 (26) | 17 (3) | <0.001 |
| Prayed/meditatedg | 394 (42) | 184 (46) | 158 (37) | 44 (45) | 13 (34) | 6 (3) | 0.11 |
Recreational gamblers = gamblers without DSM-IV pathological gambling criteria.
Sub-threshold = gamblers meeting 1–4 DSM-IV pathological gambling criteria.
PGD = gamblers meeting 5–10 criteria, thus being diagnosed with pathological gambling disorder.
Wald-χ2 values were used to test the proportionality of the weighted percentages. For race/ethnicity, it was necessary to combine the “Other” and “African-American/Black” categories in order to avoid empty cells.
Includes students, homemakers, and retired workers.
Defined as at least “once or twice a month”.
Defined as “Several times a week or more frequent”.
Table 2 also shows the significant association of socio-demographic characteristics with gambling status. Gender was significantly associated with gambling status (χ2 = 41; df = 3; p < 0.001). Non-gamblers were primarily women (65%; n = 264) and each of the other groups were comprised primarily of men (recreational: 59%; sub-threshold = 61%; PGD = 54%). Race/ethnicity was also significantly associated with gambling status (χ2 = 15; df = 6; p = 0.002) in that 47% of the PGD group were African-American, yet less than one-quarter of the other groups were. Compared to the other groups, pathological gamblers were significantly younger on average with a mean age of 29 years (SD = 12; F = 6; df = 3; p = < 0.001), more often never married (43%; χ2 = 27; df = 6; p = < 0.001), were less educated (e.g., 17% of PGD had a HS education or less; χ2 = 20; df = 6; p = 0.002) and more likely to be jobless (23%; χ2 = 14; df = 3; p = 0.008). Private prayer/meditation was not significantly associated with gambling status. However, over half of the non-gamblers (60%) reported church or religious service attendance at least once or twice a month, with pathological gamblers (n = 26%) reporting the lowest attendance (χ2 = 17; df = 3; p = < 0.001).
3.4. Frequency and onset of gambling
Although not shown, most gamblers reported gambling or betting less than once a month (67%; n = 363). The frequency of gambling activity was significantly associated with the likelihood of gambling problems (χ2 = 211; df = 10; p < 0.001). Specifically, while 78% of recreational gamblers gambled less than once a month, 46% of sub-threshold gamblers and none of the pathological gamblers gambled that infrequently. In fact, 61% of pathological gamblers reported gambling at least three days per week or more in contrast to 12% of sub-threshold gamblers and 1.2% of recreational gamblers. The gambling groups did not differ significantly in their mean age of onset of the heaviest period of gambling (f = 0.24; df = 3; p = 0.89). About 40% of each of the groups began their period of heavy gambling between the ages of 21 and 34 years.
3.5. Lifetime prevalence of gambling and severity risk by gambling activity
The GAM-IV-S© assesses symptoms by 11 different gambling categories including slot/fruit machines, pari-mutuels and betting on the stock, options, or commodities market. Although not shown, the lifetime prevalence and corresponding odds ratios for gambling status varied significantly by gambling activity type. While there is no statistically significant difference in the mean number of different types of lifetime gambling activities when comparing the pathological gamblers (mean = 6.2; SD = 3.3) to either the sub-threshold gamblers (mean = 6.0; SD = 2.8; t = 0.29; df = 126; p = 0.77) or the recreational gamblers (mean = 5.1; SD = 2.7; t = −1.799; df = 423; p = 0.0726), there is a significant difference between the sub-threshold gamblers and the recreational gamblers (t = −3.04; df = 509; p = 0.002).
Gamblers participated in a variety of activities, with most activities being endorsed by nearly 50% of pathological gamblers, with the exception of pari-mutuels (39%). Over 75% of pathological and sub-threshold gamblers endorsed playing cards (81% and 76%, respectively) and video-display terminals (VDTs; 77% for both). While the majority of recreational gamblers also played cards (72%) and VDTs (64%), a lower proportion of them gambled on other activities, with the least amount of them endorsing betting on the stock, options, or commodities market (21%). In addition, the highest odds ratios for gambling problems were for bingo players and market bettors. Bingo players were nearly 3 times as likely as non-bingo players to be either sub-threshold gamblers (OR = 2.6, p < 0.001) or pathological gamblers (OR = 2.7, p = 0.04). Furthermore, gamblers who bet on the stock, options, or commodities market were 2.6 times as likely as non-market bettors to be sub-threshold gamblers (p < 0.001), but were 4.4 times as likely to be pathological gamblers (p = 0.002).
3.6. Psychiatric and substance use correlates by lifetime gambling status
Table 3 shows the association of psychiatric and substance use disorders with gambling status as measured by the PHQ. One indicator of a history of psychiatric problems is ever having taken a psychiatric medication. This was endorsed by nearly 40% of pathological gamblers but was not significantly related to gambling status. Although non-significant, the rates of both binge eating disorder and suicide attempts were higher among the sub-threshold (12% and 9%, respectively) and pathological gamblers (12% and 13%, respectively) compared with the other groups. However, there was a statistically significant association of gambling status with major depression (χ2 = 8; df = 3; p = 0.005), generalized anxiety (χ2 = 8; df = 3; p = 0.04), and thoughts of death or self-harm (χ2 = 9; df = 3; p = 0.03). Specifically, nearly 20% of pathological gamblers had problems with major depression (19%), anxiety (19%), and nearly 30% had thoughts of death or self-harm (29%). These disorder rates among pathological gamblers were between 2 and 5 times higher than rates among the other groups. Also, there was a statistically significant association of gambling status with symptoms of alcohol abuse/dependence (χ2 = 22; df = 3; p = < 0.001) and tobacco dependence (χ2 = 15; df = 3; p = 0.002). For example, all three gambling groups were comparable in their rates of alcohol abuse/dependence in the past 6 months (Rec = 25%; Sub = 29%; PGD = 26%), yet these rates were more than double the rate for non-gamblers (12%). Furthermore, sub-threshold and pathological gamblers had comparably higher rates of tobacco dependence (31% and 38%, respectively) than both recreational (19%) and non-gamblers (13%).
Table 3.
Psychiatric and substance use correlates by GAM-IV-S© gambling status
| Full sample | Full sample | Non-gamblers | Recreationala gamblers | Sub-thresholdb gamblers | PGDc | Wald-χ2d (df) | p |
|---|---|---|---|---|---|---|---|
| n (Wtd. %) | n (%) | n (%) | n (%) | n (%) | |||
| 381 (42) | 404 (43) | 107 (12) | 21 (2.5) | ||||
| PHQ | |||||||
| Major depression | 39 (4) | 19 (5) | 11 (3) | 6 (4) | 3 (19) | 8 | 0.005 |
| Ever taken psychiatric medicine | 268 (29) | 109 (26) | 117 (28) | 32 (29) | 7 (38) | 1 | 0.79 |
| Generalized anxiety | 42 (5) | 17 (5) | 13 (3) | 9 (6) | 3 (19) | 8 | 0.04 |
| Binge eating | 67 (7) | 24 (6) | 26 (7) | 13 (12) | 3 (12) | 6 | 0.09 |
| Thoughts of death/harm | 62 (7) | 26 (7) | 21 (6) | 10 (10) | 5 (29) | 9 | 0.03 |
| Suicide attempts | 54 (6) | 27 (7) | 15 (4) | 9 (9) | 3 (13) | 5 | 0.17 |
| Alcohol abuse/dependence | 175 (19) | 44 (12) | 98 (25) | 28 (29) | 5 (26) | 22 | <0.001 |
| Tobacco dependence | 177 (20) | 51 (13) | 84 (19) | 34 (31) | 8 (38) | 15 | 0.002 |
| TCI | Mean (SE) | Mean (SE) | Mean (SE) | Mean (SE) | F (df = 1) | ||
| Novelty seeking | −9 (5) | −2 (5) | 24 (10) | 105 (34) | 11 | 0.001 | |
| Harm avoidance | 9 (5) | −10 (5) | 1 (10) | 17 (31) | 1 | 0.34 | |
| Reward dependence | 9 (5) | −7 (5) | −2 (11) | −29 (24) | 2 | 0.18 | |
| Persistence | 0 (5) | −2 (5) | 14 (11) | −16 (28) | 0 | 0.87 | |
| Self-directedness | 7 (5) | 3 (5) | −25 (10) | −81 (26) | 14 | <0.001 | |
| Cooperativeness | 15 (5) | −6 (5) | −19 (11) | −80 (28) | 17 | <0.001 | |
| Self-transcendence | 11 (5) | −11 (5) | 5 (10) | −31 (22) | 2 | 0.21 | |
Recreational gamblers = gamblers without DSM-IV pathological gambling criteria.
Sub-threshold = gamblers meeting 1-4 DSM-IV pathological gambling criteria.
PGD = gamblers meeting 5–10 criteria, thus being diagnosed with pathological gambling disorder.
3.7. Personality traits by lifetime gambling status
Also explored were personality profiles by gambling status (Table 3). Of the seven scales assessed in the TCI, there were significant associations of gambling status with having a novelty-seeking temperament (F = 11; df = 1; p = 0.001), and having character traits of self-directedness (F = 14; df = 1; p < 0.001) and cooperativeness (F = 17; df = 1; p = <0.001). Specifically, for novelty-seeking, pathological gamblers (mean = 105; SE = 34) had significantly higher mean scores than any of the other groups. Also, self-directedness and cooperativeness exhibited associations of similar magnitudes, but in the opposite direction for sub-threshold gamblers (self-directedness mean = −25; SE=10; cooperativeness mean = −19; SD = 11) and for pathological gamblers (self-directedness: mean = −81; SE = 26; cooperativeness: mean = −80; SD = 28). None of the other personality traits were significantly associated with gambling status.
3.8. Predictors of gambling severity status
Table 4 shows two comparisons using multinomial logistic regression. Comparison I predicts gambling in the full sample and Comparison II predicts gambling among the gamblers only. In the full sample, Comparison I shows that males, compared to females, had a significantly greater likelihood of being either a recreational gambler (OR = 2.5; p = < 0.001) or a sub-threshold gambler (OR = 2.2; p = 0.003), but not a pathological gambler. There were no significant effects by race/ethnicity in either the full sample or among gamblers only. It appears that being in the younger age group (i.e., age 18–20) was protective against the risk for being a recreational gambler (ORrec = 0.1; p = < 0.001) or a sub-threshold gambler (OR = 0.2; p = 0.008), but not a pathological gambler. However, being in the 35–40 age group, compared to the oldest age group (i.e., age 50 and older), served as protective factor only for sub-threshold gambling (OR = 0.5; p = 0.02). There was a non-significant, yet strong protective trend for being a sub-threshold gambler for those ages 21–34. Those who were jobless (vs. those having a job or being either retired, full-time homemaker, or student) were 5.2 times as likely to be a pathological gambler in this sample (p = 0.03).
Table 4.
Multi-nominal logistic regression by GAM-IV-S© gambling status
| Comparison I: Predicting gambling status (in full sample)
|
Comparison II: Predicting gambling status (among gamblers only)
|
||||||||||||||
|---|---|---|---|---|---|---|---|---|---|---|---|---|---|---|---|
| Recreationala gamblers
|
Sub-thresholdb gamblers
|
Gamblers w/PGDc |
Sub-thresholdb gamblers
|
Gamblers w/PGDc |
|||||||||||
| OR | Range | p | OR | Range | p | OR | Range | p | OR | Range | p | OR | Range | p | |
| Male (vs. female) | 2.5 | (1.8–3.6) | <0.001 | 2.2 | (1.3–3.6) | 0.003 | 1.5 | (0.5–4.4) | 0.49 | 0.9 | (0.5–1.4) | 0.53 | 0.6 | (0.2–1.7) | 0.32 |
| Age (vs. 50 years+) | |||||||||||||||
| 18–20 | 0.1 | (0.0–0.4) | <0.001 | 0.2 | (0.0–0.6) | 0.008 | 0.1 | (0.0–1.3) | 0.08 | 1.3 | (0.3–6.1) | 0.71 | 1.0 | (0.1–10.9) | 0.99 |
| 21–34 | 0.7 | (0.5–1.2) | 0.21 | 0.5 | (0.2–1.0) | 0.06 | 0.5 | (0.1–2.6) | 0.40 | 0.7 | (0.3–1.3) | 0.26 | 0.6 | (0.1–3.5) | 0.61 |
| 35–49 | 0.9 | (0.6–1.3) | 0.55 | 0.5 | (0.3–0.9) | 0.02 | 2.4 | (0.5–10.7) | 0.26 | 0.6 | (0.3–1.0) | 0.05 | 2.7 | (0.6–12.0) | 0.20 |
| Unemployed (vs. employed) | 0.5 | (0.2–1.3) | 0.18 | 1.9 | (0.8–4.8) | 0.18 | 5.2 | (1.2–23.2) | 0.03 | 3.6 | (1.3–9.9) | 0.01 | 9.9 | (2.2–45.1) | 0.003 |
| Regular church attendance (vs. not) | 0.7 | (0.5–0.9) | 0.02 | 0.5 | (0.3–0.8) | 0.003 | 0.2 | (0.1–0.6) | 0.009 | 0.7 | (0.4–1.1) | 0.13 | 0.3 | (0.1–0.9) | 0.04 |
| Psychiatric/substance use disorders | |||||||||||||||
| Alcohol use disorder | 1.9 | (1.2–3.0) | 0.008 | 1.9 | (1.0–3.5) | 0.05 | 0.5 | (0.1–2.2) | 0.37 | 1.0 | (0.6–1.8) | 0.99 | 0.3 | (0.1–1.2) | 0.08 |
| Tobacco dependence | 1.3 | (0.8–2.0) | 0.33 | 2.1 | (1.2–3.8) | 0.01 | 3.3 | (0.9–12.0) | 0.06 | 1.7 | (1.0–2.9) | 0.06 | 2.7 | (0.8–9.2) | 0.12 |
| TCI personality traits | |||||||||||||||
| Novelty seeking | 1.1 | (0.9–1.3) | 0.53 | 1.4 | (1.0–1.8) | 0.03 | 4.3 | (2.1–8.5) | <0.001 | 1.3 | (1.0–1.7) | 0.05 | 4.0 | (2.0–8.0) | <0.001 |
Recreational gamblers = gamblers without DSM-IV pathological gambling criteria.
Sub-threshold = gamblers meeting 1–4 DSM-IV pathological gambling criteria.
PGD = gamblers meeting 5–10 criteria, thus being diagnosed with pathological gambling disorder.
Regular prayer or meditation was not significantly related to gambling status, however, regular church attendance was. For example, attending church or religious services 1–2 times per month (vs. attending less often) was a protective factor for being a gambler of any kind (ORrec = 0.7; p = 0.02; ORsub = 0.5; p = 0.003; ORPGD = 0.2; p = 0.009).
Alcohol and tobacco were the only symptoms of psychiatric or substance use disorders significantly related to gambling status in this model. Those with symptoms of alcohol abuse/dependence (vs. those without symptoms) were nearly twice as likely to be either recreational gamblers (OR = 1.9; p = 0.008) or sub-threshold gamblers (OR = 1.9; p = 0.05), but were statistically no more likely than those without symptoms to be pathological gamblers. Also, those with symptoms of tobacco dependence were twice as likely as those without symptoms to be sub-threshold gamblers (OR = 2.1; p = 0.01) and there was a strong, yet non-significant trend for increased risk for pathological gambling in this sample.
In terms of personality traits, the only trait statistically significantly associated with gambling status was having a novelty-seeking temperament. Those who were higher on novelty-seeking (vs. lower) were 1.4 times as likely to be sub-threshold gamblers (p = 0.03) and 4.3 times as likely to be pathological gamblers (p = < 0.001).
In Comparison II of gamblers only, there was one statistically significant protective factor in this model, amely regular church attendance. Specifically, attending church or religious services regularly was a protective factor for being a pathological gambler (OR = 0.3; p = 0.04). In terms of risk factors, there were two statistically significant risk factors in this model: employment status and having a novelty-seeking personality trait. Specifically, gamblers who were jobless (vs. not jobless) were 3.6 times more likely to be sub-threshold gamblers (p = 0.01) and 9.9 times more likely to be pathological gamblers (p = 0.003). Also, compared to their counterparts, those with higher novelty-seeking scores were 1.3 times as likely to be sub-threshold gamblers (p = 0.05) and 4.0 times as likely to be pathological gamblers (p < 0.001). There were no other significant protective or risk factors in this model; however, there were two strong trends for sub-threshold gambling. For example, for sub-threshold gambling, there was a strong protective trend for those gamblers ages 35–49 (vs. gamblers age 50 or older; OR = 0.6; p = 0.056) and also a strong trend for increased risk for gamblers with symptoms of tobacco dependence (vs. without symptoms; OR = 1.7; p = 0.06).
4. Discussion
This paper aimed to report, for the first time, the prevalence of sub-threshold and pathological gambling disorder (PGD) in a household sample of St. Louis area residents in the context of increased legal gambling opportunities available in the area. We also aimed to identify significant risk and protective factors for sub-threshold gambling and PGD.
Before discussing the findings, it is important to offer a caveat regarding potential biases that might be introduced with less than ideal response rates. The 28% net response rate among individuals invited to participate in the SLPHL study is typical of recent studies using telephone or postal data collection methods (Miller and Kobayashi, 2001), however, it is lower than typical response rates for face-to-face interviews (Tourangeau, 2004). Given that only 7% of our sample did not complete high school compared with 16% of individuals within the geographic sampling frame from the 2000 US census, there is a suggestion that there is an under-representation of those from the lowest socioeconomic strata. In spite of this limitation, however, we can safely conclude that these data are likely generalizable to community-dwelling and non-indigent populations; however, additional research is needed to replicate these findings with clinical and economically disadvantaged samples to ensure their overall generalizability.
Gambling was examined within a larger study of health and personality and was found to be highly prevalent (57.8%). While this prevalence is comparable to the lifetime prevalence of gambling in the earlier ECA study of St. Louis area residents (50.7%, Cunningham-Williams et al., 1998), the ECA study used a lower threshold to determine lifetime gambling (i.e., two or more times compared with the current threshold of six or more times). This number is also lower than rates commonly reported in national studies (Gerstein et al., 1999; Welte et al., 2002), but this might be attributable to the fact that we used a higher threshold for lifetime gambling. For example, in the national study reporting an 86% lifetime gambling rate, a threshold of gambling of at least one time in life was used (Gerstein et al., 1999).
Despite the lower overall gambling prevalence rate in this study, the lifetime rate of PGD (i.e., 5–10 DSM-IV criteria) is comparable to other studies reporting rates around 1–2% (APA, 1994; Volberg, 1994; Cunningham-Williams et al., 1998; Shaffer and Hall, 1997; NRC, 1999;Gerstein et al., 1999; Welte et al., 2002). Moreover, the 14.9% rate of problem gambling (PGD and sub-threshold gambling combined) is much higher than that reported in the ECA study (9.2%) which was conducted prior to the legalization of the Missouri lottery and of casino gambling in the area. The specific DSM-IV PGD criteria that were endorsed the most frequently, and those criteria that most distinguished pathological gamblers from sub-threshold gamblers, are also comparable to other find-ings in the literature (Cunningham-Williams et al., 2000).
Another major finding is the variation in the mean number and types of activities engaged in by gamblers in this study. For example, we found on average that sub-threshold gamblers endorsed a significantly greater variety of activities compared to recreational gamblers, and these games (e.g., slot/fruit machines, VDTs, lottery or lottery games, and pari-mutuels) were related to increased risk of being a sub-threshold gambler. Furthermore, the type of activity that increased risk for PGD in this sample was limited to playing bingo for money and betting on the stock, options, or commodities market. Several of these activities have also been reported as preferential by treatment-seeking problem gamblers (Griffiths et al., 1999; Morgan et al., 1996).
In terms of risk and protective factors, we found variations in socio-demographic factors depending on whether the outcome was being a gambler (irrespective of gambling problems) or more problematic gambling behavior and also whether the sample included everyone, or was restricted to gamblers only. For example, in Comparison I, in the overall sample, we found that younger age (i.e., age 18–20) was a protective factor for being a recreational or sub-threshold gambler. This may be due to the age restrictions (i.e., 21 and older) for most legal gambling opportunities in the area. On the other hand, male gender was a risk factor in the overall sample, but not when the sample was classified as gamblers only in Comparison II, as the demographic factor of most importance in this model was joblessness. The significant bi-variate association of race/ethnicity with gambling status is consistent with other reports using general population samples (Cunningham-Williams et al., 1998; Welte et al., 2002) and drug abusing samples (Cunningham-Williams et al., 2000); however, this association did not remain significant in the final multinomial model.
We also found that of the psychiatric and substance use problems associated at the bi-variate level with gambling status, only alcohol abuse/dependence and tobacco dependence remained significant in the final model. These correlates have also been linked to gambling problems and PGD in the general population (Smart and Ferris, 1994; Cunningham-Williams et al., 1998; Bland et al., 1993) and also in samples selected for their co-occurring psychiatric or substance use conditions (Crockford and el-Guebaly, 1998; Daghestani et al., 1996; Cunningham-Williams et al., 2000; Ibanez et al., 2001). Our findings of 4% for major depression is smaller, yet comparable to the 7.17% (12-month rate) for the US reported recently in the 2001–2002 National Epidemiologic Survey on Alcohol and Related Conditions (NESARC; Grant et al., 2004) and the 6.6% 12-month rate reported in the National Comorbidity Survey Replication (NCS-R; Kessler et al., 2003). Similarly, our 5% generalized anxiety disorder rate is larger yet comparable to the 2.07% rate reported in the NESARC study. Our study found rates of alcohol use disorder substantially higher than the 8.5% rate in NESARC, yet our tobacco dependence rate is more comparable to national rates of 24% reported in the NCS (Breslau et al., 2001). A major limitation in the comparison of our findings to those reported in these national studies is the fact that we measured psychiatric and substance use disorders using different assessments, more recent reporting time periods, and different sampling methodology than these general population studies.
Those most at risk in this sample also tended to have personality traits (i.e., high novelty-seeking temperament), and character styles indicating immature development (i.e., low cooperativeness and low self-directedness) that have been more commonly linked in the literature to substance abuse (Barnes et al., 2002; Howard et al., 1997; Cloninger, 1999) and cluster B personality disorder criteria (Svrakic et al., 1993; Mulder et al., 1999; Casey and Joyce, 1999). Notably, even after controlling for other variables, having a temperament characterized by high novelty-seeking remained as an important predictor variable for sub-threshold gambling and PGD in both the overall sample and also among gamblers only. Unlike the predominate role of novelty-seeking with PGD in the current study, the impact of novelty-seeking in other studies on alcoholism and substance abuse is nearly comparable to the impact of self-directedness (Cloninger, 1999). Thus, it is plausible that individuals with alcohol and drug problems are more personality disordered than are those with gambling problems and PGD. Additionally, it is possible that gambling behavior may follow trends similar to that of smoking behavior. For instance, in the case of smoking, there was a temporal shift, prior to 1950, from associations with higher cooperativeness and self-directedness scores to lower scores attributable to the increased public awareness of the associated morbidity from smoking after 1950 (Cloninger, 1999). We may find that as recognition about problem gambling increases, it too will become more associated with lower character development. Nevertheless, more research exploring temperament and character traits among gamblers is warranted to further illuminate these relationships.
Conclusions about the etiology of gambling behavior are limited in this study given the lack of information about the ages of onset of associated risk and protective factors. For example, we inquired about current employment status and lifetime PGD. It is unclear the number of cases where PGD actually preceded the occurrence of joblessness. Similarly, it is unclear whether PGD served as a “substitution” for substance use disorders that have abated. This notwithstanding, the available data illustrating the strong associations with increased risk, alerts public health workers to the importance of effectively screening for these issues, particularly among gamblers who are sub-threshold for meeting full PGD criteria.
Also, given the predominate relationship of novelty-seeking and joblessness to risk for PGD (as well as to risk for other disorders such as substance abuse) in this sample; it is critical to identify these populations for appropriate targeted prevention messages, especially among males and those who are jobless.
Additional research is needed to understand the role of certain types of gambling on the risk for PGD in the general population. These data have indicated that certain gambling activities are associated with risk for PGD, while others are associated with those who are sub-threshold for PGD. However, the underlying reasons for these distinctions among problem gamblers remain unclear. In other words, why do some gambling activities increase ones’ risk for both sub-threshold gambling and PGD, while others increase risk for sub-threshold gambling only? In contrast, choice of gambling activity may not be a causative factor at all; in fact, it may merely be a symptom of the progression of PGD.
Finally, these findings need to be replicated, using various data collection methods, in a national sample and also within communities that distinguish themselves by the extent of legal gambling available and the length of their presence in the community. Such information is critical in future efforts to understand the etiology, dimensionality, and manifestations of problematic gambling in order to more effectively screen gamblers for targeted public health prevention messages and appropriately design interventions for those at-risk for PGD.
Acknowledgments
National Institute on Drug Abuse of the National Institutes of Health (#K01 000430 to R.M. Cunningham-Williams; #K01 DA16618 to R.A. Grucza; #T32 DA07313 to S.B. Womack, former NIDA trainee; L. Cottler, PI); National Institute of Mental Health of the National Institutes of Health (#T32 MH17104 to R.A. Grucza, former trainee; L. Cottler, PI); Center for Psychobiology of Personality (C.R. Cloninger, Director).
Appendix A. Gambling assessment module: self administered (GAM-IV-S)
References
- American Psychiatric Association. 4th ed. (DSM-IV) Washington (DC): American Psychiatric Association; 1994. Diagnostic statistical manual of mental disorders. [Google Scholar]
- Battaglia M, Przybeck TR, Bellodi L, Cloninger CR. Temperament dimensions explain the comorbidity of psychiatric disorders. Comprehensive Psychiatry. 1996;37(4):292–8. doi: 10.1016/s0010-440x(96)90008-5. [DOI] [PubMed] [Google Scholar]
- Barnes GE, Murray MP, Patton D, Bentler PM, Anderson RE. Dordrecht/New York: Kluwer Academic Publishers/Plenum Press; 2002. The addiction-prone personality. [Google Scholar]
- Bland RC, Newman SC, Orn H, et al. Epidemiology of pathological gambling in Edmonton. Canadian Journal of Psychiatry. 1993;38:108–12. doi: 10.1177/070674379303800207. [DOI] [PubMed] [Google Scholar]
- Breslau N, Johnson EO, Hiripi E, Kessler R. Nicotine dependence in the United States: prevalence, trends, and smoking persistence. Archives of General Psychiatry. 2001;58(9):810–6. doi: 10.1001/archpsyc.58.9.810. [DOI] [PubMed] [Google Scholar]
- Casey JE, Joyce PR. Personality disorder and the temperament and character inventory in the elderly. Acta Psychiatrica Scandinavica. 1999;100(4):302–8. doi: 10.1111/j.1600-0447.1999.tb10865.x. [DOI] [PubMed] [Google Scholar]
- Cloninger CR. A systematic method for clinical description and classification of personality variants: a proposal. Archives of General Psychiatry. 1987;44:573–88. doi: 10.1001/archpsyc.1987.01800180093014. [DOI] [PubMed] [Google Scholar]
- Cloninger CR. The genetics of substance abuse. In: Galanter M, Kleber HD, editors. Textbook of substance abuse treatment. 2nd ed. Washington (DC): American Psychiatric Press; 1999. pp. 59–66. [Google Scholar]
- Cloninger CR, Svrakic DM, Przybeck TR. A psychobiological model of temperament and character. Archives of General Psychiatry. 1993;50(12):975–90. doi: 10.1001/archpsyc.1993.01820240059008. [DOI] [PubMed] [Google Scholar]
- Cloninger CR, Przybeck TR, Svrakic DM, Wetzel RD. St. Louis (MO): Center for Psychobiology of Personality. Washington University; 1994. The temperament and character inventory (TCI): a guide to its development and use. [Google Scholar]
- Cottler LB, Cunningham-Williams RM. The 11 year incidence of gambling problems among drug users recruited from the St. Louis ECA study The Wager. 2000;5:1–2. [Google Scholar]
- Crockford DN, el-Guebaly N. Psychiatric comorbidity in pathological gambling: a critical review. Canadian Journal of Psychiatry. 1998;43:43–50. doi: 10.1177/070674379804300104. [DOI] [PubMed] [Google Scholar]
- Cunningham-Williams RM, Cottler LB, Compton WM, Spitznagel EL. Taking chances: problem gambling and mental health – results from the St. Louis epidemiologic catchment area (ECA) study. American Journal of Public Health. 1998;88:1093–6. doi: 10.2105/ajph.88.7.1093. [DOI] [PMC free article] [PubMed] [Google Scholar]
- Cunningham-Williams RM, Cottler LB, Compton WM, Spitznagel EL, Ben-Abdallah A. Problem gambling and comorbid psychiatric and substance use disorders among drug users recruited from drug treatment and community settings. Journal of Gambling Studies. 2000;16(4):347–75. doi: 10.1023/a:1009428122460. [DOI] [PubMed] [Google Scholar]
- Cunningham-Williams RM, Cottler LB. The epidemiology of pathological gambling. Seminars in Clinical Neuropsychiatry. 2001;6(3):155–66. doi: 10.1053/scnp.2001.22919. [DOI] [PubMed] [Google Scholar]
- Cunningham-Williams RM, Cottler LB, Books SJ. St. Louis (MO): Washington University School of Medicine; Jul, 2001. Gambling assessment module – self-administered (GAM-IV-S©) revised July; 2003. [Google Scholar]
- Cunningham-Williams RM, Cottler LB, Compton WM, Books SJ. St. Louis (MO): Washington University School of Medicine; Sep, 2003. Gambling assessment module (GAM©) [Paper–pen version]. [Google Scholar]
- Cunningham-Williams RM, Cottler LB, Compton WM, Books SJ. St. Louis (MO): Washington University School of Medicine; Sep, 2003. Computerized gambling assessment module (C-GAM©) [Google Scholar]
- Daghestani AN, Elenz E, Crayton JW. Pathological gambling in hospitalized substance abusing veterans. Journal of Clinical Psychiatry. 1996;57:360–3. [PubMed] [Google Scholar]
- Gerstein D, Murphy S, Toce M, Hoffman J, et al. Chicago (IL): National Opinion Research Center (NORC); 1999. Gambling impact and behavior study: final report to the National Gambling Impact Study Commission. [Google Scholar]
- Grant BF, Stinson FS, Dawson DA, Chou SP, Dufour MC, Compton W, Pickering RP, Kaplan K. Prevalence and co-occurrence of substance use disorders and independent mood and anxiety disorders: results from the National Epidemiologic Survey on Alcohol and Related Conditions. Archives of General Psychiatry. 2004;61:807–16. doi: 10.1001/archpsyc.61.8.807. [DOI] [PubMed] [Google Scholar]
- Griffiths MD, Scarfe A, Bellringer P. The UK nation telephone gambling hotline-results on the first year of operation. Journal of Gambling Studies. 1999;15(1):83–90. doi: 10.1023/a:1023071113879. [DOI] [PubMed] [Google Scholar]
- Grucza RA, Cloninger CR. Comorbidity and personality: personality traits as potential risk factors for multiple common psychiatric disorders. Presented at the 9th meeting of the international federation of psychiatric epidemiology; Edmonton, Alberta. May, 2002. [Google Scholar]
- Howard MO, Kivlahan D, Walker RD. Cloninger’s tridimensional theory of personality and psychopathology: applications to substance use disorders. Journal of Studies of Alcohol. 1997;58(1):48–66. doi: 10.15288/jsa.1997.58.48. [DOI] [PubMed] [Google Scholar]
- Ibanez A, Blanco C, Donahue E, Lesieur HR, de Castro IP, Fernandez-Piqueras J, Saiz-Ruiz J. Psychiatric comorbidity in pathological gamblers seeking treatment. The American Journal of Psychiatry. 2001;158(10):1733–5. doi: 10.1176/ajp.158.10.1733. [DOI] [PubMed] [Google Scholar]
- Kallick MD, Suits T, Deilman T, et al. Research report series. Survey Research Center, Institute for Social Research. Ann Arbor (MI): University of Michigan Press; 1979. A survey of American gambling attitudes and behavior. [Google Scholar]
- Kessler RC, Berglund P, Demler O, Jin R, Koretz D, Merikangas KR, Rush AJ, Walters EE, Wang PS. The epidemiology of major depressive disorder: results from the national comorbidity survey replication (NCS-R) JAMA-Journal of the American Medical Association. 2003;289(23):3095–105. doi: 10.1001/jama.289.23.3095. [DOI] [PubMed] [Google Scholar]
- Kidman R. Personality traits of a pathological gambler. The Wager. 2002;7(24):1–3. [Google Scholar]
- Kim SW, Grant JE. Personality dimensions among pathological gambling disorder and obsessive-compulsive disorder patients. Psychiatry Research. 2001;104:205–12. doi: 10.1016/s0165-1781(01)00327-4. [DOI] [PubMed] [Google Scholar]
- Lesieur HR, Blume SB. Characteristics of pathological gamblers identified among patients on a psychiatric admissions service. Hospital and Community Psychiatry. 1990:1009–12. doi: 10.1176/ps.41.9.1009. [DOI] [PubMed] [Google Scholar]
- Lesieur HR, Heineman M. Pathological gambling among youthful multiple substance abusers in a therapeutic community. British Journal of Addiction. 1988;83:765–71. doi: 10.1111/j.1360-0443.1988.tb00509.x. [DOI] [PubMed] [Google Scholar]
- Lesieur HR, Blume SB, Zoppa RM. Alcoholism, drug abuse, and gambling. Alcohol and Clinical and Experimental Research. 1986;10:33–8. doi: 10.1111/j.1530-0277.1986.tb05610.x. [DOI] [PubMed] [Google Scholar]
- Miller TI, Kobayashi M. The voice of the public: why citizen surveys work? Public Management. 2001;83(4):6–9. [Google Scholar]
- Morgan T, Kofoed J, Buchkoski J, Carr RD. Video lottery gambling: effects on pathological gamblers seeking treatment in South Dakota. Journal of Gambling Studies. 1996;12(4):451–60. doi: 10.1007/BF01539188. [DOI] [PubMed] [Google Scholar]
- Mulder RT, Joyce PR, Sullivan PF, Bulik CM, Carter FA. The relationship among three models of personality psychopathology: DSM-III-R personality disorder, TCI scores and DSQ defenses. Psychological Medicine. 1999;29(4):943–51. doi: 10.1017/s0033291799008533. [DOI] [PubMed] [Google Scholar]
- Washington (DC): National Academy of Sciences; National Research Council (NRC), 1999. Pathological gambling: a critical review. [Google Scholar]
- Robins LN, Regier D. New York (NY): Free Press; 1991. Psychiatric disorders in America: the epidemiologic catchment area study. [Google Scholar]
- Robins LN, Cottler LB, Compton WM, et al. Washington University School of Medicine, Department of Psychiatry; 1997. The National Institute of Mental Health Diagnostic Interview Schedule (DIS). Version 4.0. [Google Scholar]
- Robins LN, Helzer JE, Croughan J, et al. The NIMH DIS: its history, characteristics and validity. Archives of General Psychiatry. 1981;38:381–9. doi: 10.1001/archpsyc.1981.01780290015001. [DOI] [PubMed] [Google Scholar]
- SAS Institute, Inc. Cary (NC): SAS Institute, Inc.; Oct, 1999. Statistical analyses system (SAS), version 8.01. [Google Scholar]
- Stata Corporation. College Station (TX): Stata Corporation; 2001. Stata statistical software: Release 7.0. [Google Scholar]
- Shaffer HJ, Hall MN. Boston (MA): President and Fellows of Harvard College; 1997. Estimating the prevalence of disordered gambling behavior in the United States and Canada: a meta-analysis. [Google Scholar]
- Smart RG, Ferris J. Alcohol, drugs and gambling in the Ontario adult population. Canadian Journal of Psychiatry. 1994;41:36–45. doi: 10.1177/070674379604100109. [DOI] [PubMed] [Google Scholar]
- Spunt B, Lesieur HR, Hunt D, Cahill L. Gambling among methadone patients. International Journal of the Addictions. 1995;30:929–62. doi: 10.3109/10826089509055821. [DOI] [PubMed] [Google Scholar]
- Steinberg MA, Kosten TA, Rounsaville BJ. Cocaine abuse and pathological gambling. The American Journal of Addictions. 1992;1(2):121–32. [Google Scholar]
- Spitzer RL, Kroenke K, Williams JB. Validation and utility of a self-report version of PRIME-MD: the PHQ primary care study. Journal of the American Medical Association. 1999;282(18):1737–1744. doi: 10.1001/jama.282.18.1737. [DOI] [PubMed] [Google Scholar]
- Svrakic DM, Whitehead C, Przybeck TR, Cloninger CR. Differential diagnosis of personality disorders by the seven-factor model of temperament and character. Archives of General Psychiatry. 1993;50(12):991–9. doi: 10.1001/archpsyc.1993.01820240075009. [DOI] [PubMed] [Google Scholar]
- Tourangeau R. Survey research and societal change. Annual Review of Psychology. 2004;55:775–801. doi: 10.1146/annurev.psych.55.090902.142040. [DOI] [PubMed] [Google Scholar]
- Volberg R. The prevalence and demographics of pathological gamblers: implications for public health. American Journal of Public Health. 1994;84:237–41. doi: 10.2105/ajph.84.2.237. [DOI] [PMC free article] [PubMed] [Google Scholar]
- Welte JB, Barnes GM, Wieczorek WF, et al. Gambling participation in the US – results from a national survey. Journal of Gambling Studies. 2002;18:313–37. doi: 10.1023/a:1021019915591. [DOI] [PubMed] [Google Scholar]