

Abstract
This study was to evaluate the effects of thalidomide on expression of adhesion molecules in liver cirrhosis. The cirrhosis was induced in Wistar rats by intraperitoneal injection of CCl4, and thalidomide (10 mg/kg/day or 100 mg/kg/day) was given by intragastric administration for 8 weeks. Liver histopathology and immunohistochemistry were significantly improved and the expressions of ICAM-1, VCAM-1, E-selectin, and TNF-α mRNA and protein were decreased significantly in rats treated with a high dose of thalidomide. Close positive correlation was observed in the expression of the TNF-α mRNA and that of ICAM-1, VCAM-1, and E-selectin mRNA, respectively. These results indicate that thalidomide exerts its effect on the downregulation of adhesion molecules via TNF-α signaling pathway to inhibit liver fibrosis.
INTRODUCTION
Adhesion molecules are proteins expressed on a variety of cells, which mediate the interaction between endothelial cells with lymphocytes, monocytes, and leukocytes [1].
Intercellular adhesion molecule-1 (ICAM-1) and vascular cellular adhesion molecule-1 (VCAM-1), two members of the immunoglobulin supergene family, play key roles in promoting migration of immunological cells from the circulation to target site in the inflammatory state [2, 3]. Girón-González et al reported that endothelial activation plays an active role in modifications of the circulatory status of cirrhotic patients, then de novo expression of ICAM-1 and VCAM-1 on endothelial cells mediates the transmigration of inflammatory cells, which induce inflammation and tissue damage in liver [4]. Up-regulated ICAM-1 or VCAM-1 expression in chronic liver disease has been reported in several studies, suggesting that they may play roles in the pathogenesis of chronic hepatitis or cirrhosis [5– 12]. The selectin family of cell adhesion molecules is generally thought to promote inflammatory reactions by facilitating leukocyte recruitment [13]. High levels of soluble E-selectin have been reported in acute and chronic inflammatory disorders. Cervello et al reported that high serum levels of soluble E-selectin are associated with chronic hepatitis and liver cirrhosis, especially in the liver cirrhosis patients soluble E-selectin decreased with disease severity according to the Child-Pugh classification [14].
Thalidomide was withdrawn from the world market in the early 1960s for its well-known tragic teratogenic effects. But in recent years, many clinical trials have validated its clinical utility in treatment of various hematologic malignancies such as multiple myeloma and solid tumors, and a variety of inflammatory and autoimmune diseases on the basis of its important effects on inflammation, regulation of immunological reaction and angiogenesis [15, 16]. Thalidomide targets leukocytes, endothelial cells, and keratinocytes, affecting them in different manners and at different cellular levels. Changes in the density of adhesion molecules alter leukocyte extravasation and the inflammatory response in the tissue involved [17]. Settles et al reported that thalidomide can significantly reduce cell adhesion molecule expression such as ICAM-1 and LFA-1 in human T leukemic (CEM) cells and human umbilical vein endothelial cells (HUVEC) and cell adhesion between them [18]. Whether the down-regulation of adhesion molecules by thalidomide can be used in the treatment of liver fibrosis has not been reported yet.
The aim of this study is to investigate the changes of expression of adhesion molecules such as ICAM-1, VCAM-1, and E-selectin in the carbon tetrachloride induced cirrhosis treated with thalidomide, and to analyze its mechanism.
MATERIALS AND METHODS
Animals
Sixty male Wistar rats, four to five weeks old, weighing 85–95 g (obtained from Center of Experimental Animal of Hubei Academy of Medical Sciences) were used. The rats were housed in a temperature and humidity-controlled environment, and they were fed rat chow and water ad libitum throughout the study period
Experimental design
The work was performed in accordance with the principles of the 1983 Declaration of Helsinki and with the approval of the ethics committee of Wuhan University. The rats were randomly divided into four groups (each group, n = 15) as follows: normal control group, model group, group treated with low dose of thalidomide, group treated with high dose of thalidomide. The rats in model group and therapeutic groups were intraperitoneally injected with carbon tetrachloride (CCl4) (16.67% in peanut oil) three times a week for 8 weeks to induce liver cirrhosis, and the rats in normal control group only received peanut oil by intraperitoneal injection. Thalidomide was dissolved in normal saline to prepare different concentration (.1% and 1%). Thalidomide (10 mg/kg/day or 100 mg/kg/day) was given by intragastric administration in the two therapeutic groups, respectively, for 8 weeks, meanwhile the rats in the normal control group and model group were given the vehicle (normal saline) for 8 weeks. All the rats were sacrificed at the end of the eighth week. 5 ml vein blood was obtained from the right ventricle of heart while the rat was under ether anaesthesia, and was stored in −80°C. Liver tissue from the right lobe was fixed by 40 gL formaldehyde, embedded by paraffin and continual sections were taken, rest of the liver was preserved at −80°C
Pathological examination
Two pathologists did the pathological examination independently after staining the sections of the liver with hematoxy-lin-eosin (HE) staining method and Masson trichrome staining method.
The Knodell hepatitis activity index (HAI) was used to grade the severity of the inflammation activity and fibrosis in liver. It was composed of four independent scores as follows: periportal necrosis with or without bridging necrosis (0–10), intralobular degeneration and focal necrosis (0–4), portal inflammation (0–4), and fibrosis (0–4).
Serum assay
The serum was obtained by centrifugation of rat blood at 1500 rmp/min for 15 minutes. Then alanine aminotransferase (ALT), aspartate aminotransferase (AST), prealbumin (PA), albumin (ALB), and globulin (GLB) were detected by biochemical analysis. Hyaluronic acid (HA), laminin (LN), procollagen Type III, (PCIII), and collagen Type IV (C IV) were detected by radioimmunoassay.
Immunohistochemistry staining of ICAM-1, VCAM-1, and E-selectin
The expression of markers was detected using the three-step streptavidin-biotin immunoperoxidase method. Briefly, after tissue sections were deparaffinized and rehydrated, they were heated in microwave oven for 10 minutes to enhance antigen retrieval. Slides were then incubated for 10 minutes with 3% H2O2 to inactivate endogenous peroxidase activity. Following a 20-minute blocking step with 5% normal goat serum diluted in phosphate-buffered saline (.01% PBS), the primary antibodies (ICAM-1, Santa Cruz, Calif, USA; VCAM-1 and E-selectin, Bosider, Wuhan, China) were applied and incubated for 2 hours in a moisture chamber at 37°C. After treating with biotinylated hircine anti-mouse (or rabbit) IgG and avidin for 30 minutes each at 37°C, diaminobenzidine 1 mg/ml in PBS containing .03% hydrogen peroxide was applied as the chromogen. Sections were counterstained with hematoxylin for 15 seconds. For each antibody, negative control studies were performed in which PBS was used instead of primary antibody.
The cytoplasm or membrane of the positive cell was stained brown and yellow. The sections were observed under the Olympus microscope by two pathologists independently. No less than 5 high power fields (400 multiples) and no less than 1000 cells were counted. Then the percentage of positive cells was recorded.
Western blot analysis
Frozen tissue was homogenized in 1 ml of ice-cold lysis buffer (10 mM Tris-Hcl. PH 7.5, 10 mM Nacl, .1 mM EDTA, .5% Triton-X, .02% NaN3, .2 mM phenylmethylsulfonyl fluoride). After incubation for 30 minutes on ice, the homogenate was centrifuged at 16000 g for 30 minutes at 4°C, the supernatant transferred to a new tube. Protein concentration was determined using Bradford method with BSA as standard. Total proteins (30 μg) were electrophoresed through standard 12% SDS-PAGE in Tris-glycine electrophoresis buffer [25 mm Tris, 192 mM glycine (pH 8.3), and .1% SDS] and blotted onto nitrocellulose membrane in transferring buffer [380 mM glycine, 50 mM Tris (pH 8.3) and 20% methanol] at 80 mA for 2 hours in a water-cooled transfer apparatus. The membrane was pre-incubated in blocking buffer (TBS containing 5% nonfat dried milk) for 2 hours at room temperature and then probed with a primary antibody (1 : 200 diluted in the blocking buffer) for overnight at 4°C. The membrane was washed three times with .1% Tween-PBS, then it was incubated with goat anti-(rabbit IgG or mouse IgG) Ig conjugated with horseradish peroxidase (Santa Cruz, Calif, USA) diluted to 1 : 2000 in the blocking buffer for 2 hours at room temperature. Antibody-antigen complexes were detected by chemiluminescence using enhanced chemiluminescent substrate kit (Santa Cruz, Calif, USA). β-actin (1 : 1000 diluted in the blocking buffer) was used as the housekeeping internal control. Primary antibodies used were: anti-rat TNF-α polyclonal antibody (Santa Cruz, Calif, USA), anti-mouse β-actin monoclonal antibody (Sigma, Mo, USA). Images were captured, and the signals were quantified in arbitrary units (OD) x band area using Vilber Lourmat image analysis system (Vilber Lourmat, Marne-la-Vallee Cedex 1, France). The results are expressed by density ratios to β-actin.
Reverse transcriptase-polymerase chain reaction
Total RNA was extracted from the frozen liver tissue with Trizol reagent (Invitrogen Corporation, Calif, USA), which is based on the guanidine thiocyanate method. Frozen liver was mechanically homogenized on ice in 1ml of ice-cold Trizol reagent. Total RNA was dissolved in RNase-free H2O, and quantified in duplicate by measuring the optical density (OD) at 260 nm. Purity of RNA was assured by examining the OD260/OD280 ratio. Two micrograms of RNA were reverse transcribed with oligo DT and avian myeloblastosis virus-reverse transcriptase (RT) (Promega, Wis, USA) in a total volume of 20 μl. One microliter of complementary DNA (cDNA) was then amplified by PCR using 1 microliter of forward and reverse primers (50 PM), 2.5 mM deoxyribonucleotide triphosphates (dNTPs), 2.5 μl 1× PCR buffer and 2.5 units Taq DNA polymerase (Takara, Shiga, Japan) in a final volume of 25 μl. PCR was performed using a programmed Thermocycler (Biometra, Goettingen Germany). The steps of amplification were TNF-α (95°C for 3 min, 94°C for 30 s, 53°C for 30 s, 72°C for 45 s, 72°C 7 min for 35 cycles); ICAM-1 (95°C for 3 min, 94°C for 60 s, 55°C for 60 s, 72°C for 60 s, 72°C 7 min for 32 cycles); VCAM-1 (95°C for 3 min, 95°C for 60 s, 55°C for 60 s, 72°C for 60 s, 72°C 7 min for 32 cycles); E-selectin (95°C for 3 min, 94°C for 30 s, 53°C for 45 s, 72°C for 60 s, 72°C 7 min for 32 cycles); GAPDH (95°C for 3 min, 94°C for 30 s, 53°C for 30 s, 72°C for 45 s, 72°C 7 min for 35 cycles). The primer pairs were designed from sequences published in GenBank. The primer pairs were: TNF-α: forward: 5′-GCCAATGGCATGGATCTCAAAG-3′; reverse: 5′-CAGAGCAATGACTCCAAAGT-3′; ICAM-1: forward: 5′-CTGCAGAGCACAAACAGCAGAG-3′; reverse: 5′-AAGGCCGCAGAGCAAAAGAAGC-3′; VCAM-1: forward: 5′-TAAGTTACACAGCAGTCAAATGGA-3′; reverse: 5′-CACATACATAAATGCCGGAATCTT-3′; E-selectin: forward: 5′-CAACGTGCACGTTTGACTGT-3′; reverse: 5′-AGGTCAAGGCTTGAACACTG-3′; GAPDH: forward: 5′-TCCCTCAAGATTGTCAGCAA-3′; reverse: 5′-AGATCCACAACGGATACATT-3′. Glyceraldehyde-3-phosphate dehydrogenase (GAPDH) was used as internal controls, while all RT-PCR signals were normalized to the signal of the corresponding RT product of GAPDH to eliminate the measurement error from uneven sample loading, and provide a semiquantitative measure of the relative changes in gene expression. The cDNAs from all liver samples were amplified simultaneously using aliquots from the same PCR mixture. After the PCR amplification, 5 μl of each reaction was electrophoresed on 1.5% agarose gels, and stained with ethidium bromide. Images were captured, and the signals were quantified in arbitrary units as OD x band area using Vilber Lourmat image analysis system (Vilber Lourmat, Marne-la-Vallee Cedex 1, France). The results are expressed by density ratios to GAPDH.
Statistical analysis
Data were presented as mean ± SEM, and were analyzed using one-way ANOVA followed by Student-Newman-Keuls post hoc test and correlation analysis. The .05 level of probability was used as statistical significance.
RESULTS
Healthy status of the rat and appearance of its liver
In the model group, five rats died during the 8 weeks, and the survivals appeared anorexic, loss of body weight and tantrum, meanwhile their coat lost the gloss. The liver of the survival rat was dark red after it was sacrificed. There were many granular-nodules distributed in the surface of the rat. The liver felt much tough and its edge became obtuse (Figure 1(a)). Three rats died during this period in the group treated with low dose of thalidomide (10 mg/kg/day), and generally the healthy condition and appearance of liver of the survival rats were the same as those in the normal control group. Only one rat died after the eight weeks in the group treated with high dose of thalidomide (100 mg/kg/day). The healthy condition of the survival rats in this group was better which was noted by good appetite, body weight and gloss of coat. And there were only few granular-nodules detected in the red surface of liver, which become smooth compared with that of cirrhosis rat. The liver felt soft and its edge was not obtuse (Figure 1(b)).
Figure 1.


Observation of the appearance of rat liver. Severity of the cirrhosis of rats in the model (a) control group was much worse than that in (b) the group treated with high dose of thalidomide.
Histopathology
Figures 2 and 3 show the histopathology of the rats by HE staining and Masson staining method. The architecture of hepatic lobules of the normal control rats was complete, and there was no fibroplasia and inflammatory cell infiltration. But in the rats of model group, the lobules of liver were separated and surrounded by the collagen fibers, which resulted in apparent pseudolobules. And there were severe necrosis and fatty degeneration of hepatocytes that were widespread in the pseudolobules of cirrhosis, meanwhile inflammatory cells infiltrated extensively in the stroma. The total Knodell score was significantly higher in the model group than that in the normal control group (P < .01) (Figure 4). Compared with the model group, the fibroplasia of the rat liver in the group treated with low dose of thalidomide was comparatively severe. And the severity and the distribution range of hepatocellular necrosis were decreased slightly, meanwhile the inflammatory cell infiltration was also decreased slightly in this group. Compared with the model group, the severity of hepatocellular necrosis and fibroplasias was significantly decreased in the group of rats treated with high dose of thalidomide, meanwhile there were thin fibroseptal and decreased inflammatory cell infiltration in the liver, which resulted in the markedly improved or normal architecture of hepatic lobule. In general, the histopathology of liver in the rats treated with high dose of thalidomide resembled relatively that of the normal control. Its total Knodell score was significantly higher than that in the model group (P < .01) (Figure 4).
Figure 2.

Liver histopathology of the rat detected by HE staining. N represented the normal control group;Mrepresented the model group; L represented the group treated with low dose of thalidomide; H represented the group treated with high dose of thalidomide (original magnification N, M, L, H, ×100).
Figure 3.

Liver histopathology of the rat detected byMasson trichrome staining. N represented the normal control group;Mrepresented the model group; L represented the group treated with low dose of thalidomide; H represented the group treated with high dose of thalidomide. Fibrotic bands of liver shown in M, L, and H (original magnification N, M, L, H, ×100).
Figure 4.
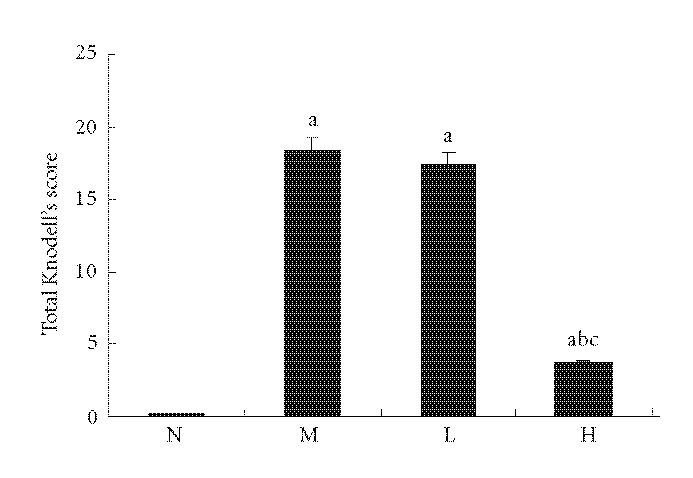
Comparison of total Knodell score of liver. N represented the normal control group; M represented the model group; L represented the group treated with low dose of thalidomide; H represented the group treated with high dose of thalidomide. aP < .01 versus normal control group; bP < .01 versus model group; cP < .01 group treated with high dose of thalidomide versus group treated with low dose of thalidomide.
Analysis of serum markers
Serum ALT and AST were significantly higher and PA and ALB were significantly lower in the model group than those in the normal control group (P < .01). Serum ALT and AST were significantly lower in group treated with low dose of thalidomide than those in the model group (P < .01). Serum ALT and AST were also significantly lower in group treated with high dose of thalidomide than those in the model group (P < .01), meanwhile PA and ALB were significantly higher in this group than those in the model group (P < .01) (Table 1).
Table 1.
Analysis of serum liver function indexes. Data are presented as mean ± standard error of the mean. N represented the normal control group; M represented the model group; L represented the group treated with low dose of thalidomide; H represented the group treated with high dose of thalidomide.
| Groups | n | ALT(U/L) | AST(U/L) | PA(mg/dL) | ALB(g/L) | GLB(g/L) |
| N | 15 | 48.41 ± 7.06 | 118.11 ± 10.76 | 1.03 ± 0.23 | 42.65 ± 2.34 | 30.34 ± 1.33 |
| M | 10 | 160.49 ± 8.14a | 485.89 ± 9.36a | 0.44 ± 0.10a | 33.21 ± 2.16a | 31.24 ± 1.02 |
| L | 12 | 136.73 ± 6.39ab | 216.82 ± 7.80ab | 0.53 ± 0.09a | 34.58 ± 0.72a | 30.43 ± 1.20 |
| H | 14 | 62.48 ± 7.08abc | 141.49 ± 9.53abc | 1.31 ± 0.14abc | 40.59 ± 1.39abc | 30.88 ± 1.29 |
aP < .01 versus normal control group; bP < .01 versus model group;
cP < .01 group treated with high dose of thalidomide versus group treated with low dose of thalidomide.
Serum HA, LN, PCIII, and C IV were significantly higher in the model group than those in the normal control group (P < .01). They were significantly lower in group treated with high dose of thalidomide than those in the model group (P < .01) (Table 2).
Table 2.
Analysis of serum liver fibrosis indexes. Data are presented as mean ± standard error of the mean. N represented the normal control group; M represented the model group; L represented the group treated with low dose of thalidomide; H represented the group treated with high dose of thalidomide.
| Groups | n | HA(ng/mL) | LN(ng/mL) | PCIII(ng/mL) | C IV(ng/mL) |
| N | 15 | 109.13 ± 15.92 | 31.89 ± 1.63 | 7.23 ± 1.37 | 26.93 ± 3.17 |
| M | 10 | 384.87 ± 15.91a | 86.40 ± 2.89a | 73.97 ± 1.96a | 51.53 ± 2.39a |
| L | 12 | 373.34 ± 8.66a | 85.34 ± 1.20a | 72.63 ± 1.14a | 49.33 ± 2.44a |
| H | 14 | 129.01 ± 12.81abc | 35.26 ± 2.23abc | 31.46 ± 3.13abc | 31.25 ± 2.20abc |
aP < .01 versus normal control group; bP < .01 versus model group;
cP < .01 group treated with low dose of thalidomide versus group treated with high dose of thalidomide.
Immunohistochemical analysis of ICAM-1, VCAM-1, and E-selectin
There were few positive expressions of these three proteins in the hepatic sinusoid cells and vascular endothelial cells in the normal rat liver, and there was no positive expression in the hepatocytes. But in the cirrhotic liver, there were positive expressions of these three proteins in above three types of cells, meanwhile the positive ICAM-1, VCAM-1, and E-selectin cells were mainly distributed at the fibrosepta band, the area of necrosis and inflammatory cell infiltration in hepatic lobules (Figure 5(a), Figure 6(a), Figure 7(a)). The ratio of these three positive cells to the total cells in model group was significantly higher than that in the normal control group (P < .01) (Figure 5(b), Figure 6(b), Figure 7(b)). Compared with model group, both low dose and high dose of thalidomide reduced that ratio significantly (P < .01) (Figure 5b, Figure 6(b), Figure 7(b)). And there was significant difference of this effect between these two therapeutic groups (P < .01) (Figure 5(b), Figure 6(b), Figure 7(b)).
Figure 5.


Immunohistochemical staining for ICAM-1 in rat liver. N represented the normal control group; M represented the model group; L represented the group treated with low dose of thalidomide; H represented the group treated with high dose of thalidomide. (a) Positive ICAM-1 cells were mainly distributed at the fibrosepta band, area of necrosis, and inflammatory cell infiltration in hepatic lobules (M, L, and H) (originalmagnification N,M, L, H, ×400, immunohistochemical staining). (b) Comparison of the expression of ICAM-1 using immunohistochemical analysis. aP < .01 versus normal control group; bP < .01 versus model group; cP < .01 group treated with high dose of thalidomide versus group treated with low dose of thalidomide.
Figure 6.


Immunohistochemical staining for VCAM-1 in rat liver. N represented the normal control group; M represented the model group; L represented the group treated with low dose of thalidomide; H represented the group treated with high dose of thalidomide. (a) Positive VCAM-1 cells were mainly distributed at the fibrosepta band, area of necrosis, and inflammatory cell infiltration in hepatic lobules (M, L, and H) (original magnification N, M, L, H, ×400, immunohistochemical staining). (b) Comparison of the expression of VCAM-1 using immunohistochemical analysis. aP < .01 versus normal control group; bP < .01 versus model group; cP < .01 group treated with high dose of thalidomide versus group treated with low dose of thalidomide.
Figure 7.


Immunohistochemical staining for E-selectin in rat liver. N represented the normal control group; M represented the model group; L represented the group treated with low dose of thalidomide; H represented the group treated with high dose of thalidomide. (a) Positive E-selectin cells were mainly distributed at the fibrosepta band, area of necrosis, and inflammatory cell infiltration in hepatic lobules (M, L, and H) (original magnification N, M, L, H, ×400, immunohistochemical staining). (b) Comparison of the expression of E-selectin using immunohistochemical analysis. aP < .01 versus normal control group; bP < .01 versus model group; cP < .01 group treated with high dose of thalidomide versus group treated with low dose of thalidomide.
Western blot analysis of TNF-α protein
The expression of TNF-α protein was significantly higher in the liver tissue of the rats in the model group than that in the normal control group (P < .01) (Figure 8). The expressions of TNF-α protein were significantly lower in the liver tissue of rats in the group treated with high dose of thalidomide than that in the model group (P < .01) (Figure 8).
Figure 8.

Expression of TNF-α protein in rat liver using Western blot analysis. (a) Lane 1 represented the normal control group (N); lane 2 represented the model group (M); lane 3 represented the group treated with low dose of thalidomide (L); lane 4 represented the group treated with high dose of thalidomide (H). β-actin served as an internal control. (b) Comparison of the expression of TNF- α protein using Western blot analysis. aP < .01, bP < .05 versus normal control group; c P < .01 versus model group; dP < .01 group treated with high dose of thalidomide versus group treated with low dose of thalidomide.
RT-PCR analysis of TNF-α, ICAM-1, VCAM-1, and E-selectin mRNA
The expression of TNF-α mRNA was significantly higher in the liver tissue of the rats in the model group than that in the normal control group (P < .01). The expression of TNF-α mRNA was significantly lower in the liver tissue of the rats in the group treated with high dose of thalidomide than that in the model group (P < .01) (Figure 9).
Figure 9.

Expression of TNF-α, ICAM-1, VCAM-1, and E-selectin mRNA in rat liver using RT-PCR analysis. (a) Lane 1 represented 100 bp maker, lane 2 represented the normal control group (N); lane 3 represented the model group (M); lane 4 represented the group treated with low dose of thalidomide (L); lane 5 represented the group treated with high dose of thalidomide (H). GAPDH served as an internal control. (b) Comparison of the expression of TNF-α, ICAM-1, VCAM-1, and E-selectin mRNA using RT-PCR analysis. aP < .01 versus normal control group; bP < .01 versus model group; cP < .01 group treated with high dose of thalidomide versus group treated with low dose of thalidomide.
The expressions of ICAM-1, VCAM-1, and E-selectin mRNA were significantly higher in the liver tissue of the rats in the model group than those in the normal control group (P < .01). The expressions of ICAM-1, VCAM-1, and E-selectin mRNA were significantly lower in the liver tissue of the rats in the group treated with low dose of thalidomide or high dose of thalidomide than that in the model group, respectively, (P < .01) (Figure 9). And there was significant difference of this effect between these two therapeutic groups (P < .01) (Figure 9).
Analysis of correlation
There was a close positive correlation between the expression of TNF-α mRNA and that of ICAM-1 mRNA (r = .83, P < .01), VCAM-1 mRNA (r = .92, P < .01), and E-selectin mRNA (r = .94, P < .01).
DISCUSSION
Liver fibrosis is a common pathologic process of chronic liver diseases of various etiologies. The chronic liver disease of various etiologies produces liver fibrosis and progressive continual of fibrosis will end up finally into the cirrhosis [19, 20]. It has been reported that liver fibrosis may be reversed by so many treatments, which included antiviral therapy, regulation of matrix metabolism, facilitation of apoptosis of hepatocellular satellate cell (HSC), gene therapy, and so on [21, 22].
In recent years, thalidomide has been used in some basic and clinical trials to treat acute or chronic liver diseases [23–29]. Muriel et al reported that thalidomide significantly reduced the increase of ALT, γ-GTP, and ALP, prevented the lipid peroxidation and the decrease of glycogen, and improved the histopathology in rat liver cirrhosis induced by CCl4 [30]. Its mechanism may be related to anti-inflammatory, anti-TNF-α, and antifibrotic properties of thalidomide. In another study, Yeh et al reported that intraperitoneal injection of thalidomide inhibit lethal hepatic necroinflammation, accelerated the recovery from the rat live cirrhosis induced by thioacetamide, and the mechanism may be suppression of expression of TNF-α and TGFβ1 of Kupffer's cells [31].
In our study, the rat liver cirrhosis induced by CCl4 was treated with thalidomide by intragastric administration. The mortality of rats was decreased and their healthy status was improved. And the appearance of the liver after the therapy with high dose of thalidomide became smooth and supple. The histopathology of liver tissue of rats treated with high dose of thalidomide appeared approximate to the normal liver. The decrease of hepatocellular necrosis, inflammatory infiltration, and fibroplasias and the absorption of fibrosepta were apparent in liver. The significant decrease of Knodell score demonstrated that the activity of inflammation and degree of fibrosis were markedly reduced by thalidomide (high dose). Besides this, thalidomide (low dose and high dose) prevented the evaluation of serum ALT and AST, which suggests that it can effectively prevent the inflammation. The increased levels of PA and ALB in the thalidomide (high dose) treated group suggests that thalidomide can improve the nutritional status of cirrhotic rats. The reduced serum liver fibrosis makers such as HA, LN, PCIII, and C IV in rat cirrhosis indicated thalidomide's (high dose) effect on improving of liver fibrosis on another hand.
The expression of adhesion molecules such as ICAM-1, VCAM-1, and E-selectin was high in the chronic hepatitis, or cirrhosis was reported in several studies, and these adhesion molecules may play roles in the pathogenesis of liver fibrosis. In our study very less expression of these molecules was found in the normal liver, but in the cirrhotic liver, there were high expressions of them in the hepatic sinusoid cells, vascular endothelial cells, and hepatocytes. They were distributed at the fibrosepta band, area rich of necrosis, and inflammatory cells in cirrhotic liver. It was found that the expressions of ICAM-1, VCAM-1, and E-selectin both in mRNA and protein levels were significantly reduced by thalidomide which was dose dependent. This suggests that thalidomide can much effectively suppress the up-regulation of adhesion molecules in liver cirrhosis. This may be useful to illustrate the mechanism of thalidomide's effect on preventing liver fibrosis.
TNF-α/TNFR-mediated signaling pathway via activation of Kupffer's cells plays an important role in the pathogenesis of liver fibrosis [32]. Sudo et al reported that liver fibrosis induced by CCl4 was prevented in TNF receptor (TNFR) type 1 knockout (KO) mice [33]. But as an important proinflammatory cytokine, TNF-α also plays an important role in the regulation of adhesion molecules [34–40]. Enhancement of NFκB mediated signaling pathway via activation by cytokines like TNF-α may be critically involved in the up-regulation of chemokines and adhesion molecules [41– 43]. Paik et al reported that HSC may be activated by production of TNF-α induced by LPS, and activated HSCs stimulate NFκB which up-regulates adhesion molecules such as ICAM-1 and VCAM-1 [44]. It is a proinflammatory mediator cascade which plays important role in the pathogenesis of liver fibrosis. A promising therapeutic approach to liver fibrosis is, therefore, to inhibit TNF-α-induced adhesion molecules expression at the transcription level. Thalidomide has been shown to reduce the production of TNF-α effectively [45– 47]. In this study, the expression of TNF-α in mRNA and protein levels were markedly reduced by thalidomide (high dose) in liver cirrhosis induced by CCl4. And there was a close positive correlation between the expression of TNF-α mRNA and that of ICAM-1 mRNA (r = .83, P < .01), VCAM-1 mRNA (r = .92, P < .01), and E-selectin mRNA (r = .94, P < .01), which manifested that the changes of adhesion molecules were closely correlated with TNF-α in mRNA levels induced by thalidomide in rat liver cirrhosis. So maybe suppression of adhesion molecules via TNF-α signaling pathway by thalidomide plays an essential role in the treatment of liver fibrosis. Even though there were 10-fold difference between high dose and low dose of thalidomide, both of them significantly reduced the expression of ICAM-1, VCAM-1, and E-selectin in mRNA and protein levels. It is so interesting. Maybe either there were other proinflammatory cytokines suppressed by thalidomide that also mediated the expression of adhesion molecules or there were some signaling pathways unknown which played roles in this regulation.
In conclusion, thalidomide exerts its effect on the down-regulation of adhesion molecules via TNF-α signaling pathway to prevent liver injury and inhibit the developing of liver fibrosis.
References
- 1.Madan B, Prasad AK, Parmar VS, Ghosh B. 1,4-Dihydroxyxanthone modulates the adhesive property of endothelial cells by inhibiting intercellular adhesion molecule-1 (ICAM-1), vascular cell adhesion molecule-1 (VCAM-1) and E-selectin. Bioorganic and Medicinal Chemistry. 2004;12(6):1431–1437. doi: 10.1016/j.bmc.2003.12.027. [DOI] [PubMed] [Google Scholar]
- 2.Volpes R, Van den Oord JJ, Desmet VJ. Immunohistochemical study of adhesion molecules in liver inflammation. Hepatology. 1990;12(1):59–65. doi: 10.1002/hep.1840120110. [DOI] [PubMed] [Google Scholar]
- 3.Bruno CM, Sciacca C, Cilio D, et al. Circulating adhesion molecules in patients with virus-related chronic diseases of the liver. World Journal of Gastroenterology. 2005;11(29):4566–4569. doi: 10.3748/wjg.v11.i29.4566. [DOI] [PMC free article] [PubMed] [Google Scholar]
- 4.Girón-González JA, Martínez-Sierra C, Rodriguez-Ramos C, et al. Adhesion molecules as a prognostic marker of liver cirrhosis. Scandinavian Journal of Gastroenterology. 2005;40(2):217–224. doi: 10.1080/00365520510011470. [DOI] [PubMed] [Google Scholar]
- 5.Yokomori H, Oda M, Ogi M, et al. Expression of adhesion molecules on mature cholangiocytes in canal of Hering and bile ductules in wedge biopsy samples of primary biliary cirrhosis. World Journal of Gastroenterology. 2005;11(28):4382–4389. doi: 10.3748/wjg.v11.i28.4382. [DOI] [PMC free article] [PubMed] [Google Scholar]
- 6.Panasiuk A, Prokopowicz D, Panasiuk B. Monocyte chemotactic protein-1 and soluble adhesion molecules as possible prognostic markers of the efficacy of antiviral treatment in chronic hepatitis C. World Journal of Gastroenterology. 2004;10(24):3639–3642. doi: 10.3748/wjg.v10.i24.3639. [DOI] [PMC free article] [PubMed] [Google Scholar]
- 7.Ho JW, Poon RT, Tong CS, Fan ST. Clinical significance of serum vascular cell adhesion molecule-1 levels in patients with hepatocellular carcinoma. World Journal of Gastroenterology. 2004;10(14):2014–2018. doi: 10.3748/wjg.v10.i14.2014. [DOI] [PMC free article] [PubMed] [Google Scholar]
- 8.Yokomori H, Oda M, Yoshimura K, et al. Expression of intercellular adhesion molecule-1 and lymphocyte function-associated antigen-1 protein and messenger RNA in primary biliary cirrhosis. Internal Medicine. 2003;42(10):947–954. doi: 10.2169/internalmedicine.42.947. [DOI] [PubMed] [Google Scholar]
- 9.Pata C, Yazar A, Altintas E, et al. Serum levels of intercellular adhesion molecule-1 and nitric oxide in patients with chronic hepatitis related to hepatitis C virus: connection fibrosis. Hepato-Gastroenterology. 2003;50(51):794–797. [PubMed] [Google Scholar]
- 10.Abdalla A, Sheesha A-AG, Shokeir M, et al. Serum intercellular adhesion molecule-I in children with chronic liver disease: relationship to disease activity. Digestive Diseases and Sciences. 2002;47(6):1206–1208. doi: 10.1023/a:1015393708187. [DOI] [PubMed] [Google Scholar]
- 11.Kobayashi H, Horikoshi K, Long L, Yamataka A, Lane GJ, Miyano T. Serum concentration of adhesion molecules in postoperative biliary atresia patients: relationship to disease activity and cirrhosis. Journal of Pediatric Surgery. 2001;36(8):1297–1301. doi: 10.1053/jpsu.2001.25798. [DOI] [PubMed] [Google Scholar]
- 12.Capra F, De Maria E, Lunardi C, et al. Serum level of soluble intercellular adhesion molecule 1 in patients with chronic liver disease related to hepatitis C virus: a prognostic marker for responses to interferon treatment. Journal of Infectious Diseases. 2000;181(2):425–431. doi: 10.1086/315265. [DOI] [PubMed] [Google Scholar]
- 13.Tacke F, Schöffski P, Trautwein C, et al. Plasma P-selectin levels are elevated in patients with chronic liver disease. Blood Coagulation and Fibrinolysis. 2003;14(4):319–325. doi: 10.1097/00001721-200306000-00001. [DOI] [PubMed] [Google Scholar]
- 14.Cervello M, Virruso L, Lipani G, et al. Serum concentration of E-selectin in patients with chronic hepatitis, liver cirrhosis and hepatocellular carcinoma. Journal of Cancer Research and Clinical Oncology. 2000;126(6):345–351. doi: 10.1007/s004320050354. [DOI] [PubMed] [Google Scholar]
- 15.Eriksson T, Björkman S, Höglund P. Clinical pharmacology of thalidomide. European Journal of Clinical Pharmacology. 2001;57(5):365–376. doi: 10.1007/s002280100320. [DOI] [PubMed] [Google Scholar]
- 16.Rajkumar SV. Current status of thalidomide in the treatment of cancer. Oncology (Huntington) 2001;15(7):867–874, 877–879. [PubMed] [Google Scholar]
- 17.Settles B, Stevenson A, Wilson K, et al. Down-regulation of cell adhesion molecules LFA-1 and ICAM-1 after in vitro treatment with the anti-TN F-α agent thalidomide. Cellular and Molecular Biology (Noisy-le-Grand) 2001;47(7):1105–1114. [PubMed] [Google Scholar]
- 18.Meierhofer C, Dunzendorfer S, Wiedermann CJ. Theoretical basis for the activity of thalidomide. BioDrugs. 2001;15(10):681–703. doi: 10.2165/00063030-200115100-00005. [DOI] [PubMed] [Google Scholar]
- 19.García L, Hernández I, Sandoval A, et al. Pirfenidone effectively reverses experimental liver fibrosis. Journal of Hepatology. 2002;37(6):797–805. doi: 10.1016/s0168-8278(02)00272-6. [DOI] [PubMed] [Google Scholar]
- 20.Pinzani M, Rombouts K. Liver fibrosis: from the bench to clinical targets. Digestive and Liver Disease. 2004;36(4):231–242. doi: 10.1016/j.dld.2004.01.003. [DOI] [PubMed] [Google Scholar]
- 21.Garcia-Bañuelos J, Siller-Lopez F, Miranda A, Aguilar LK, Aguilar-Cordova E, Armendariz-Borunda J. Cirrhotic rat livers with extensive fibrosis can be safely transduced with clinical-grade adenoviral vectors. Evidence of cirrhosis reversion. Gene Therapy. 2002;9(2):127–134. doi: 10.1038/sj.gt.3301647. [DOI] [PubMed] [Google Scholar]
- 22.Rockey DC. Antifibrotic therapy in chronic liver disease. Clinical Gastroenterology and Hepatology. 2005;3(2):95–107. doi: 10.1016/s1542-3565(04)00445-8. [DOI] [PubMed] [Google Scholar]
- 23.Enomoto N, Takei Y, Hirose M, Kitamura T, Ikejima K, Sato N. Protective effect of thalidomide on endotoxin-induced liver injury. Alcoholism: Clinical and Experimental Research. 2003;27(8 suppl):2S–6S. doi: 10.1097/01.ALC.0000078606.59842.01. [DOI] [PubMed] [Google Scholar]
- 24.Austin AS, Mahida YR, Clarke D, Ryder SD, Freeman JG. A pilot study to investigate the use of oxpentifylline (pentoxifylline) and thalidomide in portal hypertension secondary to alcoholic cirrhosis. Alimentary Pharmacology and Therapeutics. 2004;19(1):79–88. doi: 10.1046/j.1365-2036.2003.01809.x. [DOI] [PubMed] [Google Scholar]
- 25.Patt YZ, Hassan MM, Lozano RD, et al. Thalidomide in the treatment of patients with hepatocellular carcinoma: a phase II trial. Cancer. 2005;103(4):749–755. doi: 10.1002/cncr.20821. [DOI] [PubMed] [Google Scholar]
- 26.Hsu C, Cheng JC-H, Cheng A-L. Recent advances in non-surgical treatment for advanced hepatocellular carcinoma. Journal of the Formosan Medical Association. 2004;103(7):483–495. [PubMed] [Google Scholar]
- 27.Wang T-E, Kao C-R, Lin S-C, et al. Salvage therapy for hepatocellular carcinoma with thalidomide. World Journal of Gastroenterology. 2004;10(5):649–653. doi: 10.3748/wjg.v10.i5.649. [DOI] [PMC free article] [PubMed] [Google Scholar]
- 28.Thiele A, Bang R, Gütschow M, et al. Cytokine modulation and suppression of liver injury by a novel analogue of thalidomide. European Journal of Pharmacology. 2002;453(2-3):325–334. doi: 10.1016/s0014-2999(02)02423-8. [DOI] [PubMed] [Google Scholar]
- 29.Raufman J-P, Lamps LW. Thalidomide-induced normalization of serum ALT levels in a patient with hepatitis C. American Journal of Gastroenterology. 2001;96(11):3209–3211. doi: 10.1111/j.1572-0241.2001.05289.x. [DOI] [PubMed] [Google Scholar]
- 30.Muriel P, Fernández-Martínez E, Pérez-Álvarez V, et al. Thalidomide ameliorates carbon tetrachloride induced cirrhosis in the rat. European Journal of Gastroenterology and Hepatology. 2003;15(9):951–957. doi: 10.1097/00042737-200309000-00003. [DOI] [PubMed] [Google Scholar]
- 31.Yeh T-S, Ho Y-P, Huang S-F, Yeh J-N, Jan Y-Y, Chen M-F. Thalidomide salvages lethal hepatic necroinflammation and accelerates recovery from cirrhosis in rats. Journal of Hepatology. 2004;41(4):606–612. doi: 10.1016/j.jhep.2004.06.019. [DOI] [PubMed] [Google Scholar]
- 32.Simeonova PP, Gallucci RM, Hulderman T, et al. The role of tumor necrosis factor-α in liver toxicity, inflammation, and fibrosis induced by carbon tetrachloride. Toxicology and Applied Pharmacology. 2001;177(2):112–120. doi: 10.1006/taap.2001.9304. [DOI] [PubMed] [Google Scholar]
- 33.Sudo K, Yamada Y, Moriwaki H, Saito K, Seishima M. Lack of tumor necrosis factor receptor type 1 inhibits liver fibrosis induced by carbon tetrachloride in mice. Cytokine. 2005;29(5):236–244. doi: 10.1016/j.cyto.2004.11.001. [DOI] [PubMed] [Google Scholar]
- 34.Singh RJR, Mason JC, Lidington EA, et al. Cytokine stimulated vascular cell adhesion molecule-1 (VCAM-1) ectodomain release is regulated by TIMP-3. Cardiovascular Research. 2005;67(1):39–49. doi: 10.1016/j.cardiores.2005.02.020. [DOI] [PubMed] [Google Scholar]
- 35.Maeda K, Yoshida K, Ichimiya I, Suzuki M. Dexamethasone inhibits tumor necrosis factor-α-induced cytokine secretion from spiral ligament fibrocytes. Hearing Resaerch. 2005;202(1-2):154–160. doi: 10.1016/j.heares.2004.08.022. [DOI] [PubMed] [Google Scholar]
- 36.Woo C-H, Lim J-H, Kim J-H. VCAM-1 upregulation via PKCδ-p38 kinase-linked cascade mediates the TNF-α-induced leukocyte adhesion and emigration in the lung airway epithelium. American Journal of Physiology - Lung Cellular and Molecular Physiology. 2005;288(2 32-2):L307–L316. doi: 10.1152/ajplung.00105.2004. [DOI] [PubMed] [Google Scholar]
- 37.Kumagai N, Fukuda K, Fujitsu Y, Nishida T. Expression of functional ICAM-1 on cultured human keratocytes induced by tumor necrosis factor-α. Japanese Journal of Ophthalmology. 2003;47(2):134–141. doi: 10.1016/s0021-5155(02)00686-x. [DOI] [PubMed] [Google Scholar]
- 38.Sasaki M, Ostanin D, Elrod JW, et al. TNF-α-induced endothelial cell adhesion molecule expression is cytochrome P-450 monooxygenase dependent. American Journal of Physiology - Cell Physiology. 2003;284(2 53-2):C422–C428. doi: 10.1152/ajpcell.00271.2002. [DOI] [PubMed] [Google Scholar]
- 39.Schäefers M, Schmidt C, Vogel C, Toyka KV, Sommer C. Tumor necrosis factor-α (TNF) regulates the expression of ICAM-1 predomonantly through TNF receptor 1 after chronic constriction injury of mouse sciatic nerve. Acta Neuropathologica (Berlin) 2002;104(2):197–205. doi: 10.1007/s00401-002-0541-9. [DOI] [PubMed] [Google Scholar]
- 40.Dagia NM, Harii N, Meli AE, et al. Phenyl methimazole inhibits TNF-α-induced VCAM-1 expression in an IFN regulatory factor-1-dependent manner and reduces monocytic cell adhesion to endothelial cells. Journal of Immunology. 2004;173(3):2041–2049. doi: 10.4049/jimmunol.173.3.2041. [DOI] [PubMed] [Google Scholar]
- 41.Hang CH, Shi J-X, Li J-S, Wu W, Hong XY. Concomitant upregulation of nuclear factor-κB activity, proinflammatory cytokines and ICAM-1 in the injured brain after cortical contusion trauma in a rat model. Neurology India. 2005;53(3):312–317. doi: 10.4103/0028-3886.16930. [DOI] [PubMed] [Google Scholar]
- 42.Son E-W, Mo S-J, Rhee D-K, Pyo S. Vitamin C blocks TNF-α-induced NF-κB activation and ICAM-1 expression in human neuroblastoma cells. Archives of Pharmacal Research. 2004;27(10):1073–1079. doi: 10.1007/BF02975434. [DOI] [PubMed] [Google Scholar]
- 43.Lu L, Chen SS, Zhang JQ, Ramires FJ, Sun Y. Activation of nuclear factor-κB and its proinflammatory mediator cascade in the infarcted rat heart. Biochemical and Biophysical Research Communications. 2004;321(4):879–885. doi: 10.1016/j.bbrc.2004.07.048. [DOI] [PubMed] [Google Scholar]
- 44.Paik Y-H, Schwabe RF, Bataller R, Russo MP, Jobin C, Brenner DA. Toll-like receptor 4 mediates inflammatory signaling by bacterial lipopolysaccharide in human hepatic stellate cells. Hepatology. 2003;37(5):1043–1055. doi: 10.1053/jhep.2003.50182. [DOI] [PubMed] [Google Scholar]
- 45.Moreira AL, Sampaio EP, Zmuidzinas A, Frindt P, Smith KA, Kaplan G. Thalidomide exerts its inhibitory action on tumor necrosis factor α by enhancing mRNA degradation. Journal of Experimental Medicine. 1993;177(6):1675–1680. doi: 10.1084/jem.177.6.1675. [DOI] [PMC free article] [PubMed] [Google Scholar]
- 46.Sampaio EP, Hernandez MO, Carvalho DS, Sarno EN. Management of erythema nodosum leprosum by thalidomide: thalidomide analogues inhibit M. leprae-induced TNFα production in vitro. Biomedicine and Pharmacotherapy. 2002;56(1):13–19. doi: 10.1016/s0753-3322(01)00147-0. [DOI] [PubMed] [Google Scholar]
- 47.Keifer JA, Guttridge DC, Ashburner BP, Baldwin AS., Jr Inhibition of NF-κB activity by thalidomide through suppression of Iκ B kinase activity. Journal of Biological Chemistry. 2001;276(25):22382–22387. doi: 10.1074/jbc.M100938200. [DOI] [PubMed] [Google Scholar]