

Abstract
A major question in G protein-coupled receptor signaling concerns the quaternary structure required for signal transduction. Do these transmembrane receptors function as monomers, dimers, or larger oligomers? We have investigated the oligomeric state of the model G protein-coupled receptor rhodopsin (Rho), which absorbs light and initiates a phototransduction-signaling cascade that forms the basis of vision. In this study, different forms of Rho were isolated using gel filtration techniques in mild detergents, including n-dodecyl-β-d-maltoside, n-tetradecyl-β-d-maltoside, and n-hexadecyl-β-d-maltoside. The quaternary structure of isolated Rho was determined by transmission electron microscopy, demonstrating that in micelles containing n-dodecyl-β-d-maltoside, Rho exists as a mixture of monomers and dimers whereas in n-tetradecyl-β-d-maltoside and n-hexadecyl-β-d-maltoside Rho forms higher ordered structures. Especially in n-hexadecyl-β-d-maltoside, most of the particles are present in tightly packed rows of dimers. The oligomerization of Rho seems to be important for interaction with its cognate G protein, transducin. Although the activated Rho (Meta II) monomer or dimers are capable of activating the G protein, transducin, the activation process is much faster when Rho exists as organized dimers. Our studies provide direct comparisons between signaling properties of Meta II in different quaternary complexes.
A large number of experimental data from reconstitution systems in vitro, model cell lines, in vivo approaches, structural studies of the extracellular domain of three receptors, and modeling/sizing analysis reveal that G protein-coupled receptors (GPCRs)3 can exist in various oligomeric forms (1, 2). The functioning of GPCRs as a monomeric unit is significantly less extensively documented. The propensity of GPCRs to oligomerize is likely to be important for the posttranslational maturation of GPCRs in the endoplasmic reticulum and Golgi apparatus, for cell surface expression, desensitization, and internalization, and for diversification of the signaling power through hetero-oligomerization (1, 2). Efficient coupling of GPCRs to their cognate heterotrimeric G proteins through dimeric or monomeric forms of the receptors has been suggested in modeling studies (3, 4), but so far, only a pentameric complex composed of two GPCRs and G protein has been isolated (5). In our model, one rhodopsin (Rho) molecule needs to be activated whereas the second serves as a platform to support G protein binding and does not require activation (3). However, the lack of biochemical methods that can produce different oligomers has prevented direct evaluation of the signaling properties of various forms of the receptors.
In addition to atomic force microscopy, we have used blue native and native gel electrophoresis, chemical cross-linkers, and limited proteolysis to show that the GPCR Rho exists as oligomeric structures in isolated disk membranes of rod photoreceptors (3, 6, 7, 9 –12). The IV-V model of dimerization was proposed by taking into account structural constraints in which the interface between the subunits in the dimer is formed by rotationally symmetric and homologous interactions between the IV and V helices of each protomer (7). Recently, this model was supported experimentally for the dopamine D2 receptor (8), suggesting that it may extend to all GPCRs as well. Moreover, solubilized Rho dimers were directly visualized by transmission electron microscopy (TEM) (6). The isolated disks used in these experiments were produced by well established methods (13), suggesting that most of the work carried out on the activation of its G protein, Gt, that has been published over the last 20 years employed oligomeric Rho when used as a membrane suspension. It should be noted that the density of Rho varies along the length of the rod outer segments (ROS) within the rod cells (14), a property that did not allow x-ray or neutron diffraction to detect the intrinsic symmetry within ROS. In mild detergents with increasing detergent concentrations, we find that Rho dissociates from high molecular weight species to monomers (6, 12). When Rho is reconstituted into asolectin, even at high lipid to Rho ratios, >90% of the receptor is present as oligomers (15). In our current studies, we have carried out systematic biochemical screens for conditions leading to the isolation of Rho in different higher order structures. We have taken advantage of the preservation of Rho oligomers in alkyl-maltosides and tested a number of detergents and conditions to produce uniform oligomeric forms of Rho as verified by TEM. Once different forms of Rho were produced (the first time this has been achieved for any GPCR), we tested them in G protein activation and other biochemical assays.
MATERIALS AND METHODS
Chemicals
DDM, TDM, and HDM were obtained from Anatrace Inc. (Maumee, OH). GTPγS was purchased from Sigma.
ROS Membrane Solubilization
Bovine ROS membranes were prepared from fresh retinas under dim red light according to the procedure of Papermaster (13). ROS membranes (1 mg/ml of proteins) were treated with 10 mm Bis-Tris propane, pH 7.5, containing 100 mm NaCl and 10 mm DDM, 20 mm TDM, or 20 mm HDM. The membrane suspensions were incubated overnight at room temperature and then centrifuged at 100,000 × g for 30 min using a Beckman Ultracentrifuge to remove insoluble material. The supernatant was used for the purification of Rho complexes by gel filtration chromatography.
Size Exclusion Chromatography
Gel filtration chromatography was performed using a Superdex 200 10/300 GL column (Amersham Biosciences), equilibrated with 10 mm Bis-Tris propane, pH 7.5, 100 mm NaCl, at either 3 mm DDM, 0.5 mm TDM, or 0.05 mm HDM. These concentrations are 17, 50, and 83 times above the critical micelle concentration (CMC) of the respective detergent. The differences in detergent concentrations are correlated with differences in their CMC. The chromatography was carried out at room temperature with a flow rate of 0.4 ml/min. The absorbance of the eluate at 280 and 500 nm was monitored with a Cary 50 Bio UV-Vis spectrophotometer (Varian Inc., Walnut Creek, CA). 30 μl of fractions containing proteins were analyzed by SDS-PAGE. The void volume of the column (blue dextran 2,000 kDa; Amersham Biosciences) was in fraction 21, and the column volume as measured with NaN3 eluted in fraction 62. The column was calibrated using IgG (158 kDa), bovine serum albumin (67 kDa), ovalbumin (43 kDa), and cytochrome c (12.5 kDa). The standard proteins were run through the column with or without detergents. The different detergents did not change the migration of the standard soluble proteins. The linear calibration curve obtained by plotting the logarithm of the molecular mass as a function of the fraction number was used to calculate the molecular mass of the Rho complexes (12).
Transmission Electron Microscopy
Rho purified by gel filtration in 3 mm DDM (fraction 35), 0.5 mm TDM (fraction 31), or 0.05 mm HDM (fraction 22) was adsorbed for 10 s to parlodion carbon-coated copper grids rendered hydrophilic by glow discharge at low pressures in air. Grids were washed with three drops of double-distilled water and stained with two drops of 0.75% uranyl formate. Electron micrographs of Rho particles were recorded with a Hitachi H-7000 TEM operated at 100 kV.
Total Phospholipid Quantification
Rho was purified by gel filtration in 3 mm DDM, 0.5 mm TDM, or 0.05 mm HDM. The concentration of Rho was determined by its absorbance at 500 nm, using a molar extinction coefficient of 40,600 m−1 cm−1 (16). After Rho measurements, samples were dried and lipids were extracted with chloroform-methanol mixtures. Total phospholipids were quantified by phosphorus analysis (17). Phospholipids were also extracted with H2O/methanol/CHCl3, and the bottom layer was removed, dried down, and then redissolved in CHCl3. The CHCl3 solution was fractionated into three different classes of lipids (neutral lipid, glycolipid, and polar lipid) by silicic acid column chromatography and subsequently eluted with CHCl3, acetone, and methanol (18). The methanol fraction was dried down and dissolved again in 10% H2O/80% methanol/10% CHCl3. Electrospray mass spectrometry analysis of phospholipids was performed on a QSTAR PULSAR i with a nebulization-assisted homemade nano-spray ionization source. For a mixture of phospholipids, the precursor ion experiment was carried out first to identify the different classes of phospholipids, and then tandem mass spectrometry followed to analyze the structures of the phospholipids. For detection of phosphatidylcholine and phosphatidylserine in the positive mode and nitrogen-containing phosphatidylethanolamine and phosphatidylserine in the negative mode, 0.2% acetic acid or 0.05% piperidine (19) was included, respectively. Because of the characteristic polar head group structure of different phospholipids, diagnostic mass ions (m/z) were used for the identification of each individual class of phospholipids in the precursor ion experiment (20, 21): [CH2C(OH)CH2HPO4]− (152.995) for general phospholipids and phosphatidic acid (22), [H2PO4CH2CH2(NCH3)4] − (184.074) for phosphatidylcholine (23), [CH2C(OH)CH2PO4CH2CH2NH2] − (196.038) for phosphatidylethanolamine (24), [HPO4CH2CH(OH)CH2OH] − (171.006) for phosphatidylglycerol (25), [HPO4CH2CH(OH)CH2OH] − (241.003) for phosphatidylinositol (26), and [NH3C(CH2)COOH] − (88.040) for phosphatidylserine.4 For complete analysis see supplemental data.
Gt Activation Assay
Gt was purified as described previously (12). Rho was purified by gel filtration in different detergents, including 3 mm DDM, 0.5 mm TDM, or 0.05 mm HDM. The following fractions were used in the fluorescence assay of Gt activation: fraction 35 in DDM, fraction 31 in TDM, and fraction 22 in HDM. The ratio of Gt to Rho was ~9:1, with Gt at a concentration of 250 nm and Rho at 30 nm, within the linear range of fluorescence change and protein concentration. The sample was bleached for 15 s using a Fiber-Lite covered with a long pass wavelength filter (>490 nm), followed by 10 min of incubation with continuous low speed stirring. The intrinsic fluorescence increase from Gtα was measured with a PerkinElmer LS 50B Luminescence Spectrophotometer, employing excitation and emission wavelengths at 300 and 345 nm, respectively (27–29). No signals from Rho without Gt were detected in the control experiment.
Protein Concentration Measurements and Rho Stability
Rho concentration was determined using a PerkinElmer Lambda 800 UV-visible spectrophotometer in the range of 250–650 nm. Rho samples, freshly purified by gel filtration (fraction 35 in DDM, fraction 31 in TDM, and fraction 22 in HDM), were incubated at 50 °C while being monitored by UV-Vis absorption spectra with or without 20 mm neutral NH2OH. The recorded absorbance was read at 500 nm for 2 h. A standard deviation was calculated from three sets of data from parallel experiments.
Meta II Decay Rate
All measurements were performed in 10 nm Rho purified by gel filtration (fraction 35 in DDM, fraction 31 in TDM, and fraction 22 in HDM) dissolved in buffer consisting of 10 mm Bis-Tris propane, 100 mm NaCl, and 3 mm DDM or 0.5 mm TDM or 0.05 HDM, pH 6.0, which favors the formation of Meta II. A PerkinElmer LS 50B Luminescence Spectrophotometer was used to measure the intrinsic fluorescence increase due to Trp residues, which is correlated with the decrease in the protonated Schiff base concentration (data not shown, consistent with Refs. 30–33). Rho was bleached by a Fiber-Lite illuminator covered with a long pass wavelength filter (>490 nm) for 15 s immediately before the fluorescence measurements. Bleaching was carried out from a distance of 15 cm to prevent heat accumulation, and a thermostat was applied to stabilize the temperature of the cuvette at 20 °C. Fluorometer slit settings were 2.5 nm at 295 nm for excitation and 8.0 nm at 330 nm for emission.
RESULTS
The Effect of Detergent on the Oligomeric State of Rho
We investigated the effect of DDM, TDM, and HDM on the oligomeric state of Rho. These detergents have the same head group but contain alkyl chains of different lengths (12, 14, and 16 carbon atoms). Membrane proteins of ROS (1 mg/ml of proteins) were solubilized in 10 mm DDM, 20 mm TDM, or 20 mm HDM (see “Materials and Methods”), and proteins were fractionated using gel filtration chromatography equilibrated with the appropriate detergent. In 3 mm DDM (17 × its CMC), monomeric and dimeric Rho appeared mainly in fractions 34–35 (Fig. 1A, upper panel). In 0.5 mm TDM (50 × its CMC), Rho appeared with a peak in fraction 31 (Fig. 1B, upper panel). In 0.05 mm HDM (83 × its CMC), Rho appeared very early, mainly in fractions 22–23 (Fig. 1C, upper panel), suggesting its presence as oligomers. When the ROS sample was titrated with increased concentration of HDM from 0.05 to 0.5 mm, a similar pattern of elution was observed in gel filtration, suggesting that oligomers are present because of intrinsic stability of the complexes and not because of insufficient amount of detergent. The calculation of the molecular mass of the Rho complexes was supported by the control experiments in which ROS membranes cross-linked with dithiobis(succinimidylpropionate) were solubilized by the same detergents and fractionated by gel filtration column in the same conditions as non-cross-linked ROS (data not shown) (12). Absorption spectra of Rho purified by gel filtration in examined detergents were measured (Fig. 1, upper panels, insets). The same maximum of absorption at 500 nm was observed. However, the ratio in absorption 280/500 nm was higher for Rho preparation in HDM (2.9) compared with DDM (2.0) and TDM (2.3). All of these observations indicate that both TDM and HDM preserve the oligomeric structure or that these detergents extract lipids and induce Rho to form Rho aggregates.
FIGURE 1. Gel filtration and absorption spectra of ROS membranes solubilized in DDM, TDM, or HDM (upper panels and insets in top left corners) and TEM images of negatively stained Rho purified in DDM (fraction 35), TDM (fraction 31), and HDM (fraction 22) (bottom panels).
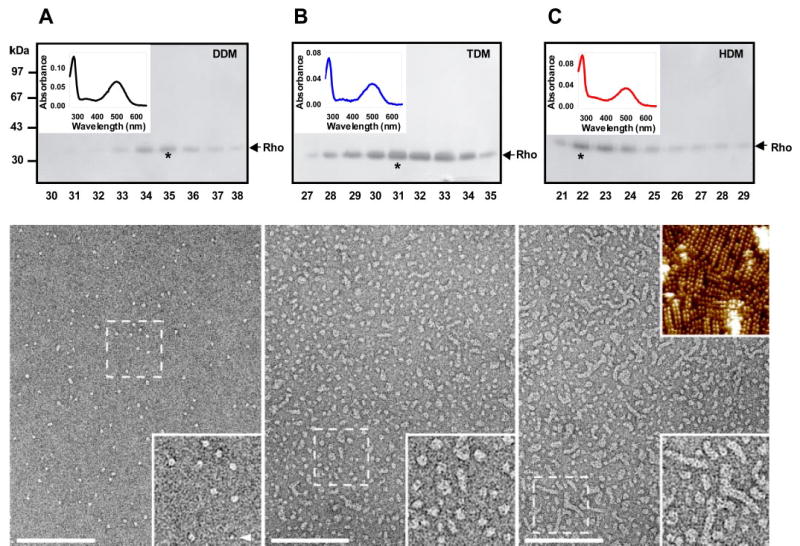
ROS membranes were solubilized in 10 mm DDM, 20 mm TDM, or 20 mm HDM and loaded onto a gel filtration column equilibrated with buffer containing 3 mm DDM (A), 0.5 mm TDM (B), or 0.05 mm HDM (C). For each detergent, the upper panel shows the results from SDS-PAGE of fractions (30 μl) containing protein from gel filtration chromatography. Fractions containing the highest concentration of Rho are denoted by *, and their absorption spectra are shown in the left corners. Similar results were obtained in three independent experiments. TEM images of negatively stained ROS membranes solubilized in DDM, TDM, or HDM and purified by gel filtration: Rho fractions in DDM (A), in TDM (B) and in HDM (C). The regions denoted by the broken squares are magnified and displayed in the right bottom corners of the bottom panels. The arrowhead in the inset of panel A, bottom, displays a potential Rho monomer. The inset in the top right corner of panel C, bottom, represents an atomic force microscopy topography of a native disk membrane. Scale bars, 150 nm. Insets are 102 nm wide.
TEM of Negatively Stained Purified Rho
Rho solubilized in DDM, TDM, or HDM exhibits different migration patterns on gel filtration columns, suggesting that the protein exists in different oligomeric states in the various detergents. We used TEM and negative staining to visualize the oligomeric state of Rho in protein peaks coming from size exclusion chromatography in the three detergents. In DDM, there were two populations of particles (Fig. 1A, bottom panel). The larger particles (major population) had a length of 7.2 ± 0.9 nm (n = 34) and a width of 6.5 ± 0.8 nm (n = 34) and frequently exhibited two elongated domains that were at a center-to-center distance of 3.6 ± 0.4 nm (n = 30). Similar values were previously found for detergent-solubilized Rho dimers (6). The smaller particles (minor population) had a length of 5.4 ± 0.5 nm (n = 24) and a width of 3.2 ± 0.6 nm (n = 24). These particles did not reveal a distinct substructure and exhibited dimensions compatible with monomeric Rho (34, 35).
In TDM, although the sample was not fully homogeneous, two significant populations of particles with average diameters of 9.1 ± 0.4 nm (n = 33) and 12.6 ± 0.5 nm (n = 30) were discerned (Fig. 1B). Worm-like structures having a width of 8.6 ± 0.7 nm (n = 33) were present as well (see Fig. 1B, bottom panel). In HDM the sample was not homogeneous either, but most of the particles were significantly bigger than those observed in TDM and many displayed a worm-like structure (Fig. 1C, bottom panel). These particles of varying lengths had consistent widths of ~8.2 ± 0.6 nm (n = 26). A similar value was found for rows of Rho dimers in native disk membranes by atomic force microscopy (Fig. 1C, bottom panel, upper inset) (7, 9, 10). Atomic force microscopy analysis of the structures in HDM revealed a height of 6.8 ± 1.0 nm (n = 60; data not shown), which is in good agreement with the height of Rho perpendicular to the membrane (34, 35). This finding strongly suggests that HDM, even at concentrations much above its CMC, is unable to disrupt tightly packed Rho structures. This might be attributed to the mildness of this detergent that preserves the native lipids in Rho oligomers. Therefore we examined the phospholipid content of the Rho samples obtained by solubilization and gel filtration purification in DDM, TDM, and HDM. Typically, in disk membranes ~65–75 phospholipids/Rho molecule are present (36, 37). We found that in the sample purified in DDM, the phospholipid:Rho mole ratio was 22.0 ± 3. In the sample purified in TDM, the ratio was 24.0 ± 4. The sample purified in HDM contained 44.0 ± 8 phospholipids/Rho molecule. No specific depletion of phospholipids was observed as determined by mass spectrometric analysis (see supplemental data).
Gt Activation by Meta II
Differences in the oligomeric state of Rho caused by solubilization in the investigated detergents influence the rate of activation of Gt. Rho purified by gel filtration in 3 mm DDM, 0.5 mm TDM, or 0.05 mm HDM was used to activate Gt, a process monitored at 345 nm (Fig. 2A, B, and C, respectively) (28, 29, 33). Conditions for the assay were chosen so that the Gt activation rate was the same as that determined by GTPγS-induced complex dissociation (27). Initial activation rates were determined during the first 200 s after GTPγS addition. In all experiments, an increase of fluorescence was observed, but in the case of Rho purified in TDM the reaction was two times faster, and for Rho purified in HDM the reaction was several times faster and with higher apparent cooperativity than for Rho purified in DDM. These results suggest that Rho oligomers observed by TEM in HDM (Fig. 1C, bottom panel) represent the most active form of Rho* as compared with Rho isolated in DDM and TDM. The oligomeric organization of Rho has important implications for the fast response of the activated receptor and, thus, signal amplification.
FIGURE 2. Gt activation by Meta II.
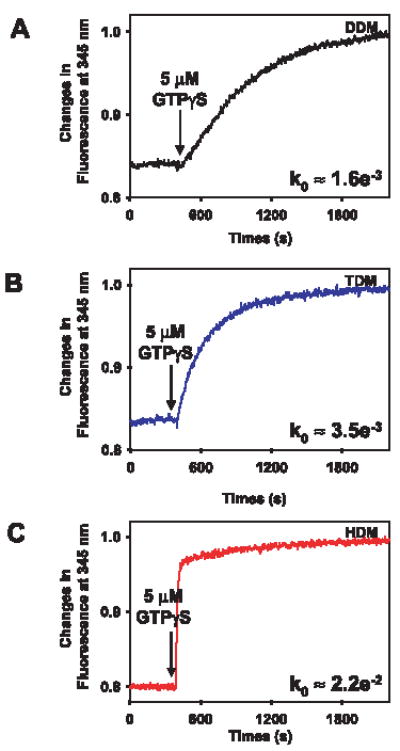
The intrinsic fluorescence increase of Gtα subunits upon activation due to interaction with Meta II obtained from Rho purified by gel filtration (fraction 35 in DDM, fraction 31 in TDM, and fraction 22 in HDM). The reaction was carried out at 20 °C in a continuously stirred cuvette with 30 nm Rho and 250 nm Gt in 20 mm Bis-Tris propane, 120 mm NaCl, 6 mm MgCl2, and 3 mM DDM (pH 7.5) (A) or 0.5 mM TDM (B) or 0.05 mm HDM (C). 5 μm GTPγS was added to initiate the reaction. The fluorescence excitation was at 300 nm, and emission was measured at 345 nm. The initial activation rates (k0) were calculated from three independent experiments.
In HDM where Rho was present as the highest oligomers and the Gt activation was the fastest, the largest amount of phospholipid was attached to Rho. To determine whether phospholipids alone can influence the ability of Rho to activate Gt, the Gt activation assay was performed in samples containing the excess of exogenous phospholipids. Phosphatidylserine, phosphatidylethanolamine, phosphatidylcholine, and phosphatidylinositol were added to Rho purified by size exclusion chromatography in DDM with the ratio of 100 phospholipids:Rho molecule. We did not detect any effect of exogenous phospholipids on the Gt activation rate (data not shown). A possible explanation for these results might be that the detergent present in the solution sequestered both phospholipids and Rho, preventing formation of Rho oligomers. These results suggest that lipids affect Rho properties indirectly by preservation of its oligomeric status.
Meta II Decay
Trp residues exhibit only weak fluorescence in dark state Rho, with the maximum fluorescence at 330 nm. Following bleaching and formation of Meta II, Trp fluorescence increases (30–32). The decay rates of Meta II Rho purified by gel filtration chromatography in DDM, TDM, and HDM were examined by measuring changes in Trp emission at 330 nm (Fig. 3A, B, and C). When the data were fitted to a first-order reaction, relaxation times of τ = 17.5 min for Rho in DDM, τ = 20.4 min for Rho in TDM, and τ = 24.6 min for Rho in HDM were measured. Therefore, Meta II decay is quite similar in all used detergents, DDM, TDM, and in HDM.
FIGURE 3. Meta II decay of Rho purified by gel filtration.
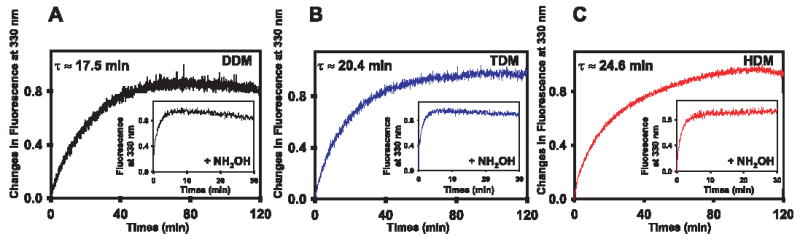
Meta II decay of Rho purified in DDM (fraction 35) (A), in TDM (fraction 31) (B), and in HDM (fraction 22) (C). The fluorescence excitation was at 295 nm, and emission was measured at 330 nm. Insets, Meta II decay in the presence of NH2OH. The relaxation times (τ) were calculated from three independent experiments.
Because NH2OH promotes removal of the chromophore from the binding site(s) following illumination, a rapid increase in fluorescence was seen for Rho in all three detergents in the presence of NH2OH. No significant differences were observed between them (Fig. 3, A–C, and insets), suggesting that although oligomerization may affect normal channeling of the chromophore, the difference in Rho decay is alleviated in the presence of the strong nucleophile.
Rho Stability
Time-dependent denaturation of Rho purified by gel filtration in DDM, TDM, or HDM was also measured. Rho in TDM and HDM (Fig. 4, B and C, filled circles) was more stable than Rho in DDM (Fig. 4A, filled circles). After 2 h of incubation at 50 °C, 60% of Rho in DDM lost its chromophore, whereas Rho in both TDM and HDM was very stable (Fig. 4, B and C, filled circles), indicating that the tightly packed oligomeric state protects the protein from denaturing. This difference in stability between the different forms of Rho was not diminished even when a strong nucleophile, NH2OH, was added (Fig. 4, A–C, empty circles), suggesting that the highly organized Rho is more stable than the dissociated Rho in DDM (Fig. 4A, empty circles).
FIGURE 4. Stability of Rho purified by gel filtration.
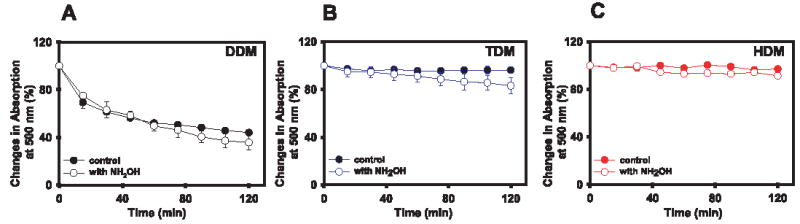
Rho purified in DDM (fraction 35) (A), in TDM (fraction 31) (B), and in HDM (fraction 22) (C) were incubated at 50 °C with or without 20 mm NH2OH. The absorbance at 500 nm was measured every 15 min for 2 h. The results are plotted assuming 100% absorption at the initial point. Error bars represent the standard deviations estimated from three independent experiments.
DISCUSSION
Increasing evidence supports the idea that GPCRs in membranes exist as homo- and/or heterodimeric complexes (2). Furthermore, these dimers may be organized into higher order structures (for example, see Refs. 1, 3, 7, 9, 38). The oligomeric structures appear to be preserved among other GPCRs because they are essential for biosynthesis, cellular transport, diversification, and degradation (reviewed in Ref. 2). Mutagenesis studies on serotonin 5-HT2C further support the stoichiometry of two GPCRs/one G protein molecule (39). Here we tested the influence of alkyl-maltosides on the preservation of Rho oligomers as well as on the relationship between the quaternary structure of Rho and its signal transduction capacity. Rho solubilized in three different detergents was purified by gel filtration chromatography, and protein particles of different molecular masses were visualized by TEM. TDM and HDM have the same polar groups as the widely used DDM, but they contain longer alkyl chains (14 and 16 instead of 12 carbon atoms). This is expected to have an effect on the stability of the oligomeric structure of Rho. It has been shown that purified leukotriene B4 receptor BLT1 is more stable in detergents with long hydrophobic chains than in detergents with short chains (5, 40).
Alternatively, TDM and HDM might extract more lipids during solubilization than DDM, causing receptor aggregation or oligomeric structure preservation. We found no significant change in the different types of phospholipids among all solubilized Rho preparations, but approximately twice as many total phospholipids were associated with Rho purified in HDM than in DDM and TDM. As observed earlier, CHAPS also has the ability to extract similar amounts of phospholipids, and a higher oligomeric organization of Rho in this detergent was reported (12, 41).
By negative stain TEM we have observed that Rho solubilized in 3 mm DDM exhibited a bimodal size distribution. The larger particles comprised the predominant population and possessed shapes and dimensions similar to previously examined Rho dimers (6). The loss of Gt activation capacity of these preparations is apparently related to the disruption of Rho oligomers by solubilization in DDM. HDM-solubilized Rho, however, revealed a more heterogeneous particle distribution exhibiting a large variation in shape and size. The frequent worm-like structures had a width compatible with those of the rows of Rho dimers seen by atomic force microscopy in native disk membranes (7, 9, 10). When considering G protein coupling, there is a strong possibility that GPCRs are induced to be organized into dimers or higher oligomers. However, our results strongly support the hypothesis that the functionally most active unit of Rho is a dimer organized in higher ordered structures. Therefore, the oligomeric organization of Rho has important implications for Gt recognition, binding kinetics, signal amplification, and termination. Our experiments demonstrate that Rho activity goes down in the samples containing fewer dimers. In DDM where a mixture of Rho monomers and dimers was observed, the activity of Rho is the lowest and it increases with higher oligomerization. In HDM, where the highest oligomers were present, Rho appears to be the most active. These results explain how the dense packing and high organization of Rho molecules is important for rapid light signal transmission.
Our results from biochemical analyses together with mass spectrometric analysis of lipids suggest that lipids affect Rho properties indirectly by preservation of its oligomeric status. Rho oligomers in TDM and HDM display higher stability than Rho in DDM. This is not surprising, considering that Rho could be stabilized by additional interactions between neighboring Rho molecules.
In summary, for the first time for any GPCR we have isolated different oligomeric complexes of Rho. We find that oligomeric Rho is the active form, whereas monomeric Rho may have lost the ability to efficiently activate Gt. This suggests that oligomerization of GPCRs may be crucial for signal transduction.
Acknowledgments
We thank Dr. Paul Park for experiments using atomic force microscopy and Dr. Marcin Golczak for help with phospholipid analysis.
Footnotes
This work was supported in part by NEI, National Institutes of Health Grants EY01730 and EY08061 and NIGMS, National Institutes of Health Grant GM63020.
The on-line version of this article (available at http://www.jbc.org) contains supplemental Figs. S1–S6 and supplemental Tables S1–S4.
The abbreviations used are: GPCR, G protein-coupled receptor; DDM, n-dodecyl-β-d-maltoside; TEM, transmission electron microscopy(e); TDM, n-tetradecyl-β-d-maltoside; HDM, n-hexadecyl-β-d-maltoside; Gt, rod photoreceptor G protein (transducin or Gt); Meta II (or Rho*); photoactivated Rho; Rho, rhodopsin; (R)OS: (rod) outer segment(s); CMC, critical micelle concentration; CHAPS, 3-[(3-cholamidopropyl)dimethylammonio]-1-propanesulfonic acid.
G. F. Jang and K. Palczewski, unpublished data.
References
- 1.Park PS, Filipek S, Wells JW, Palczewski K. Biochemistry. 2004;43:15643–15656. doi: 10.1021/bi047907k. [DOI] [PMC free article] [PubMed] [Google Scholar]
- 2.Terrillon S, Bouvier M. EMBO Rep. 2004;5:30–34. doi: 10.1038/sj.embor.7400052. [DOI] [PMC free article] [PubMed] [Google Scholar]
- 3.Filipek S, Krzysko KA, Fotiadis D, Liang Y, Saperstein DA, Engel A, Palczewski K. Photochem Photobiol Sci. 2004;3:628–638. doi: 10.1039/b315661c. [DOI] [PubMed] [Google Scholar]
- 4.Fanelli F, De Benedetti PG. Chem Rev. 2005;105:3297–3351. doi: 10.1021/cr000095n. [DOI] [PubMed] [Google Scholar]
- 5.Baneres JL, Parello J. J Mol Biol. 2003;329:815–829. doi: 10.1016/s0022-2836(03)00439-x. [DOI] [PubMed] [Google Scholar]
- 6.Suda K, Filipek S, Palczewski K, Engel A, Fotiadis D. Mol Membr Biol. 2004;21:435–446. doi: 10.1080/09687860400020291. [DOI] [PMC free article] [PubMed] [Google Scholar]
- 7.Liang Y, Fotiadis D, Filipek S, Saperstein DA, Palczewski K, Engel A. J Biol Chem. 2003;278:21655–21662. doi: 10.1074/jbc.M302536200. [DOI] [PMC free article] [PubMed] [Google Scholar]
- 8.Guo W, Shi L, Filizola M, Weinstein H, Javitch JA. Proc Natl Acad Sci U S A. 2005;102:17495–17500. doi: 10.1073/pnas.0508950102. [DOI] [PMC free article] [PubMed] [Google Scholar]
- 9.Fotiadis D, Liang Y, Filipek S, Saperstein DA, Engel A, Palczewski K. Nature. 2003;421:127–128. doi: 10.1038/421127a. [DOI] [PubMed] [Google Scholar]
- 10.Fotiadis D, Liang Y, Filipek S, Saperstein DA, Engel A, Palczewski K. FEBS Lett. 2004;564:281–288. doi: 10.1016/S0014-5793(04)00194-2. [DOI] [PMC free article] [PubMed] [Google Scholar]
- 11.Liang Y, Fotiadis D, Maeda T, Maeda A, Modzelewska A, Filipek S, Saperstein DA, Engel A, Palczewski K. J Biol Chem. 2004;279:48189–48196. doi: 10.1074/jbc.M408362200. [DOI] [PMC free article] [PubMed] [Google Scholar]
- 12.Jastrzebska B, Maeda T, Zhu L, Fotiadis D, Filipek S, Engel A, Stenkamp RE, Palczewski K. J Biol Chem. 2004;279:54663–54675. doi: 10.1074/jbc.M408691200. [DOI] [PMC free article] [PubMed] [Google Scholar]
- 13.Papermaster DS. Methods Enzymol. 1982;81:48–52. doi: 10.1016/s0076-6879(82)81010-0. [DOI] [PubMed] [Google Scholar]
- 14.Moritz OL, Tam BM, Papermaster DS, Nakayama T. J Biol Chem. 2001;276:28242–28251. doi: 10.1074/jbc.M101476200. [DOI] [PubMed] [Google Scholar]
- 15.Mansoor SE, Palczewski K, Farrens DL. Proc Natl Acad Sci U S A. 2006;103:3060–3065. doi: 10.1073/pnas.0511010103. [DOI] [PMC free article] [PubMed] [Google Scholar]
- 16.Stubbs GW, Litman BJ. Biochemistry. 1978;17:215–219. doi: 10.1021/bi00595a003. [DOI] [PubMed] [Google Scholar]
- 17.Folch J, Lees M, Sloane Stanley GH. J Biol Chem. 1957;226:497–509. [PubMed] [Google Scholar]
- 18.White, D. C., and Ringelberg, D. B. (1995) in Signature Lipid Biomarker Analysis (Burlage, R. S., Atlas, R., Stahl, D., Geesey, G., and Sayler, G., eds) pp. 255–272, Oxford University Press, New York
- 19.Griffiths WJ. Mass Spectrom Rev. 2003;22:81–152. doi: 10.1002/mas.10046. [DOI] [PubMed] [Google Scholar]
- 20.Pulfer MK, Harrison K, Murphy RC. J Am Soc Mass Spectrom. 2004;15:194–202. doi: 10.1016/j.jasms.2003.10.011. [DOI] [PubMed] [Google Scholar]
- 21.Pulfer M, Murphy RC. Mass Spectrom Rev. 2003;22:332–364. doi: 10.1002/mas.10061. [DOI] [PubMed] [Google Scholar]
- 22.Hsu FF, Turk J. J Am Soc Mass Spectrom. 2000;11:797–803. doi: 10.1016/S1044-0305(00)00151-3. [DOI] [PubMed] [Google Scholar]
- 23.Hsu FF, Turk J. J Am Soc Mass Spectrom. 2000;11:892–899. doi: 10.1016/S1044-0305(00)00159-8. [DOI] [PubMed] [Google Scholar]
- 24.Hsu FF, Turk J. J Am Soc Mass Spectrom. 1999;10:600–612. doi: 10.1016/S1044-0305(99)00041-0. [DOI] [PubMed] [Google Scholar]
- 25.Hsu FF, Turk J. J Am Soc Mass Spectrom. 2001;12:61–79. doi: 10.1016/S1044-0305(00)00194-X. [DOI] [PubMed] [Google Scholar]
- 26.Hsu FF, Turk J. J Am Soc Mass Spectrom. 2000;11:986–999. doi: 10.1016/S1044-0305(00)00172-0. [DOI] [PubMed] [Google Scholar]
- 27.Fahmy K, Sakmar TP. Biochemistry. 1993;32:7229–7236. doi: 10.1021/bi00079a020. [DOI] [PubMed] [Google Scholar]
- 28.Farrens DL, Altenbach C, Yang K, Hubbell WL, Khorana HG. Science. 1996;274:768–770. doi: 10.1126/science.274.5288.768. [DOI] [PubMed] [Google Scholar]
- 29.Heck M, Hofmann KP. J Biol Chem. 2001;276:10000–10009. doi: 10.1074/jbc.M009475200. [DOI] [PubMed] [Google Scholar]
- 30.Farrens DL, Khorana HG. J Biol Chem. 1995;270:5073–5076. doi: 10.1074/jbc.270.10.5073. [DOI] [PubMed] [Google Scholar]
- 31.Schadel SA, Heck M, Maretzki D, Filipek S, Teller DC, Palczewski K, Hofmann KP. J Biol Chem. 2003;278:24896–24903. doi: 10.1074/jbc.M302115200. [DOI] [PMC free article] [PubMed] [Google Scholar]
- 32.Heck M, Schadel SA, Maretzki D, Bartl FJ, Ritter E, Palczewski K, Hofmann KP. J Biol Chem. 2003;278:3162–3169. doi: 10.1074/jbc.M209675200. [DOI] [PMC free article] [PubMed] [Google Scholar]
- 33.Fahmy K, Sakmar TP. Biochemistry. 1993;32:9165–9171. doi: 10.1021/bi00086a023. [DOI] [PubMed] [Google Scholar]
- 34.Palczewski K, Kumasaka T, Hori T, Behnke CA, Motoshima H, Fox BA, Le Trong I, Teller DC, Okada T, Stenkamp RE, Yamamoto M, Miyano M. Science. 2000;289:739–745. doi: 10.1126/science.289.5480.739. [DOI] [PubMed] [Google Scholar]
- 35.Teller DC, Okada T, Behnke CA, Palczewski K, Stenkamp RE. Biochemistry. 2001;40:7761–7772. doi: 10.1021/bi0155091. [DOI] [PMC free article] [PubMed] [Google Scholar]
- 36.Calvert PD, Govardovskii VI, Krasnoperova N, Anderson RE, Lem J, Makino CL. Nature. 2001;411:90–94. doi: 10.1038/35075083. [DOI] [PubMed] [Google Scholar]
- 37.Aveldano MI. Arch Biochem Biophys. 1995;324:331–343. doi: 10.1006/abbi.1995.0046. [DOI] [PubMed] [Google Scholar]
- 38.Park PS, Palczewski K. Proc Natl Acad Sci U S A. 2005;102:8793–8794. doi: 10.1073/pnas.0504016102. [DOI] [PMC free article] [PubMed] [Google Scholar]
- 39.Herrick-Davis K, Grinde E, Harrigan TJ, Mazurkiewicz JE. J Biol Chem. 2005;280:40144–40151. doi: 10.1074/jbc.M507396200. [DOI] [PubMed] [Google Scholar]
- 40.Mesnier D, Baneres JL. J Biol Chem. 2004;279:49664–49670. doi: 10.1074/jbc.M404941200. [DOI] [PubMed] [Google Scholar]
- 41.Aveldano MI. Biochemistry. 1988;27:1229–1239. doi: 10.1021/bi00404a024. [DOI] [PubMed] [Google Scholar]